| Tissue | Expression Dynamics | Abbreviation |
| Cervix |  | CC: Cervix cancer |
| HSIL_HPV: HPV-infected high-grade squamous intraepithelial lesions |
| N_HPV: HPV-infected normal cervix |
| Colorectum (GSE201348) |  | FAP: Familial adenomatous polyposis |
| CRC: Colorectal cancer |
| Colorectum (HTA11) |  | AD: Adenomas |
| SER: Sessile serrated lesions |
| MSI-H: Microsatellite-high colorectal cancer |
| MSS: Microsatellite stable colorectal cancer |
| Endometrium | 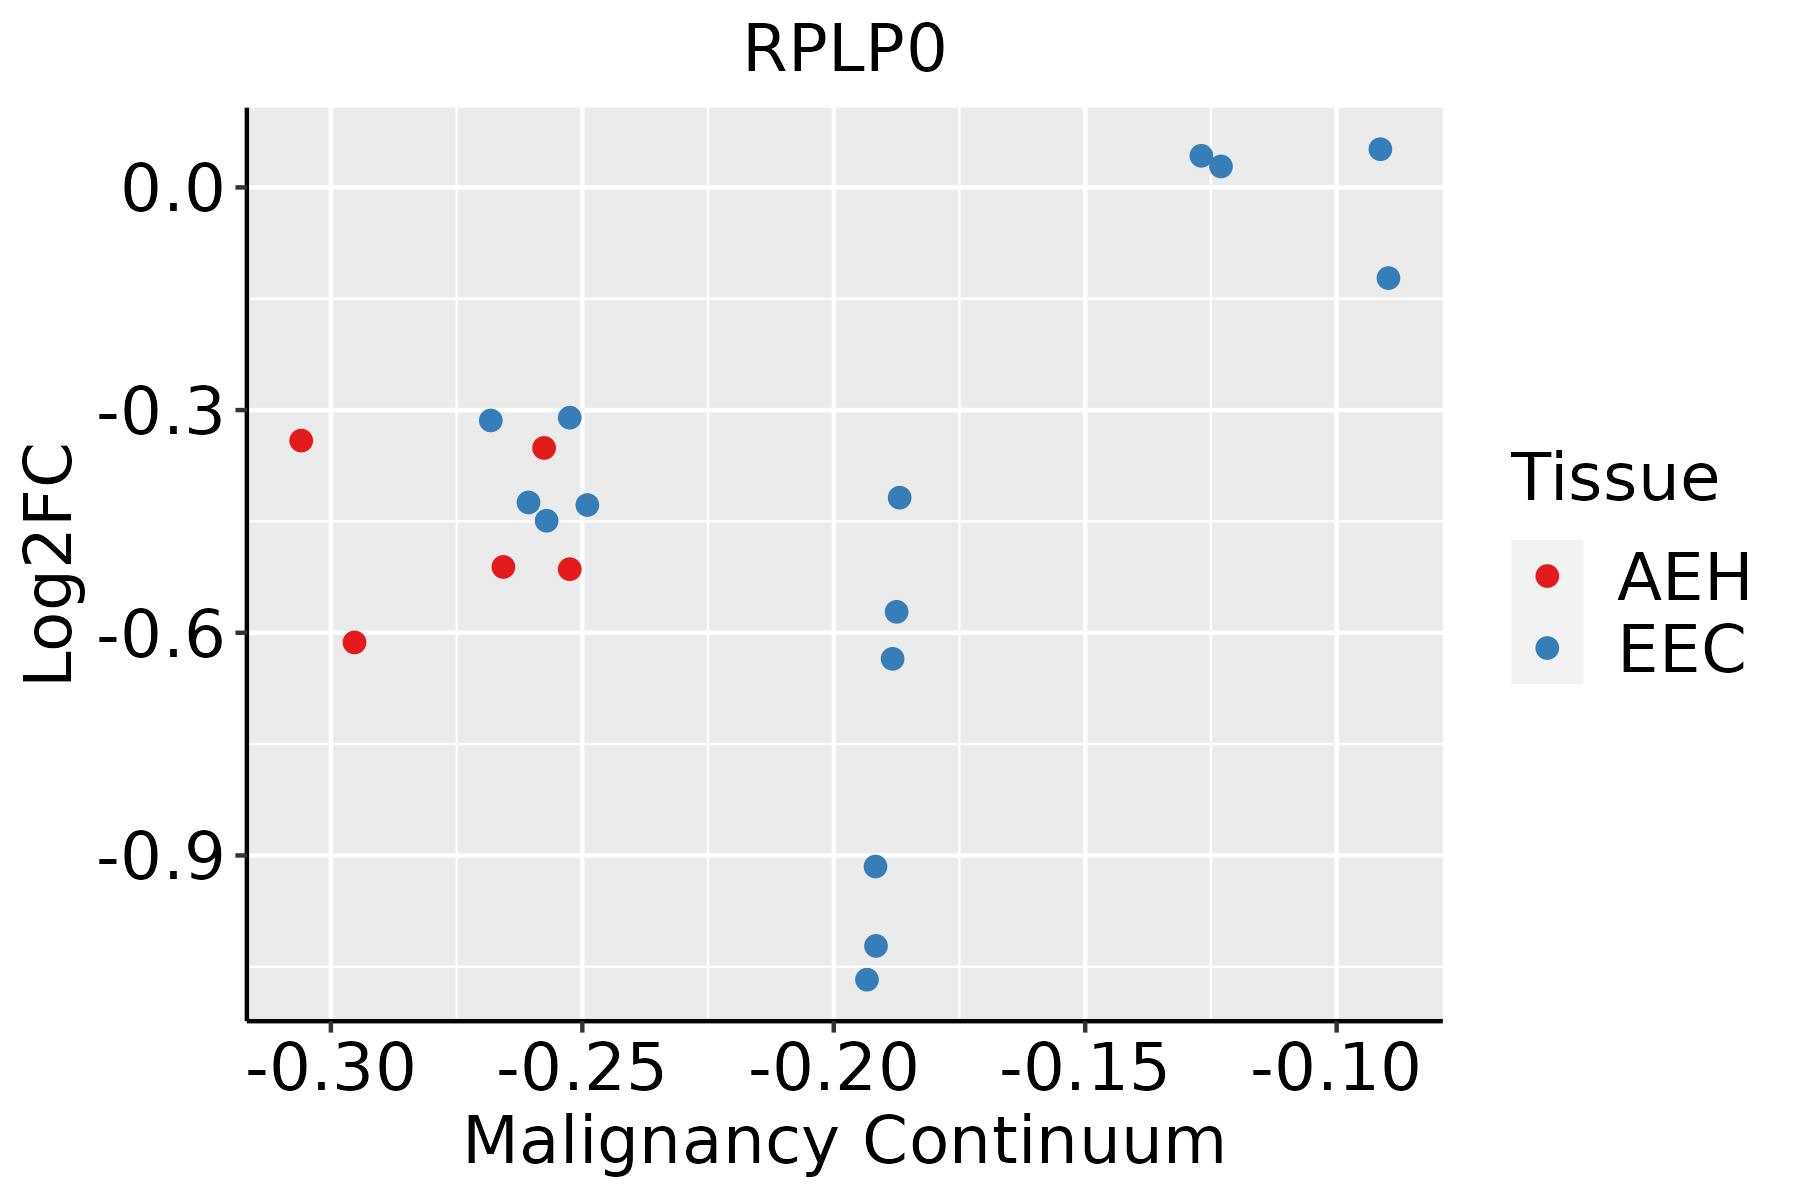 | AEH: Atypical endometrial hyperplasia |
| EEC: Endometrioid Cancer |
| Esophagus | 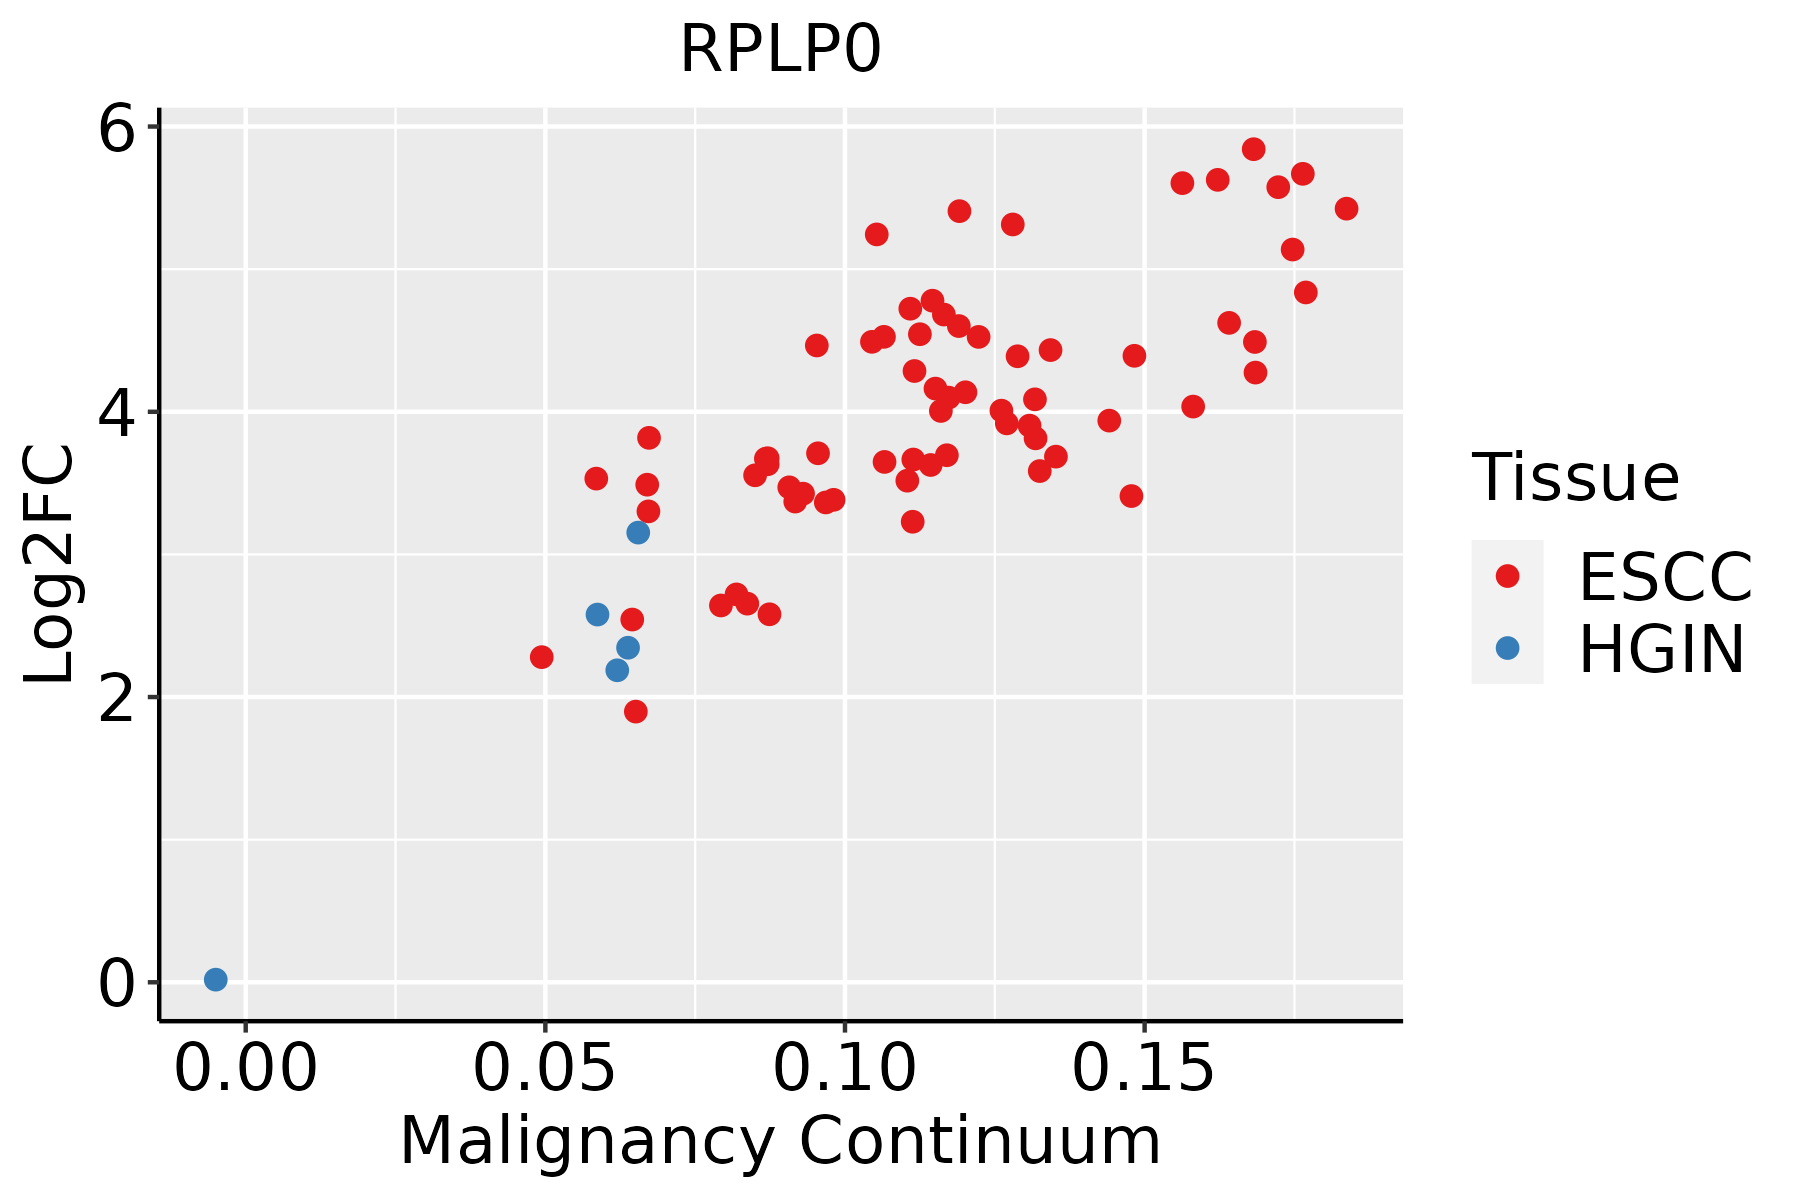 | ESCC: Esophageal squamous cell carcinoma |
| HGIN: High-grade intraepithelial neoplasias |
| LGIN: Low-grade intraepithelial neoplasias |
| GC | 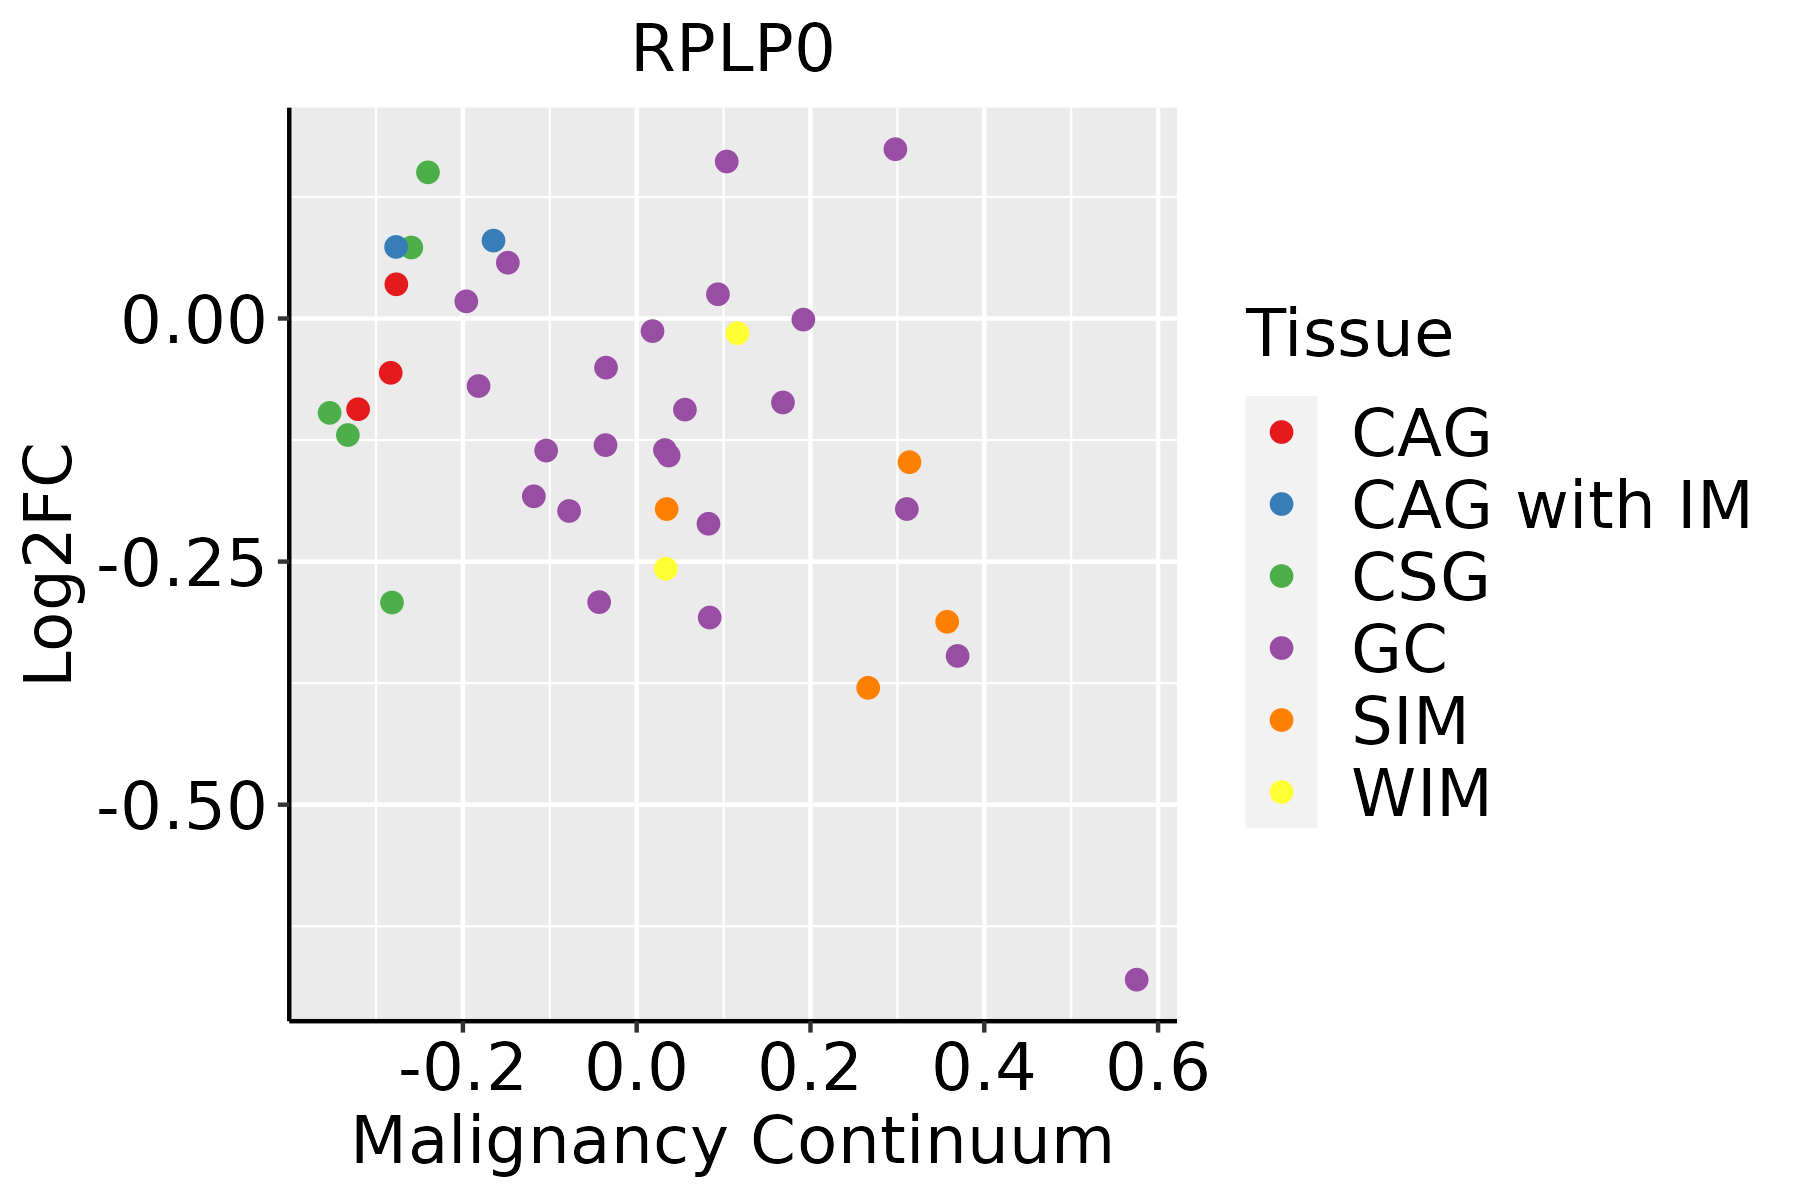 | CAG: Chronic atrophic gastritis |
| CAG with IM: Chronic atrophic gastritis with intestinal metaplasia |
| CSG: Chronic superficial gastritis |
| GC: Gastric cancer |
| SIM: Severe intestinal metaplasia |
| WIM: Wild intestinal metaplasia |
| Liver | 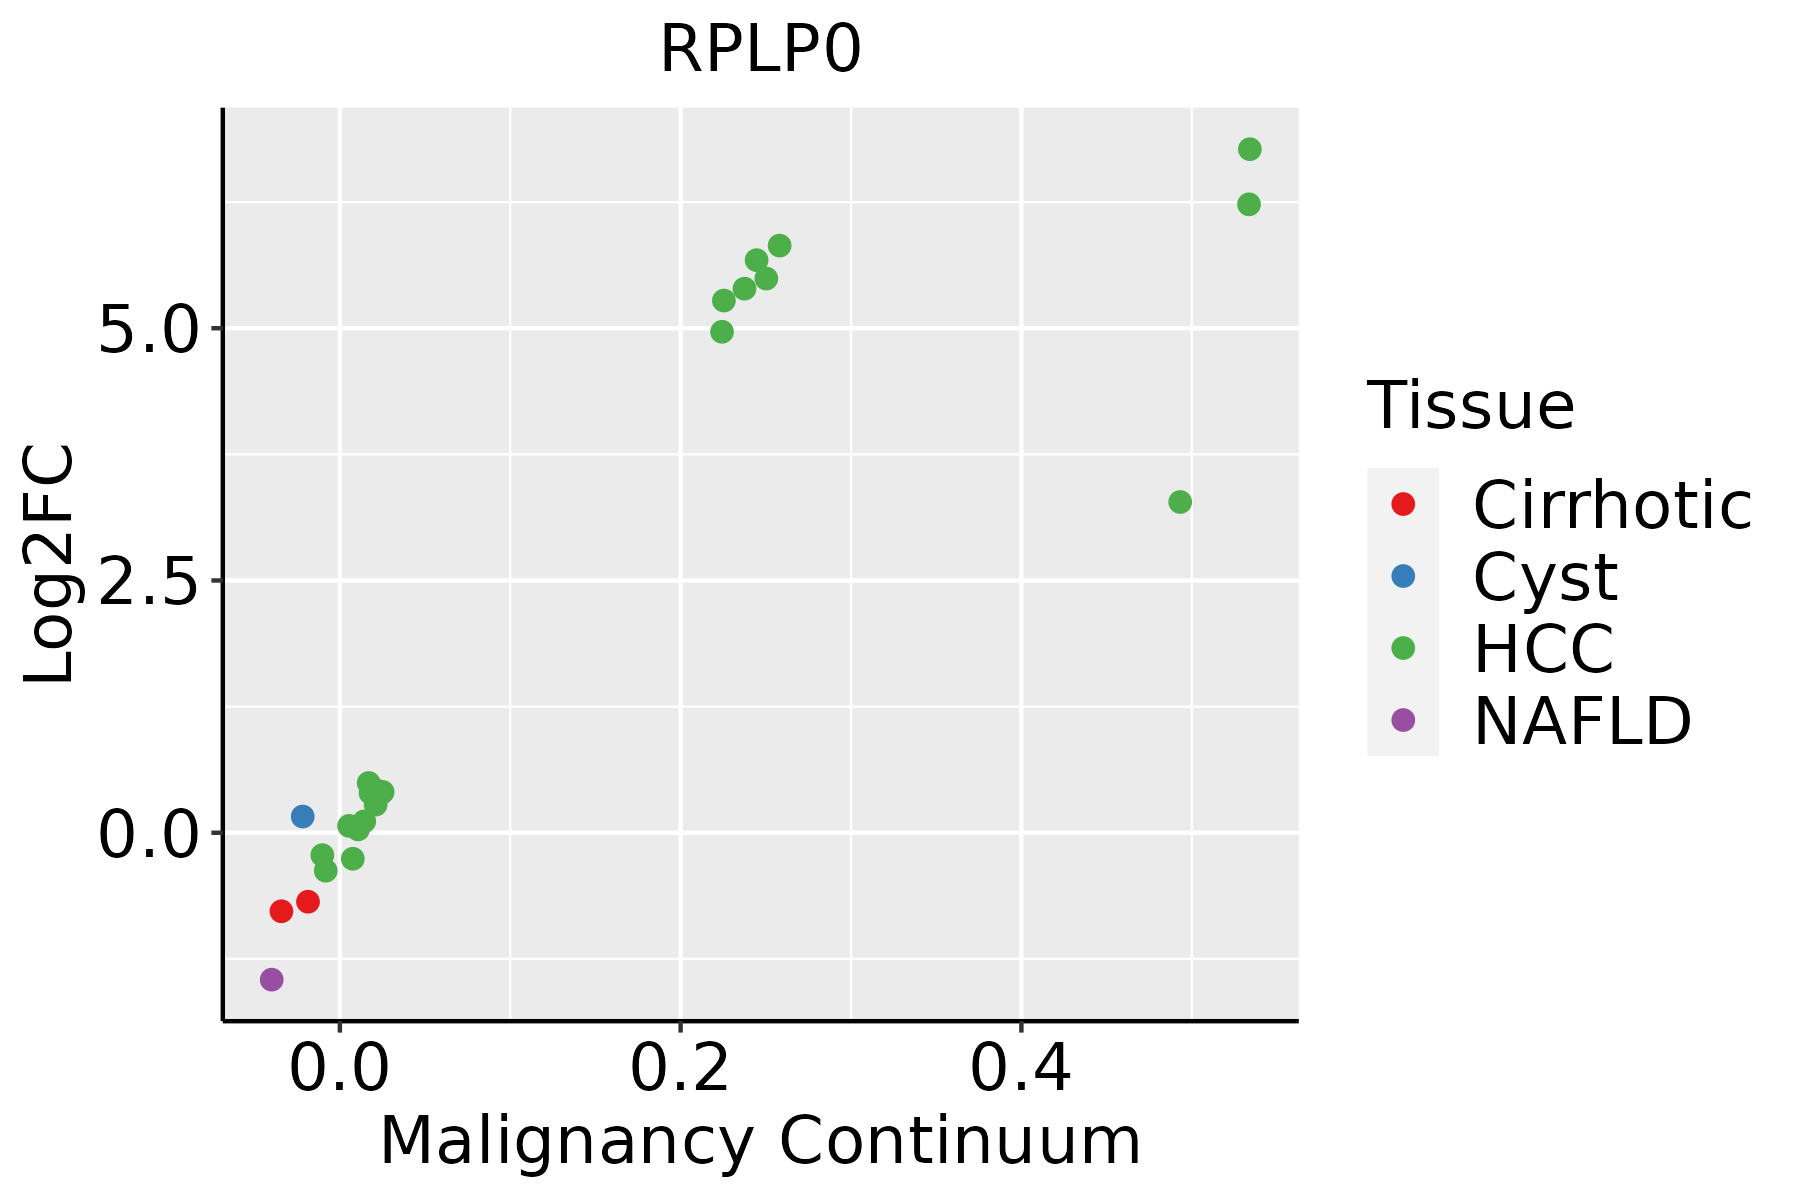 | HCC: Hepatocellular carcinoma |
| NAFLD: Non-alcoholic fatty liver disease |
| Lung |  | AAH: Atypical adenomatous hyperplasia |
| AIS: Adenocarcinoma in situ |
| IAC: Invasive lung adenocarcinoma |
| MIA: Minimally invasive adenocarcinoma |
| Oral Cavity | 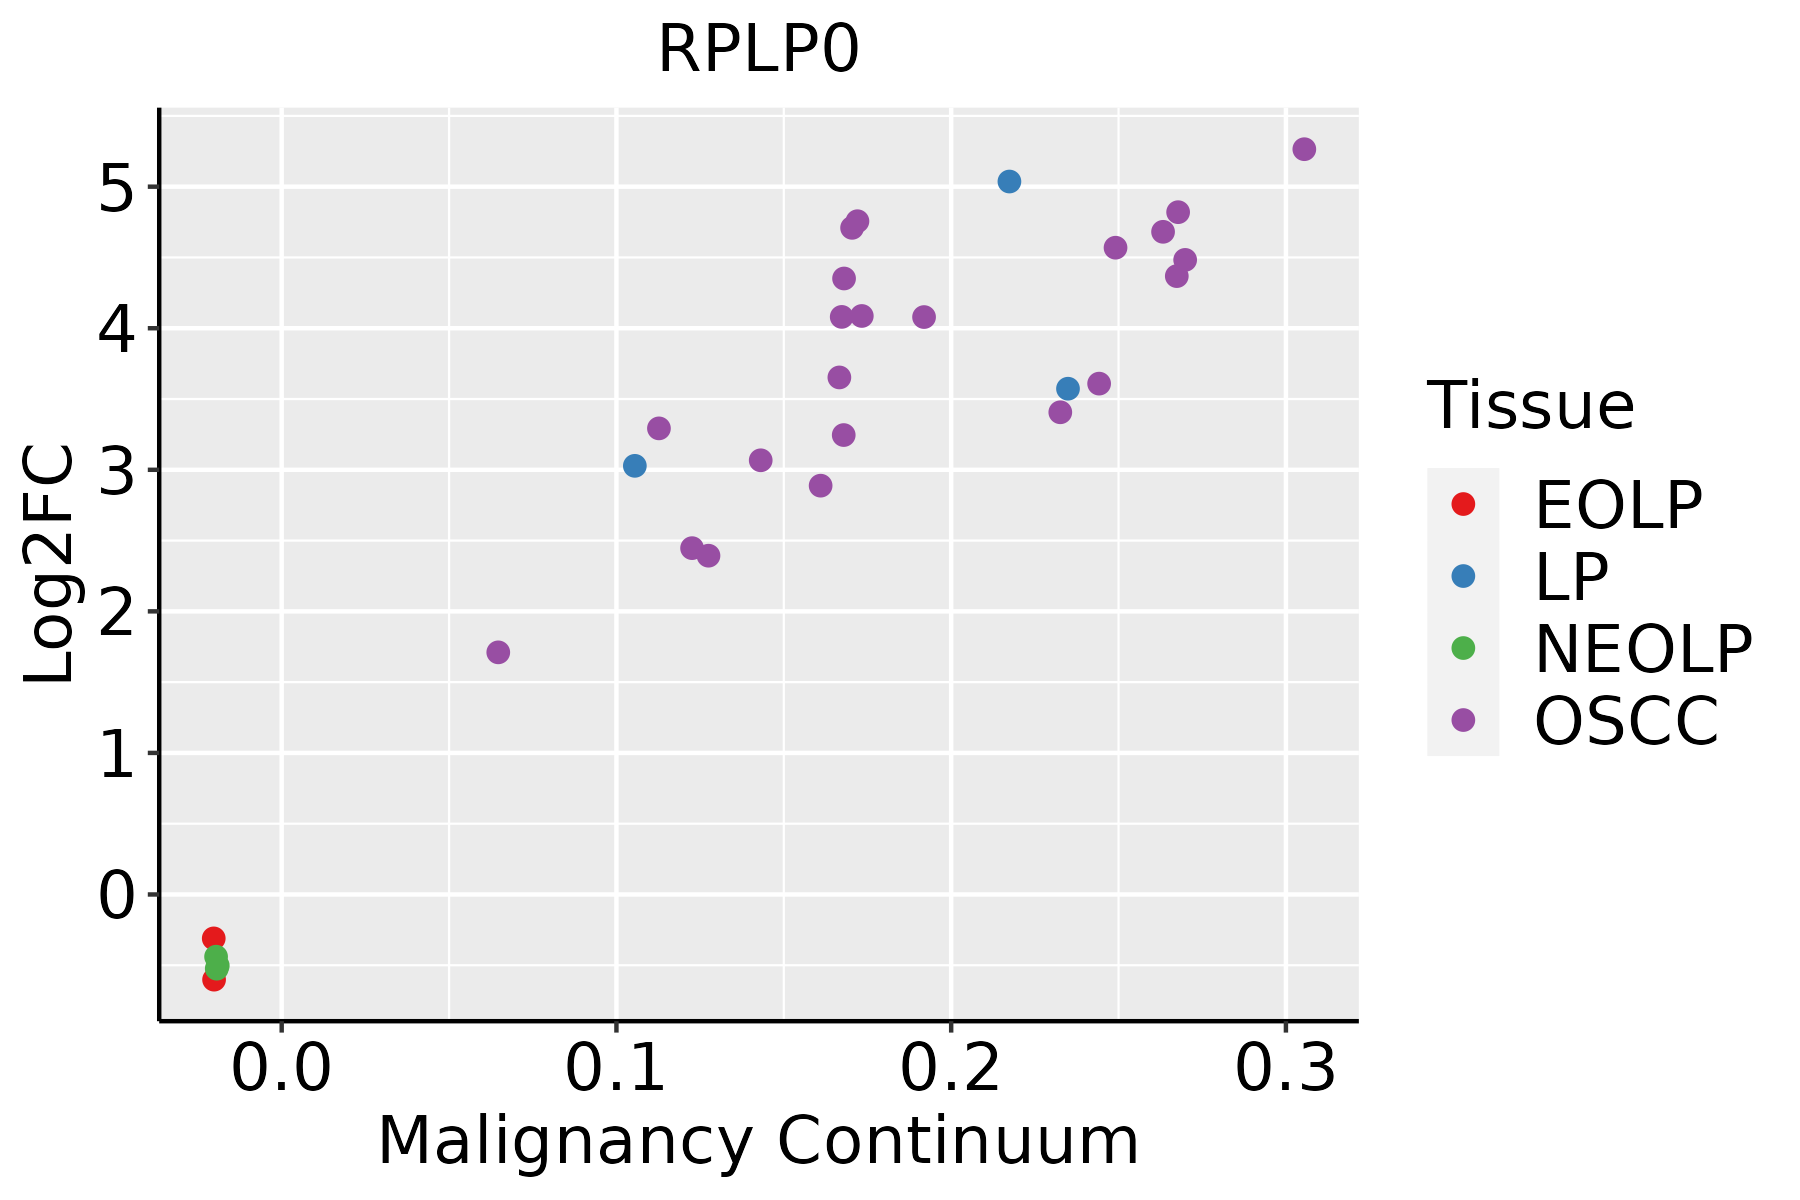 | EOLP: Erosive Oral lichen planus |
| LP: leukoplakia |
| NEOLP: Non-erosive oral lichen planus |
| OSCC: Oral squamous cell carcinoma |
| Prostate | 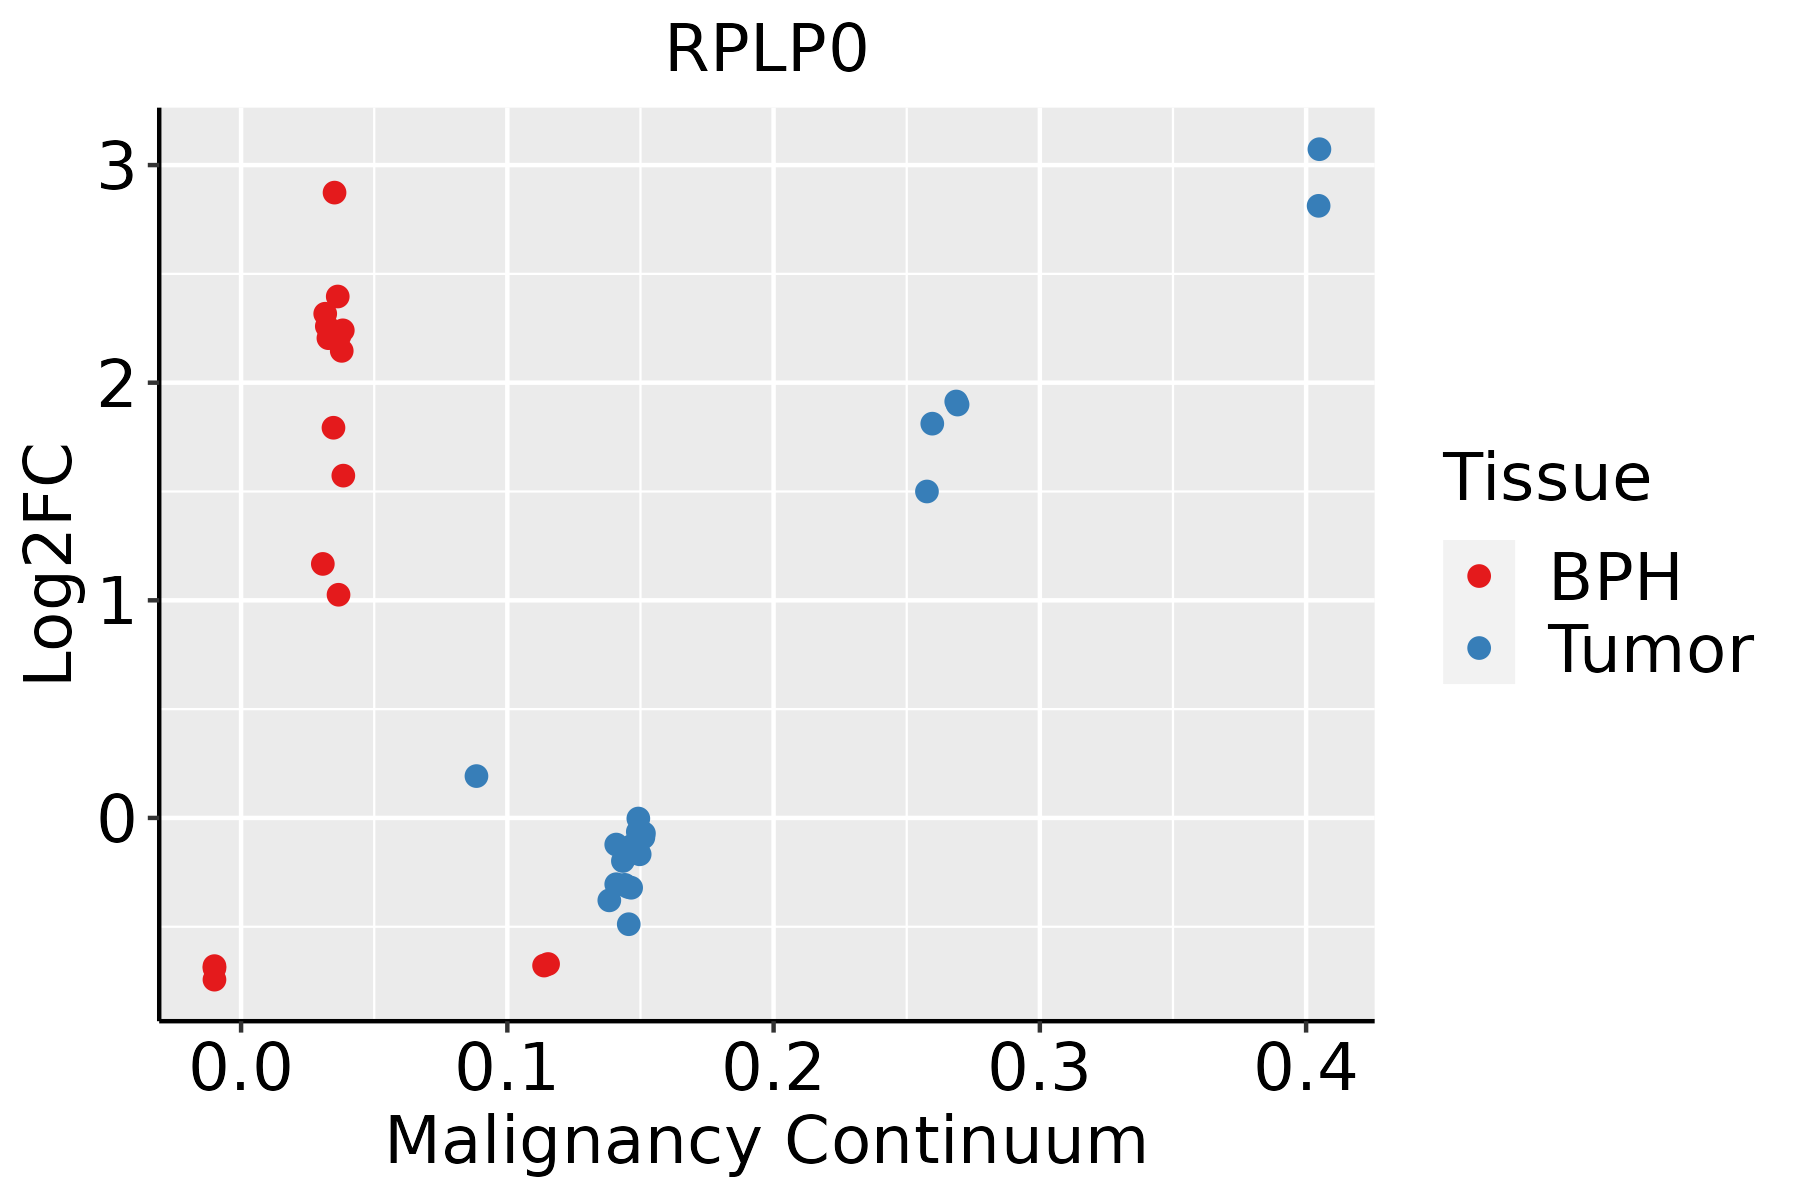 | BPH: Benign Prostatic Hyperplasia |
| Skin |  | AK: Actinic keratosis |
| cSCC: Cutaneous squamous cell carcinoma |
| SCCIS:squamous cell carcinoma in situ |
| Thyroid | 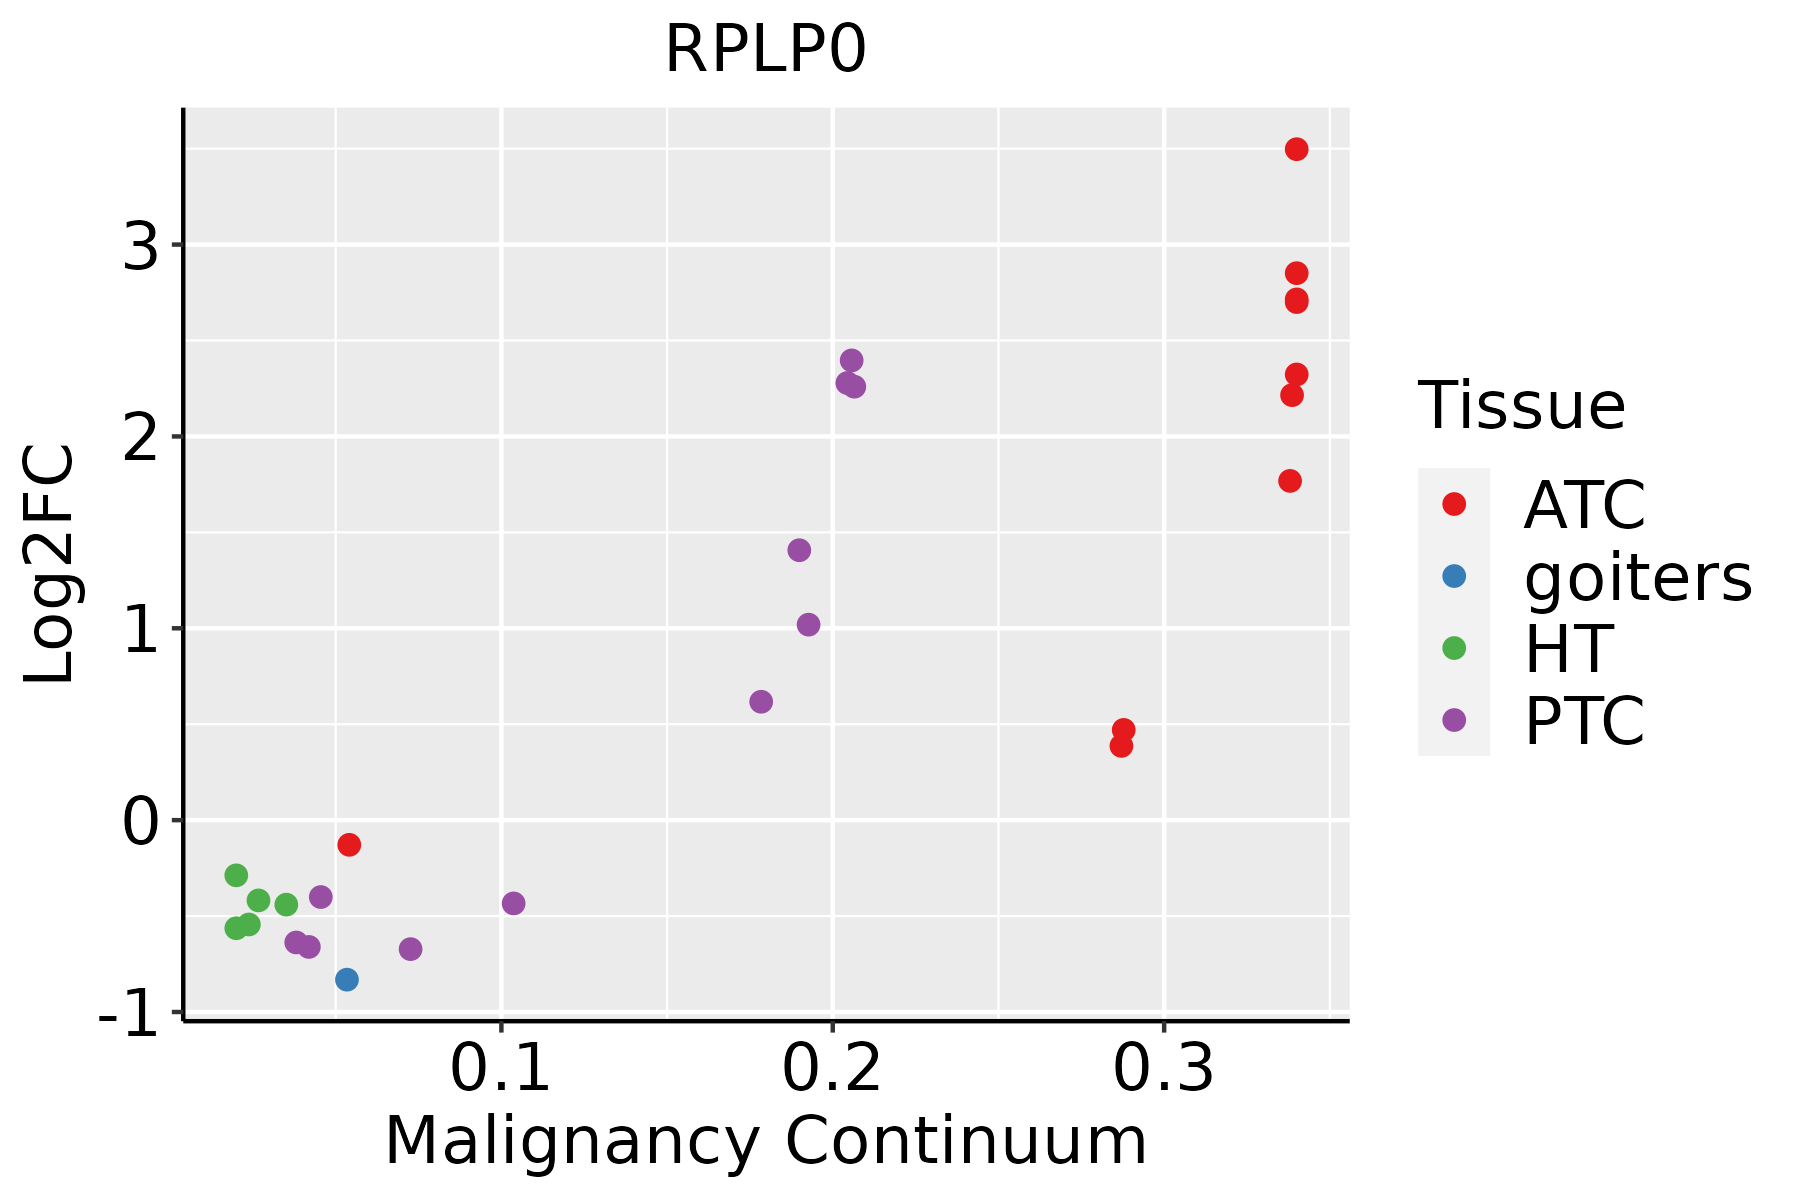 | ATC: Anaplastic thyroid cancer |
| HT: Hashimoto's thyroiditis |
| PTC: Papillary thyroid cancer |
| GO ID | Tissue | Disease Stage | Description | Gene Ratio | Bg Ratio | pvalue | p.adjust | Count |
| GO:000218110 | Cervix | CC | cytoplasmic translation | 96/2311 | 148/18723 | 4.87e-51 | 2.91e-47 | 96 |
| GO:004225510 | Cervix | CC | ribosome assembly | 25/2311 | 61/18723 | 1.70e-08 | 1.27e-06 | 25 |
| GO:004227310 | Cervix | CC | ribosomal large subunit biogenesis | 26/2311 | 72/18723 | 1.87e-07 | 8.48e-06 | 26 |
| GO:002261310 | Cervix | CC | ribonucleoprotein complex biogenesis | 88/2311 | 463/18723 | 2.11e-05 | 3.82e-04 | 88 |
| GO:004225410 | Cervix | CC | ribosome biogenesis | 62/2311 | 299/18723 | 2.48e-05 | 4.27e-04 | 62 |
| GO:002261810 | Cervix | CC | ribonucleoprotein complex assembly | 49/2311 | 220/18723 | 2.52e-05 | 4.29e-04 | 49 |
| GO:000002710 | Cervix | CC | ribosomal large subunit assembly | 12/2311 | 27/18723 | 3.52e-05 | 5.65e-04 | 12 |
| GO:007182610 | Cervix | CC | ribonucleoprotein complex subunit organization | 49/2311 | 227/18723 | 5.91e-05 | 8.54e-04 | 49 |
| GO:000218115 | Cervix | HSIL_HPV | cytoplasmic translation | 86/737 | 148/18723 | 3.97e-82 | 1.91e-78 | 86 |
| GO:004225515 | Cervix | HSIL_HPV | ribosome assembly | 20/737 | 61/18723 | 8.44e-14 | 2.03e-10 | 20 |
| GO:002261315 | Cervix | HSIL_HPV | ribonucleoprotein complex biogenesis | 52/737 | 463/18723 | 9.85e-12 | 6.81e-09 | 52 |
| GO:004225415 | Cervix | HSIL_HPV | ribosome biogenesis | 40/737 | 299/18723 | 1.25e-11 | 6.81e-09 | 40 |
| GO:004227315 | Cervix | HSIL_HPV | ribosomal large subunit biogenesis | 17/737 | 72/18723 | 1.94e-09 | 3.23e-07 | 17 |
| GO:002261815 | Cervix | HSIL_HPV | ribonucleoprotein complex assembly | 29/737 | 220/18723 | 1.19e-08 | 1.30e-06 | 29 |
| GO:007182615 | Cervix | HSIL_HPV | ribonucleoprotein complex subunit organization | 29/737 | 227/18723 | 2.42e-08 | 2.18e-06 | 29 |
| GO:000002715 | Cervix | HSIL_HPV | ribosomal large subunit assembly | 9/737 | 27/18723 | 5.35e-07 | 2.77e-05 | 9 |
| GO:00713533 | Cervix | HSIL_HPV | cellular response to interleukin-4 | 7/737 | 33/18723 | 2.48e-04 | 4.30e-03 | 7 |
| GO:00706703 | Cervix | HSIL_HPV | response to interleukin-4 | 7/737 | 36/18723 | 4.38e-04 | 6.51e-03 | 7 |
| GO:0002181 | Colorectum | AD | cytoplasmic translation | 109/3918 | 148/18723 | 3.40e-43 | 2.13e-39 | 109 |
| GO:0022618 | Colorectum | AD | ribonucleoprotein complex assembly | 92/3918 | 220/18723 | 1.49e-12 | 2.60e-10 | 92 |
| Pathway ID | Tissue | Disease Stage | Description | Gene Ratio | Bg Ratio | pvalue | p.adjust | qvalue | Count |
| hsa0517120 | Cervix | CC | Coronavirus disease - COVID-19 | 111/1267 | 232/8465 | 1.82e-33 | 5.90e-31 | 3.49e-31 | 111 |
| hsa0301020 | Cervix | CC | Ribosome | 85/1267 | 167/8465 | 3.17e-28 | 5.14e-26 | 3.04e-26 | 85 |
| hsa05171110 | Cervix | CC | Coronavirus disease - COVID-19 | 111/1267 | 232/8465 | 1.82e-33 | 5.90e-31 | 3.49e-31 | 111 |
| hsa03010110 | Cervix | CC | Ribosome | 85/1267 | 167/8465 | 3.17e-28 | 5.14e-26 | 3.04e-26 | 85 |
| hsa0301025 | Cervix | HSIL_HPV | Ribosome | 80/459 | 167/8465 | 9.61e-58 | 2.82e-55 | 2.28e-55 | 80 |
| hsa0517125 | Cervix | HSIL_HPV | Coronavirus disease - COVID-19 | 91/459 | 232/8465 | 2.14e-56 | 3.13e-54 | 2.53e-54 | 91 |
| hsa0301035 | Cervix | HSIL_HPV | Ribosome | 80/459 | 167/8465 | 9.61e-58 | 2.82e-55 | 2.28e-55 | 80 |
| hsa0517135 | Cervix | HSIL_HPV | Coronavirus disease - COVID-19 | 91/459 | 232/8465 | 2.14e-56 | 3.13e-54 | 2.53e-54 | 91 |
| hsa03010 | Colorectum | AD | Ribosome | 96/2092 | 167/8465 | 8.28e-20 | 5.54e-18 | 3.54e-18 | 96 |
| hsa05171 | Colorectum | AD | Coronavirus disease - COVID-19 | 113/2092 | 232/8465 | 9.90e-16 | 2.55e-14 | 1.63e-14 | 113 |
| hsa030101 | Colorectum | AD | Ribosome | 96/2092 | 167/8465 | 8.28e-20 | 5.54e-18 | 3.54e-18 | 96 |
| hsa051711 | Colorectum | AD | Coronavirus disease - COVID-19 | 113/2092 | 232/8465 | 9.90e-16 | 2.55e-14 | 1.63e-14 | 113 |
| hsa030102 | Colorectum | SER | Ribosome | 92/1580 | 167/8465 | 2.21e-26 | 3.66e-24 | 2.66e-24 | 92 |
| hsa051712 | Colorectum | SER | Coronavirus disease - COVID-19 | 98/1580 | 232/8465 | 3.33e-17 | 8.50e-16 | 6.17e-16 | 98 |
| hsa030103 | Colorectum | SER | Ribosome | 92/1580 | 167/8465 | 2.21e-26 | 3.66e-24 | 2.66e-24 | 92 |
| hsa051713 | Colorectum | SER | Coronavirus disease - COVID-19 | 98/1580 | 232/8465 | 3.33e-17 | 8.50e-16 | 6.17e-16 | 98 |
| hsa030104 | Colorectum | MSS | Ribosome | 96/1875 | 167/8465 | 1.82e-23 | 2.03e-21 | 1.24e-21 | 96 |
| hsa051714 | Colorectum | MSS | Coronavirus disease - COVID-19 | 108/1875 | 232/8465 | 6.50e-17 | 1.67e-15 | 1.03e-15 | 108 |
| hsa030105 | Colorectum | MSS | Ribosome | 96/1875 | 167/8465 | 1.82e-23 | 2.03e-21 | 1.24e-21 | 96 |
| hsa051715 | Colorectum | MSS | Coronavirus disease - COVID-19 | 108/1875 | 232/8465 | 6.50e-17 | 1.67e-15 | 1.03e-15 | 108 |
| Hugo Symbol | Variant Class | Variant Classification | dbSNP RS | HGVSc | HGVSp | HGVSp Short | SWISSPROT | BIOTYPE | SIFT | PolyPhen | Tumor Sample Barcode | Tissue | Histology | Sex | Age | Stage | Therapy Types | Drugs | Outcome |
| RPLP0 | SNV | Missense_Mutation | | c.784N>A | p.Ala262Thr | p.A262T | P05388 | protein_coding | tolerated(0.05) | possibly_damaging(0.817) | TCGA-BH-A1FG-01 | Breast | breast invasive carcinoma | Female | >=65 | I/II | Unknown | Unknown | SD |
| RPLP0 | insertion | In_Frame_Ins | novel | c.211_212insCTC | p.Asn71delinsThrHis | p.N71delinsTH | P05388 | protein_coding | | | TCGA-BH-A0AW-01 | Breast | breast invasive carcinoma | Female | <65 | I/II | Chemotherapy | carboplatin | SD |
| RPLP0 | insertion | Frame_Shift_Ins | novel | c.210_211insCATTTTTCGTTCATGGA | p.Asn71HisfsTer77 | p.N71Hfs*77 | P05388 | protein_coding | | | TCGA-BH-A0AW-01 | Breast | breast invasive carcinoma | Female | <65 | I/II | Chemotherapy | carboplatin | SD |
| RPLP0 | SNV | Missense_Mutation | rs563131457 | c.662A>G | p.Asn221Ser | p.N221S | P05388 | protein_coding | tolerated(0.08) | benign(0.022) | TCGA-EK-A2R9-01 | Cervix | cervical & endocervical cancer | Female | <65 | I/II | Unknown | Unknown | SD |
| RPLP0 | SNV | Missense_Mutation | novel | c.818N>G | p.Ser273Cys | p.S273C | P05388 | protein_coding | deleterious(0) | possibly_damaging(0.56) | TCGA-VS-A958-01 | Cervix | cervical & endocervical cancer | Female | <65 | I/II | Chemotherapy | cisplatin | CR |
| RPLP0 | SNV | Missense_Mutation | novel | c.511G>A | p.Glu171Lys | p.E171K | P05388 | protein_coding | deleterious(0.03) | benign(0.048) | TCGA-AA-3514-01 | Colorectum | colon adenocarcinoma | Female | >=65 | I/II | Unknown | Unknown | SD |
| RPLP0 | SNV | Missense_Mutation | novel | c.518N>T | p.Thr173Met | p.T173M | P05388 | protein_coding | deleterious(0.02) | benign(0.186) | TCGA-A5-A0G1-01 | Endometrium | uterine corpus endometrioid carcinoma | Female | >=65 | I/II | Unknown | Unknown | SD |
| RPLP0 | SNV | Missense_Mutation | | c.409N>C | p.Phe137Leu | p.F137L | P05388 | protein_coding | deleterious(0.01) | benign(0.196) | TCGA-A5-A0GA-01 | Endometrium | uterine corpus endometrioid carcinoma | Female | >=65 | III/IV | Chemotherapy | taxol | PD |
| RPLP0 | SNV | Missense_Mutation | rs766132340 | c.86N>C | p.Ile29Thr | p.I29T | P05388 | protein_coding | deleterious(0.01) | possibly_damaging(0.457) | TCGA-A5-A0R7-01 | Endometrium | uterine corpus endometrioid carcinoma | Female | <65 | I/II | Unknown | Unknown | SD |
| RPLP0 | SNV | Missense_Mutation | | c.25T>C | p.Trp9Arg | p.W9R | P05388 | protein_coding | tolerated(0.41) | benign(0.02) | TCGA-A5-A0VP-01 | Endometrium | uterine corpus endometrioid carcinoma | Female | >=65 | I/II | Unknown | Unknown | SD |


