
|
|||||
|
 | |
| |
| |
| |
| |
| |
|
Gene: RPL39L |
Gene summary for RPL39L |
| Gene information | Species | Human | Gene symbol | RPL39L | Gene ID | 116832 |
| Gene name | ribosomal protein L39 like | |
| Gene Alias | L39-2 | |
| Cytomap | 3q27.3 | |
| Gene Type | protein-coding | GO ID | GO:0000003 | UniProtAcc | Q96EH5 |
Top |
Malignant transformation analysis |
| Identification of the aberrant gene expression in precancerous and cancerous lesions by comparing the gene expression of stem-like cells in diseased tissues with normal stem cells |
| Entrez ID | Symbol | Replicates | Species | Organ | Tissue | Adj P-value | Log2FC | Malignancy |
| 116832 | RPL39L | GSM4909281 | Human | Breast | IDC | 2.28e-22 | 6.58e-01 | 0.21 |
| 116832 | RPL39L | GSM4909282 | Human | Breast | IDC | 1.15e-81 | 1.21e+00 | -0.0288 |
| 116832 | RPL39L | GSM4909285 | Human | Breast | IDC | 1.18e-35 | 6.57e-01 | 0.21 |
| 116832 | RPL39L | GSM4909286 | Human | Breast | IDC | 1.52e-10 | 2.88e-01 | 0.1081 |
| 116832 | RPL39L | GSM4909290 | Human | Breast | IDC | 1.09e-03 | 3.30e-01 | 0.2096 |
| 116832 | RPL39L | GSM4909293 | Human | Breast | IDC | 1.45e-06 | 3.22e-01 | 0.1581 |
| 116832 | RPL39L | GSM4909294 | Human | Breast | IDC | 8.87e-05 | -1.23e-01 | 0.2022 |
| 116832 | RPL39L | GSM4909295 | Human | Breast | IDC | 2.32e-04 | 4.08e-01 | 0.0898 |
| 116832 | RPL39L | GSM4909311 | Human | Breast | IDC | 1.87e-06 | -6.89e-02 | 0.1534 |
| 116832 | RPL39L | GSM4909319 | Human | Breast | IDC | 1.32e-09 | 2.92e-02 | 0.1563 |
| 116832 | RPL39L | DCIS2 | Human | Breast | DCIS | 1.01e-19 | -1.32e-02 | 0.0085 |
| 116832 | RPL39L | LZE2T | Human | Esophagus | ESCC | 1.68e-07 | 1.13e+00 | 0.082 |
| 116832 | RPL39L | LZE4T | Human | Esophagus | ESCC | 9.28e-08 | 2.36e-01 | 0.0811 |
| 116832 | RPL39L | LZE7T | Human | Esophagus | ESCC | 5.74e-08 | 4.72e-01 | 0.0667 |
| 116832 | RPL39L | LZE8T | Human | Esophagus | ESCC | 1.43e-05 | 4.26e-01 | 0.067 |
| 116832 | RPL39L | LZE22T | Human | Esophagus | ESCC | 4.81e-07 | 7.14e-01 | 0.068 |
| 116832 | RPL39L | LZE24T | Human | Esophagus | ESCC | 1.22e-14 | 6.31e-01 | 0.0596 |
| 116832 | RPL39L | LZE6T | Human | Esophagus | ESCC | 3.94e-18 | 1.07e+00 | 0.0845 |
| 116832 | RPL39L | P1T-E | Human | Esophagus | ESCC | 1.32e-08 | 6.20e-01 | 0.0875 |
| 116832 | RPL39L | P2T-E | Human | Esophagus | ESCC | 1.31e-102 | 2.22e+00 | 0.1177 |
| Page: 1 2 3 4 5 |
| Tissue | Expression Dynamics | Abbreviation |
| Breast | 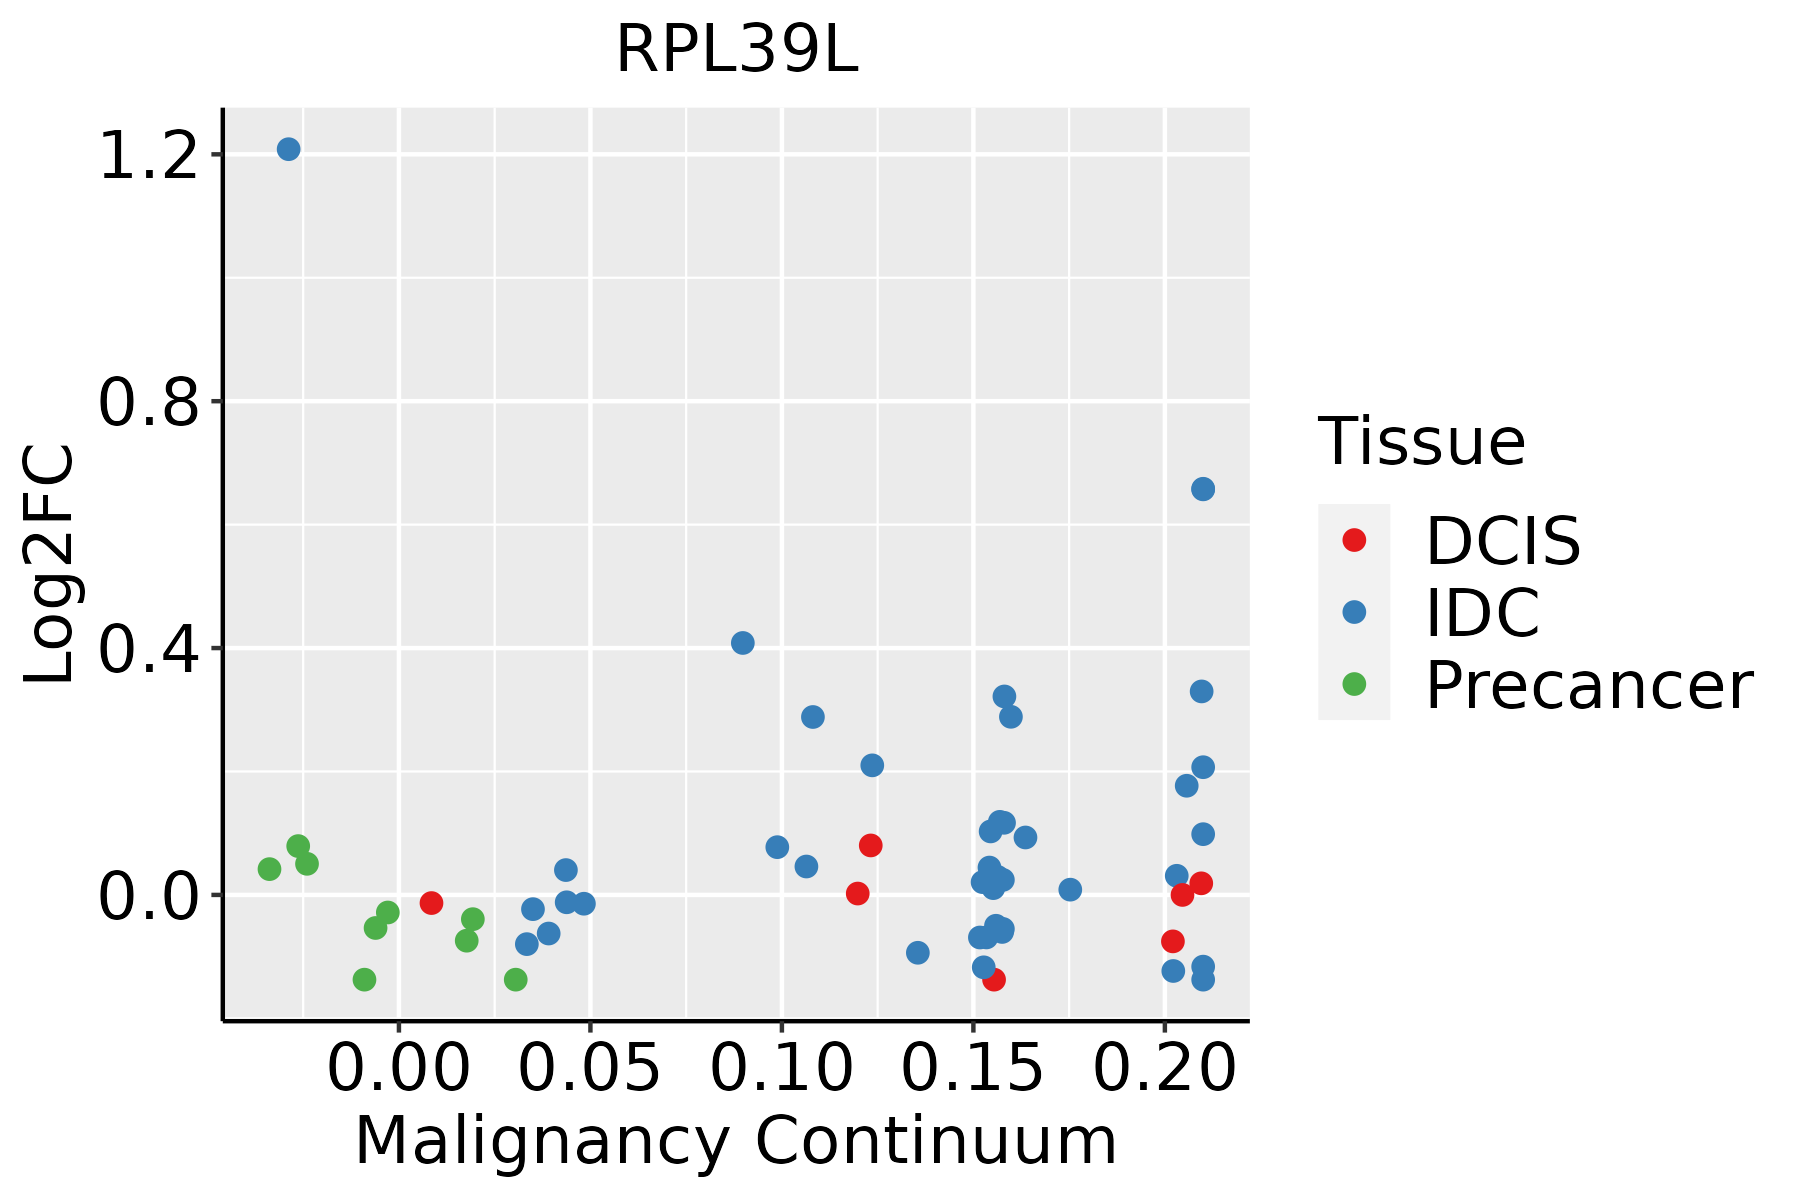 | IDC: Invasive ductal carcinoma |
| DCIS: Ductal carcinoma in situ | ||
| Precancer(BRCA1-mut): Precancerous lesion from BRCA1 mutation carriers | ||
| Esophagus |  | ESCC: Esophageal squamous cell carcinoma |
| HGIN: High-grade intraepithelial neoplasias | ||
| LGIN: Low-grade intraepithelial neoplasias | ||
| Oral Cavity | 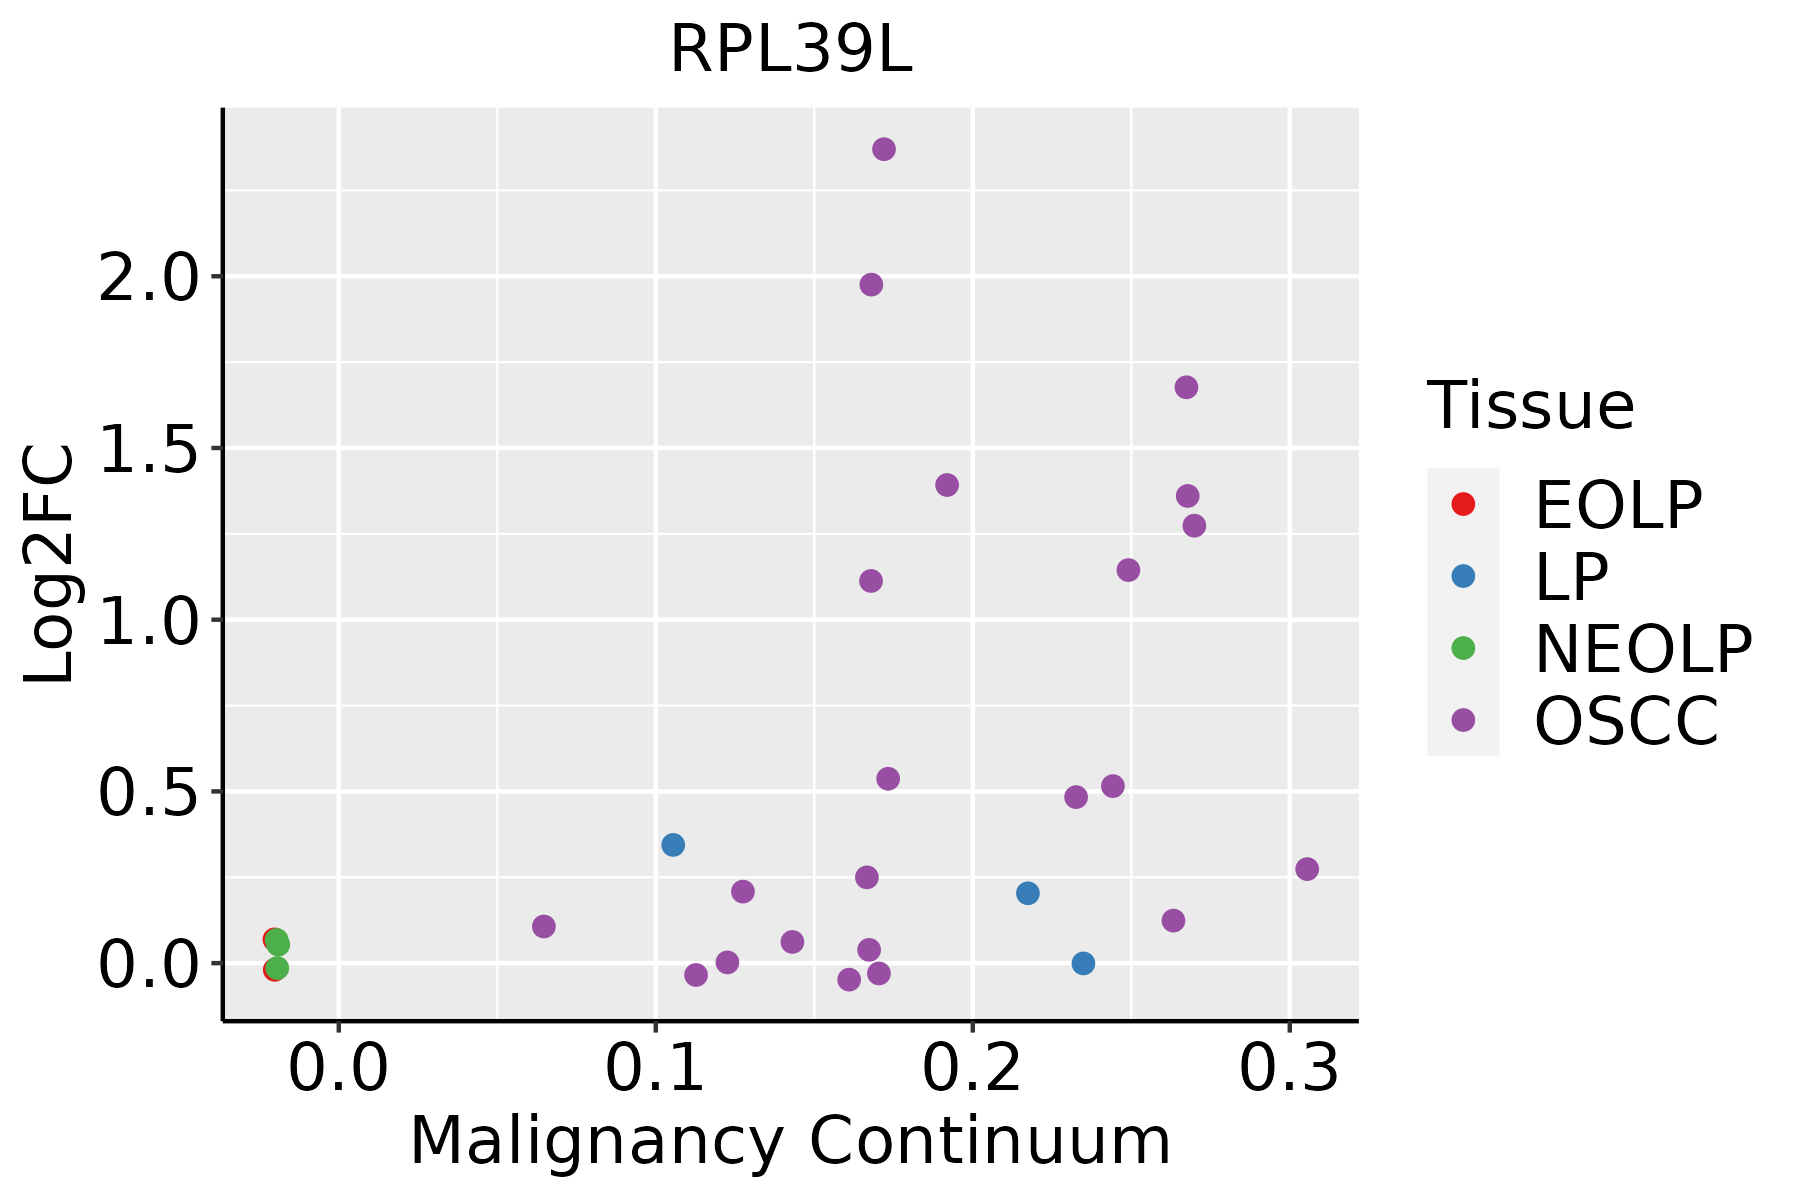 | EOLP: Erosive Oral lichen planus |
| LP: leukoplakia | ||
| NEOLP: Non-erosive oral lichen planus | ||
| OSCC: Oral squamous cell carcinoma | ||
| Skin | 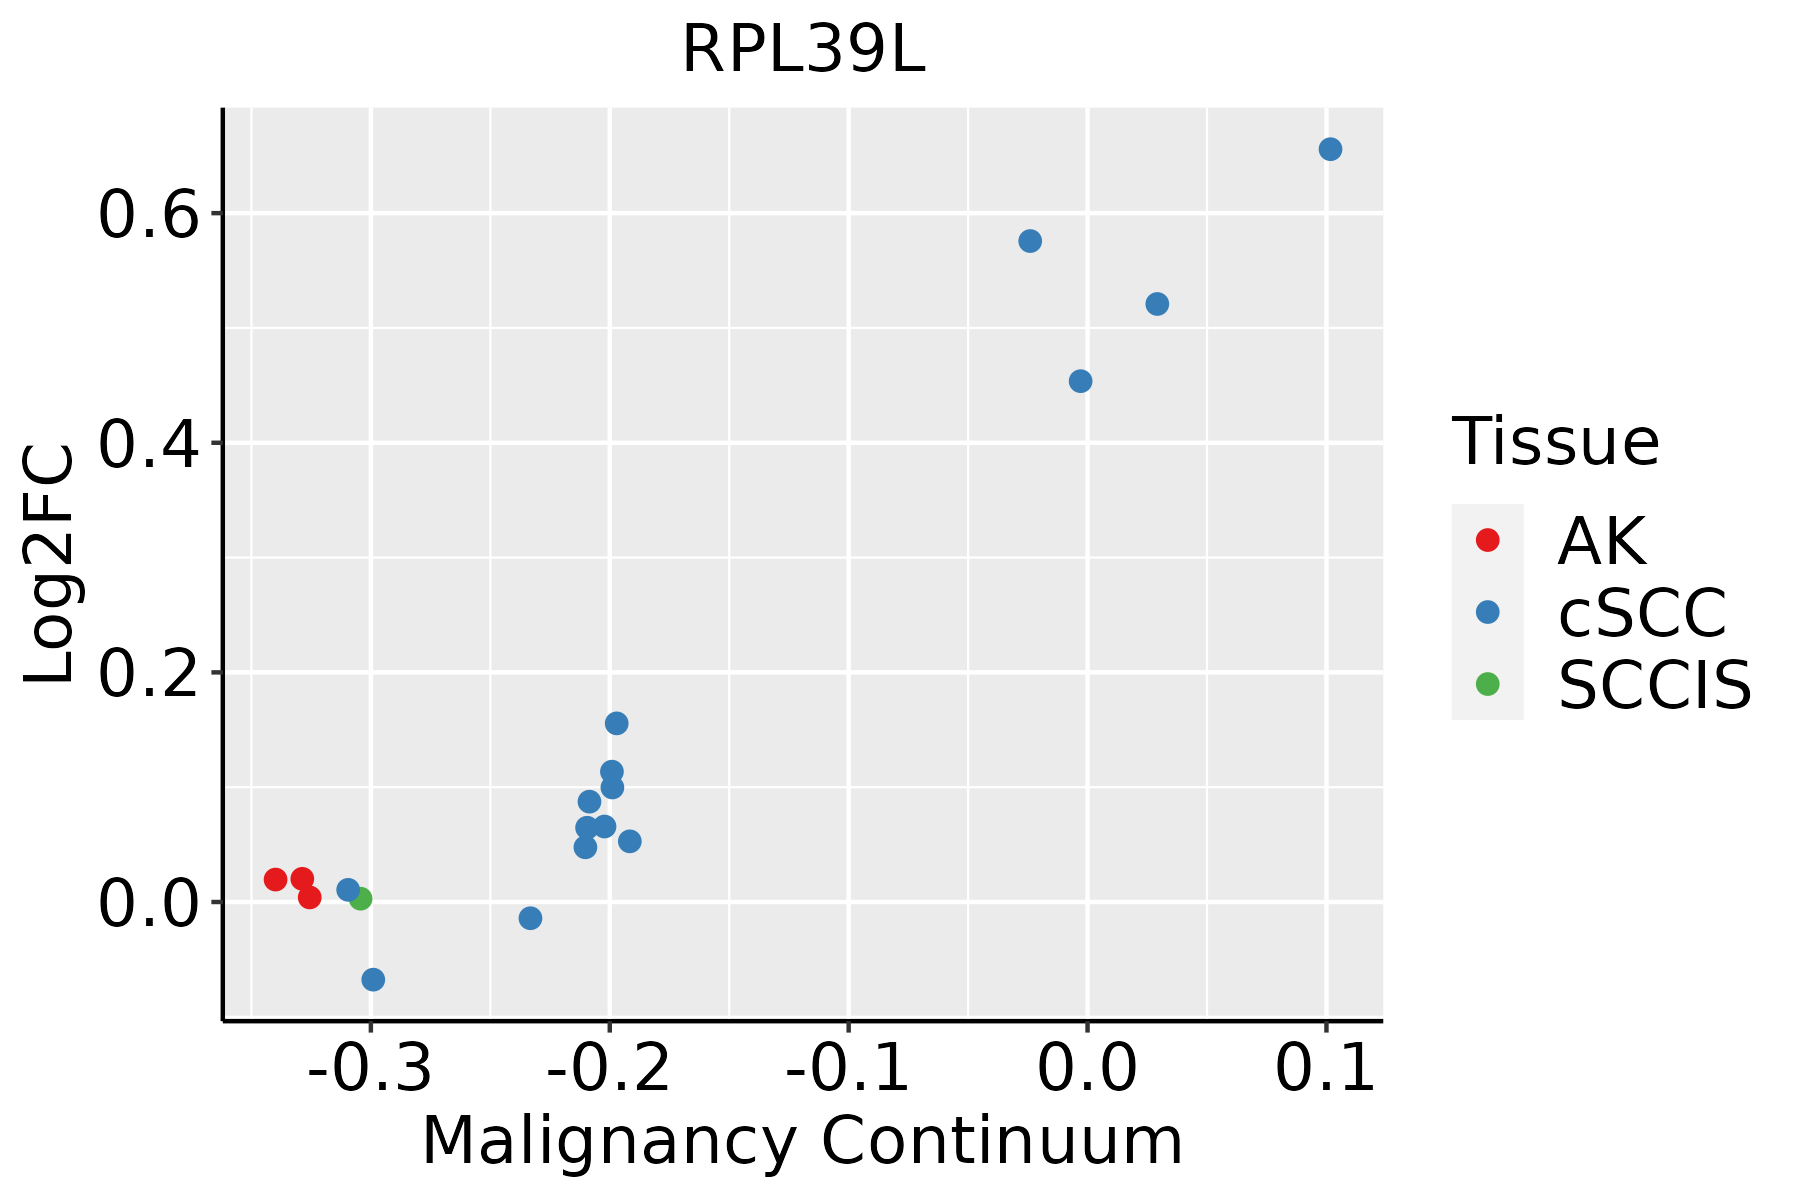 | AK: Actinic keratosis |
| cSCC: Cutaneous squamous cell carcinoma | ||
| SCCIS:squamous cell carcinoma in situ | ||
| Thyroid | 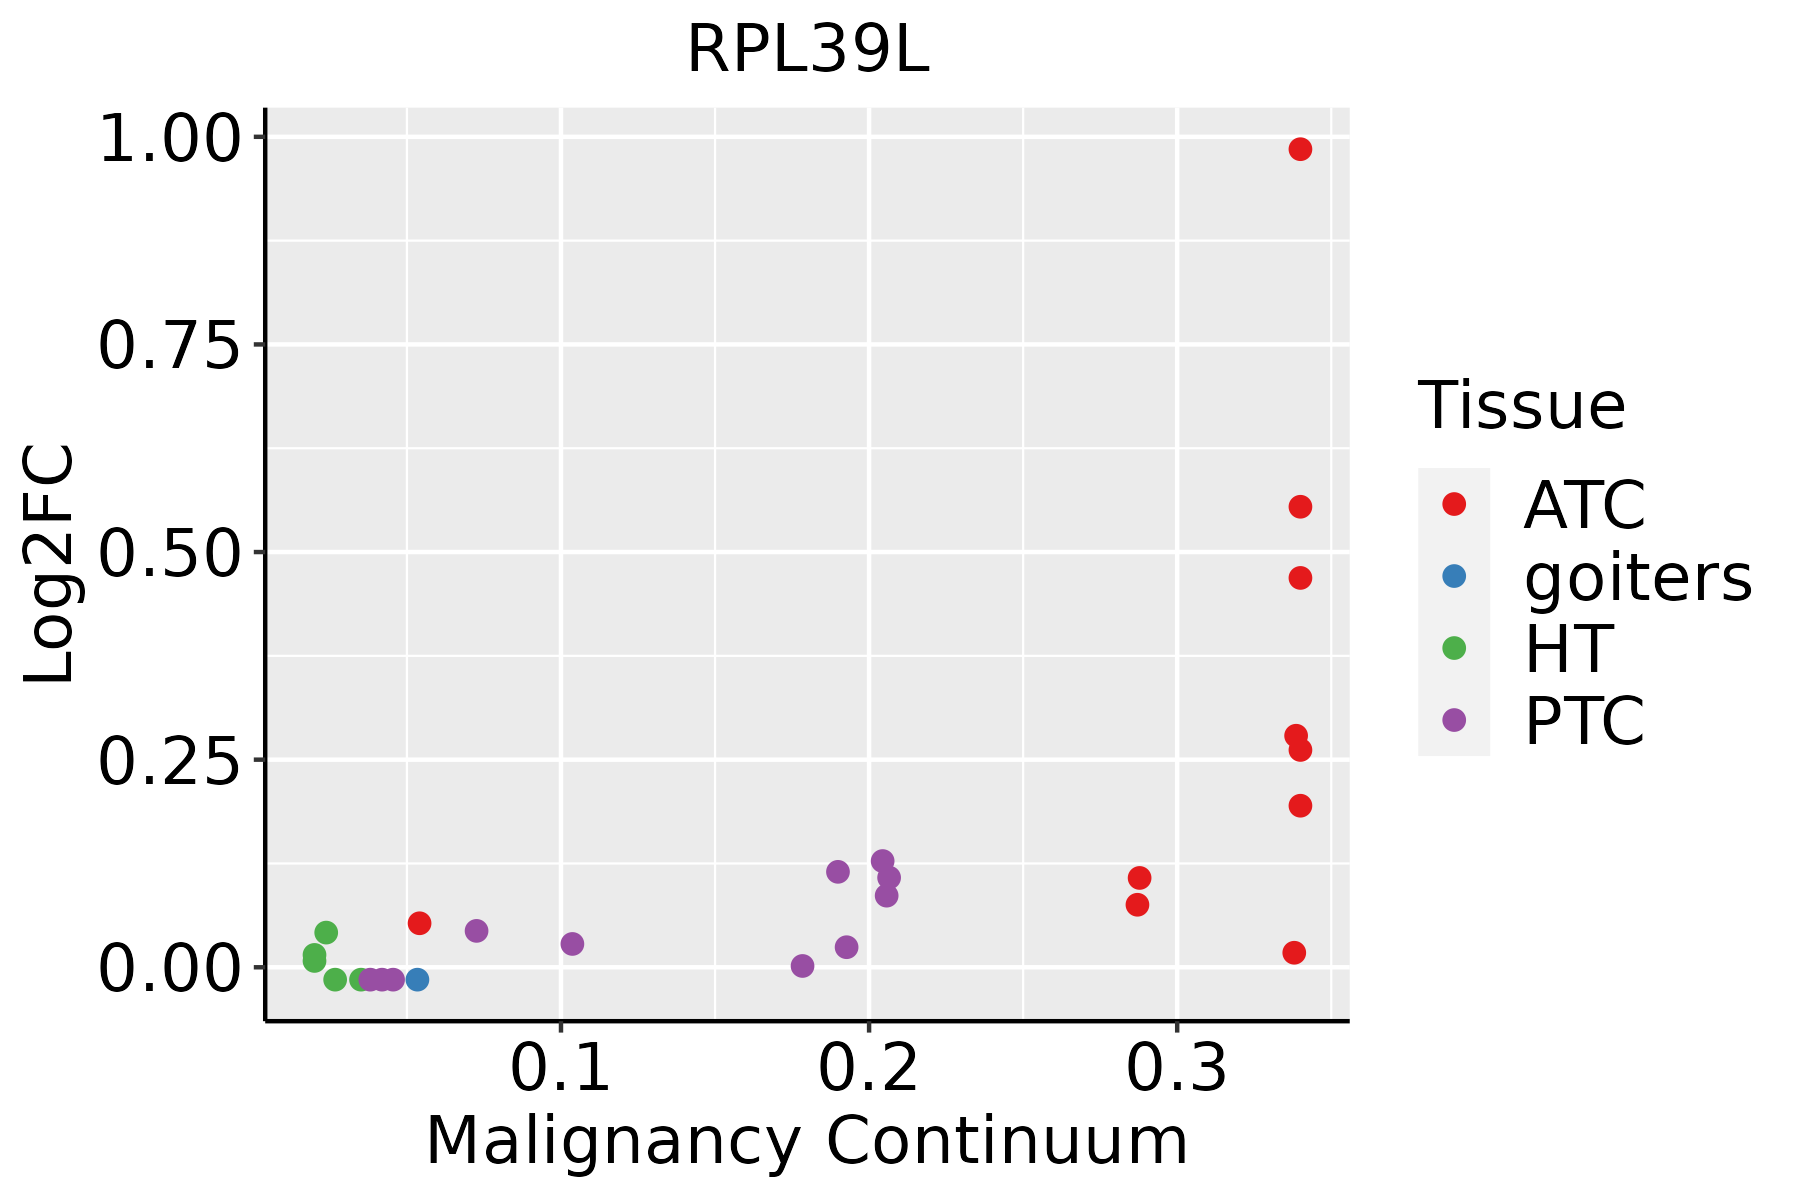 | ATC: Anaplastic thyroid cancer |
| HT: Hashimoto's thyroiditis | ||
| PTC: Papillary thyroid cancer |
| ∗log2FC in expression of this searched gene in stem-like cells from each diseased tissue sample relative to stem-like cells in normal samples in each tissue plotted against the malignancy continuum. Samples are colored based on if they are from different disease stage. |
Top |
Malignant transformation related pathway analysis |
| Find out the enriched GO biological processes and KEGG pathways involved in transition from healthy to precancer to cancer |
| Tissue | Disease Stage | Enriched GO biological Processes |
| Colorectum | AD |  |
| Colorectum | SER |  |
| Colorectum | MSS |  |
| Colorectum | MSI-H |  |
| Colorectum | FAP |  |
| ∗Top 15 enriched GO BP terms are showed in the bar plot of each disease state in each tissue. Each row represents a significant GO biological process which is colored according to the -log10(p.adjust). |
| Page: 1 2 3 4 5 6 7 8 9 |
| GO ID | Tissue | Disease Stage | Description | Gene Ratio | Bg Ratio | pvalue | p.adjust | Count |
| Page: 1 |
| Pathway ID | Tissue | Disease Stage | Description | Gene Ratio | Bg Ratio | pvalue | p.adjust | qvalue | Count |
| Page: 1 |
Top |
Cell-cell communication analysis |
| Identification of potential cell-cell interactions between two cell types and their ligand-receptor pairs for different disease states |
| Ligand | Receptor | LRpair | Pathway | Tissue | Disease Stage |
| Page: 1 |
Top |
Single-cell gene regulatory network inference analysis |
| Find out the significant the regulons (TFs) and the target genes of each regulon across cell types for different disease states |
| TF | Cell Type | Tissue | Disease Stage | Target Gene | RSS | Regulon Activity |
| ∗The dot plots of a searched regulon are shown for all cell subpopulations in each disease state of each tissue based on the regulon specific score inferred using pySCENIC and by calculating the average expression. |
| Page: 1 |
Top |
Somatic mutation of malignant transformation related genes |
| Annotation of somatic variants for genes involved in malignant transformation |
| Hugo Symbol | Variant Class | Variant Classification | dbSNP RS | HGVSc | HGVSp | HGVSp Short | SWISSPROT | BIOTYPE | SIFT | PolyPhen | Tumor Sample Barcode | Tissue | Histology | Sex | Age | Stage | Therapy Types | Drugs | Outcome |
| RPL39L | SNV | Missense_Mutation | c.151N>G | p.Leu51Val | p.L51V | Q96EH5 | protein_coding | deleterious(0.03) | probably_damaging(0.999) | TCGA-AC-A23H-01 | Breast | breast invasive carcinoma | Female | >=65 | I/II | Unknown | Unknown | PD | |
| RPL39L | SNV | Missense_Mutation | c.148G>T | p.Gly50Cys | p.G50C | Q96EH5 | protein_coding | deleterious(0.01) | benign(0.274) | TCGA-A6-6653-01 | Colorectum | colon adenocarcinoma | Male | >=65 | I/II | Unknown | Unknown | SD | |
| RPL39L | SNV | Missense_Mutation | rs547833786 | c.61C>T | p.Arg21Cys | p.R21C | Q96EH5 | protein_coding | tolerated(0.23) | benign(0.001) | TCGA-AP-A056-01 | Endometrium | uterine corpus endometrioid carcinoma | Female | <65 | I/II | Unknown | Unknown | SD |
| RPL39L | SNV | Missense_Mutation | c.98N>A | p.Ser33Asn | p.S33N | Q96EH5 | protein_coding | tolerated(1) | benign(0) | TCGA-AP-A059-01 | Endometrium | uterine corpus endometrioid carcinoma | Female | >=65 | I/II | Unknown | Unknown | SD | |
| RPL39L | SNV | Missense_Mutation | novel | c.46N>G | p.Lys16Glu | p.K16E | Q96EH5 | protein_coding | deleterious(0.02) | possibly_damaging(0.865) | TCGA-B5-A3FA-01 | Endometrium | uterine corpus endometrioid carcinoma | Female | >=65 | I/II | Unknown | Unknown | SD |
| RPL39L | SNV | Missense_Mutation | novel | c.25A>T | p.Ile9Phe | p.I9F | Q96EH5 | protein_coding | deleterious(0.02) | benign(0.202) | TCGA-CN-A63T-01 | Oral cavity | head & neck squamous cell carcinoma | Male | <65 | I/II | Chemotherapy | cisplatin | CR |
| RPL39L | SNV | Missense_Mutation | rs769500230 | c.92C>T | p.Pro31Leu | p.P31L | Q96EH5 | protein_coding | deleterious(0.02) | benign(0.01) | TCGA-CV-A468-01 | Oral cavity | head & neck squamous cell carcinoma | Male | <65 | I/II | Unknown | Unknown | SD |
| RPL39L | SNV | Missense_Mutation | novel | c.91C>T | p.Pro31Ser | p.P31S | Q96EH5 | protein_coding | tolerated(0.05) | benign(0.03) | TCGA-CV-A468-01 | Oral cavity | head & neck squamous cell carcinoma | Male | <65 | I/II | Unknown | Unknown | SD |
| RPL39L | SNV | Missense_Mutation | c.14A>T | p.Lys5Met | p.K5M | Q96EH5 | protein_coding | deleterious(0) | benign(0.159) | TCGA-BR-8589-01 | Stomach | stomach adenocarcinoma | Male | <65 | III/IV | Unknown | Unknown | SD |
| Page: 1 |
Top |
Related drugs of malignant transformation related genes |
| Identification of chemicals and drugs interact with genes involved in malignant transfromation |
| (DGIdb 4.0) |
| Entrez ID | Symbol | Category | Interaction Types | Drug Claim Name | Drug Name | PMIDs |
| Page: 1 |

Copyright 2023-Present -The University of Texas Health Science Center at Houston |