| Tissue | Expression Dynamics | Abbreviation |
| Esophagus |  | ESCC: Esophageal squamous cell carcinoma |
| HGIN: High-grade intraepithelial neoplasias |
| LGIN: Low-grade intraepithelial neoplasias |
| Liver | 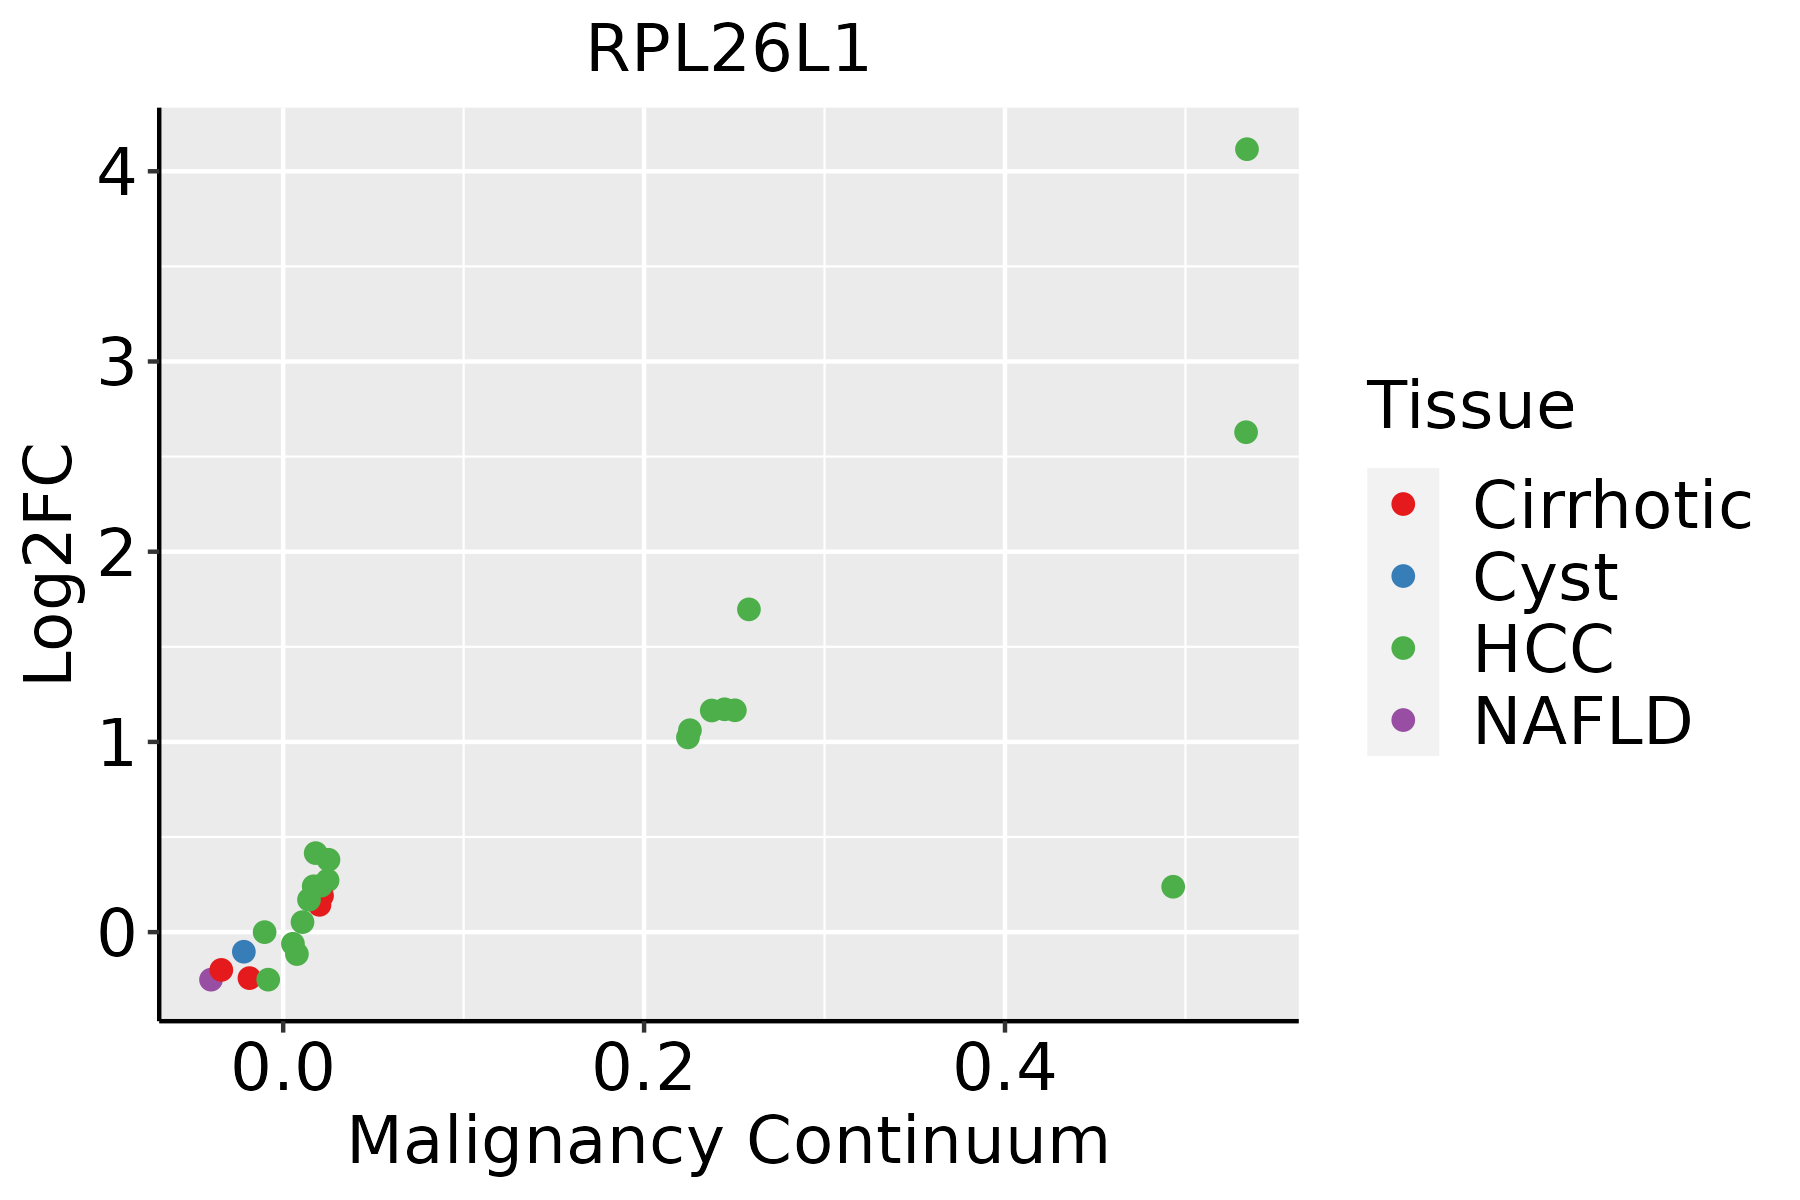 | HCC: Hepatocellular carcinoma |
| NAFLD: Non-alcoholic fatty liver disease |
| Oral Cavity | 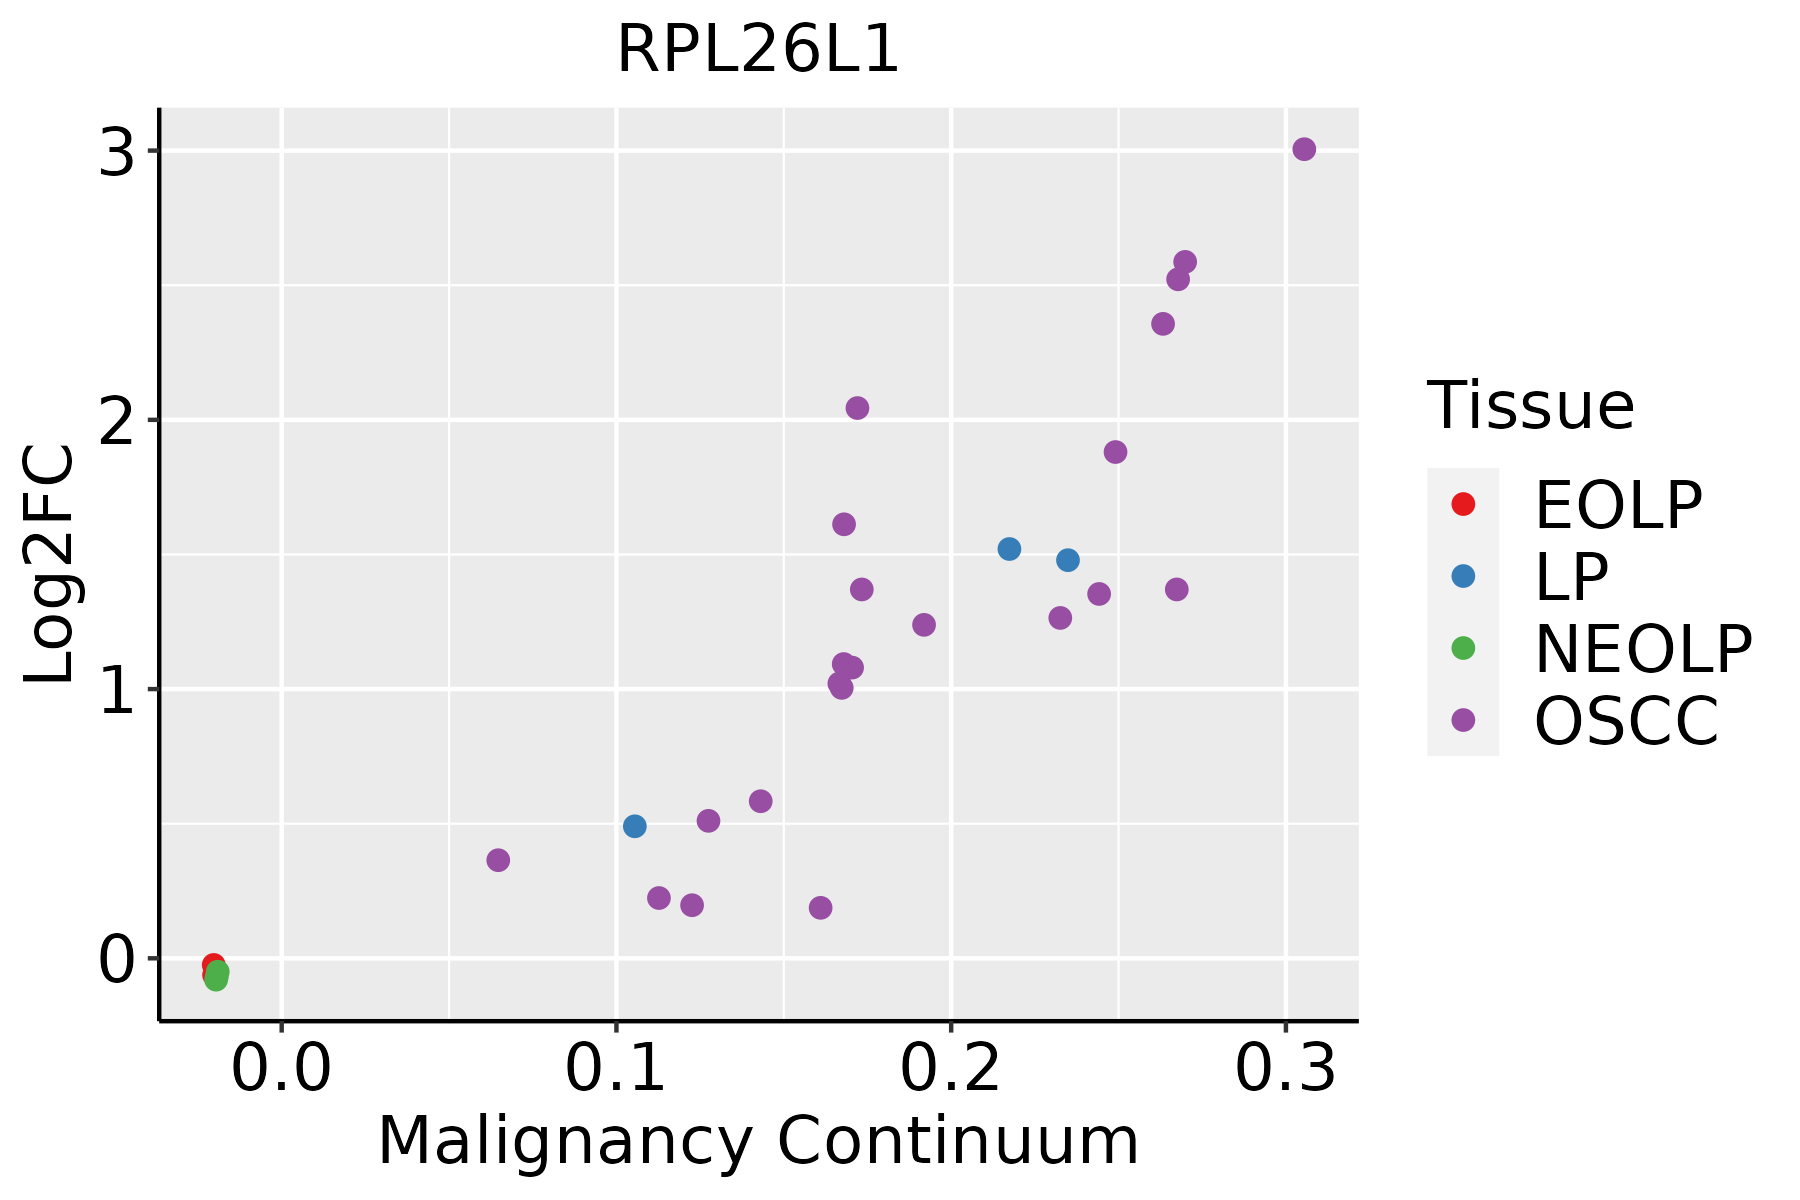 | EOLP: Erosive Oral lichen planus |
| LP: leukoplakia |
| NEOLP: Non-erosive oral lichen planus |
| OSCC: Oral squamous cell carcinoma |
| Skin | 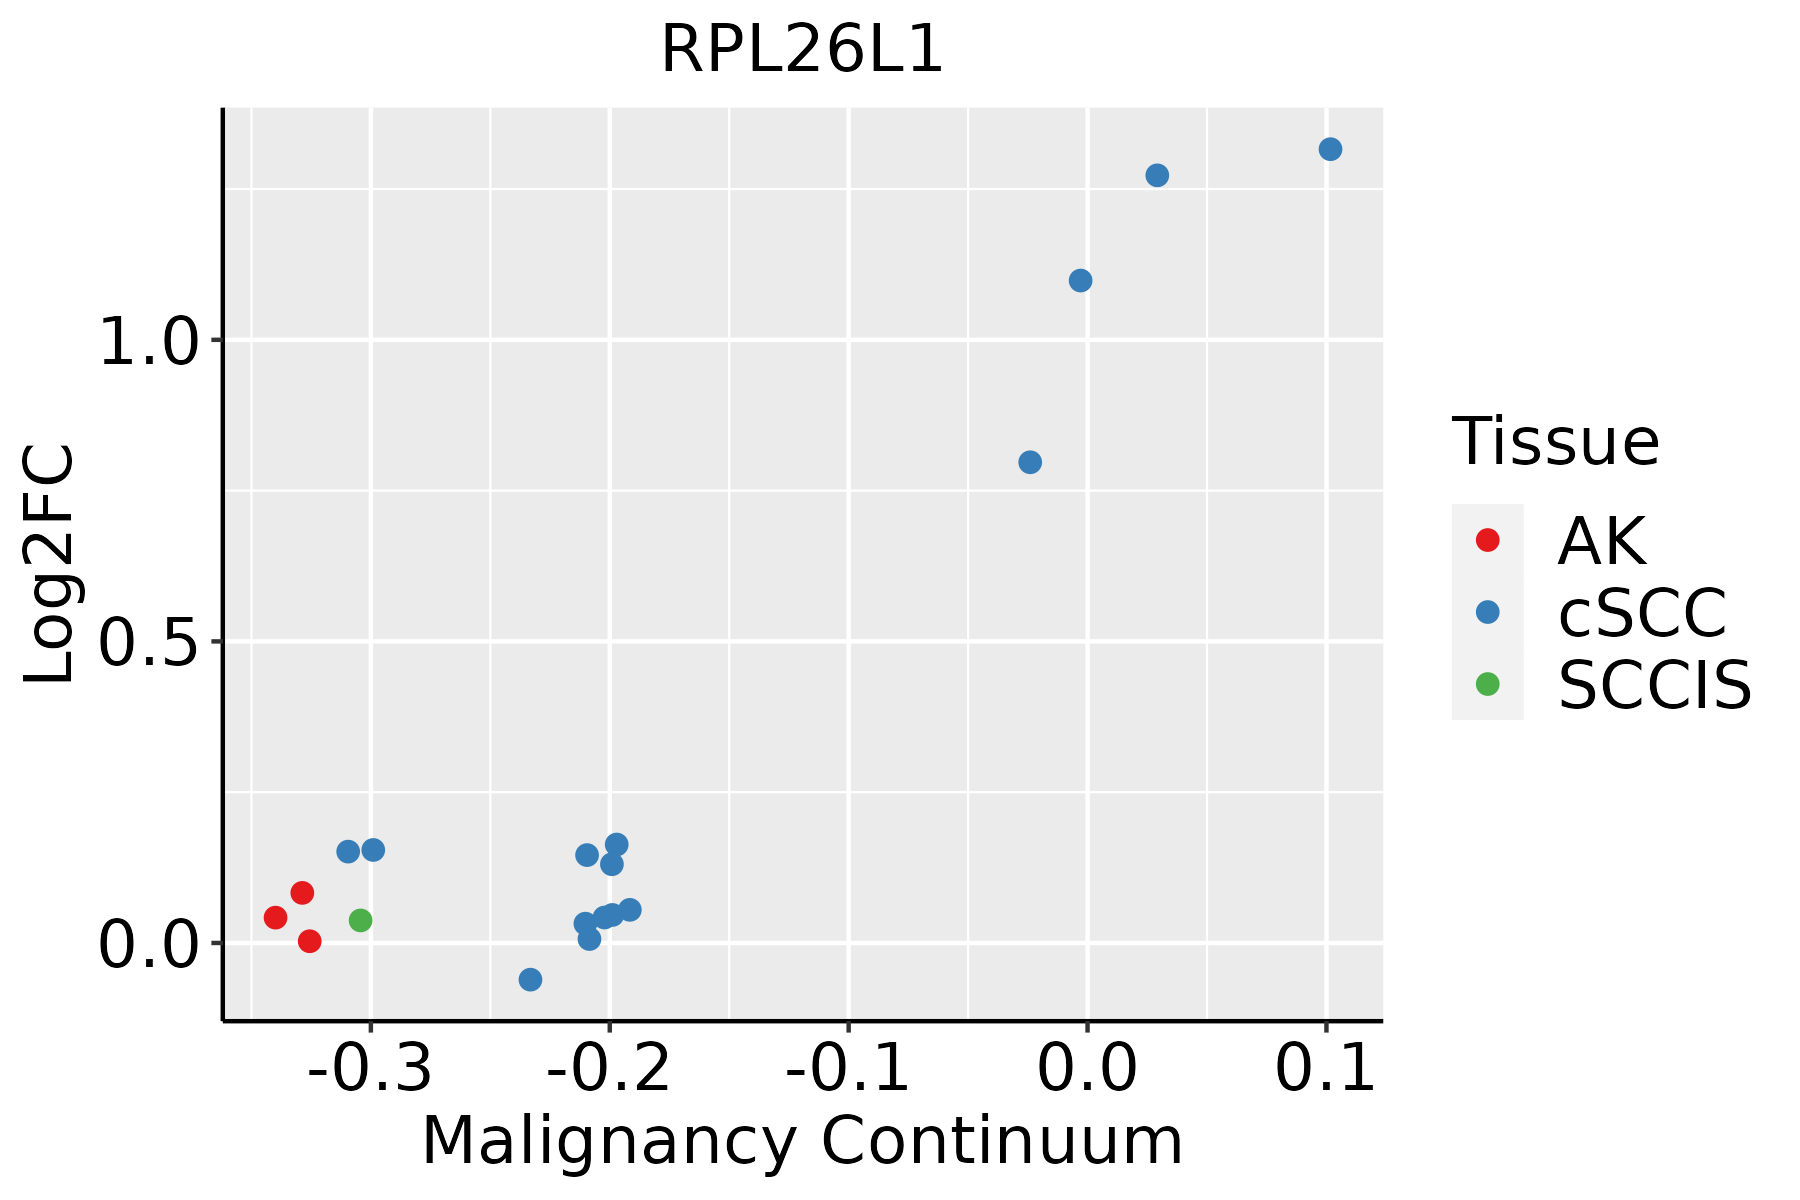 | AK: Actinic keratosis |
| cSCC: Cutaneous squamous cell carcinoma |
| SCCIS:squamous cell carcinoma in situ |
| Thyroid |  | ATC: Anaplastic thyroid cancer |
| HT: Hashimoto's thyroiditis |
| PTC: Papillary thyroid cancer |
| GO ID | Tissue | Disease Stage | Description | Gene Ratio | Bg Ratio | pvalue | p.adjust | Count |
| GO:0022613111 | Esophagus | ESCC | ribonucleoprotein complex biogenesis | 365/8552 | 463/18723 | 1.74e-49 | 1.11e-45 | 365 |
| GO:0042254111 | Esophagus | ESCC | ribosome biogenesis | 252/8552 | 299/18723 | 3.27e-44 | 1.04e-40 | 252 |
| GO:0002181111 | Esophagus | ESCC | cytoplasmic translation | 135/8552 | 148/18723 | 4.17e-32 | 2.65e-29 | 135 |
| GO:0042273111 | Esophagus | ESCC | ribosomal large subunit biogenesis | 65/8552 | 72/18723 | 1.53e-15 | 9.82e-14 | 65 |
| GO:000218112 | Liver | Cirrhotic | cytoplasmic translation | 120/4634 | 148/18723 | 2.95e-47 | 1.85e-43 | 120 |
| GO:002261312 | Liver | Cirrhotic | ribonucleoprotein complex biogenesis | 231/4634 | 463/18723 | 3.28e-32 | 6.86e-29 | 231 |
| GO:004225412 | Liver | Cirrhotic | ribosome biogenesis | 154/4634 | 299/18723 | 1.18e-23 | 6.72e-21 | 154 |
| GO:004227312 | Liver | Cirrhotic | ribosomal large subunit biogenesis | 47/4634 | 72/18723 | 4.20e-13 | 3.29e-11 | 47 |
| GO:002261322 | Liver | HCC | ribonucleoprotein complex biogenesis | 355/7958 | 463/18723 | 7.76e-52 | 4.92e-48 | 355 |
| GO:004225422 | Liver | HCC | ribosome biogenesis | 246/7958 | 299/18723 | 4.99e-46 | 1.58e-42 | 246 |
| GO:000218122 | Liver | HCC | cytoplasmic translation | 132/7958 | 148/18723 | 9.09e-33 | 5.76e-30 | 132 |
| GO:004227322 | Liver | HCC | ribosomal large subunit biogenesis | 64/7958 | 72/18723 | 2.31e-16 | 2.03e-14 | 64 |
| GO:002261320 | Oral cavity | OSCC | ribonucleoprotein complex biogenesis | 333/7305 | 463/18723 | 8.28e-48 | 5.24e-44 | 333 |
| GO:004225420 | Oral cavity | OSCC | ribosome biogenesis | 230/7305 | 299/18723 | 3.22e-41 | 6.80e-38 | 230 |
| GO:000218120 | Oral cavity | OSCC | cytoplasmic translation | 133/7305 | 148/18723 | 1.94e-38 | 2.46e-35 | 133 |
| GO:004227320 | Oral cavity | OSCC | ribosomal large subunit biogenesis | 61/7305 | 72/18723 | 1.52e-15 | 1.06e-13 | 61 |
| GO:0002181110 | Oral cavity | LP | cytoplasmic translation | 124/4623 | 148/18723 | 5.09e-52 | 3.19e-48 | 124 |
| GO:0022613110 | Oral cavity | LP | ribonucleoprotein complex biogenesis | 259/4623 | 463/18723 | 7.20e-48 | 2.25e-44 | 259 |
| GO:0042254110 | Oral cavity | LP | ribosome biogenesis | 173/4623 | 299/18723 | 8.97e-35 | 1.41e-31 | 173 |
| GO:0042273110 | Oral cavity | LP | ribosomal large subunit biogenesis | 53/4623 | 72/18723 | 3.25e-18 | 5.82e-16 | 53 |
| Pathway ID | Tissue | Disease Stage | Description | Gene Ratio | Bg Ratio | pvalue | p.adjust | qvalue | Count |
| hsa03010211 | Esophagus | ESCC | Ribosome | 129/4205 | 167/8465 | 1.43e-13 | 3.43e-12 | 1.75e-12 | 129 |
| hsa05171211 | Esophagus | ESCC | Coronavirus disease - COVID-19 | 156/4205 | 232/8465 | 3.18e-08 | 2.68e-07 | 1.37e-07 | 156 |
| hsa03010310 | Esophagus | ESCC | Ribosome | 129/4205 | 167/8465 | 1.43e-13 | 3.43e-12 | 1.75e-12 | 129 |
| hsa05171310 | Esophagus | ESCC | Coronavirus disease - COVID-19 | 156/4205 | 232/8465 | 3.18e-08 | 2.68e-07 | 1.37e-07 | 156 |
| hsa0301022 | Liver | Cirrhotic | Ribosome | 127/2530 | 167/8465 | 2.12e-35 | 7.06e-33 | 4.35e-33 | 127 |
| hsa0517122 | Liver | Cirrhotic | Coronavirus disease - COVID-19 | 136/2530 | 232/8465 | 3.28e-20 | 1.82e-18 | 1.12e-18 | 136 |
| hsa0301032 | Liver | Cirrhotic | Ribosome | 127/2530 | 167/8465 | 2.12e-35 | 7.06e-33 | 4.35e-33 | 127 |
| hsa0517132 | Liver | Cirrhotic | Coronavirus disease - COVID-19 | 136/2530 | 232/8465 | 3.28e-20 | 1.82e-18 | 1.12e-18 | 136 |
| hsa0301042 | Liver | HCC | Ribosome | 128/4020 | 167/8465 | 7.32e-15 | 2.23e-13 | 1.24e-13 | 128 |
| hsa0517142 | Liver | HCC | Coronavirus disease - COVID-19 | 167/4020 | 232/8465 | 1.50e-14 | 4.19e-13 | 2.33e-13 | 167 |
| hsa0301052 | Liver | HCC | Ribosome | 128/4020 | 167/8465 | 7.32e-15 | 2.23e-13 | 1.24e-13 | 128 |
| hsa0517152 | Liver | HCC | Coronavirus disease - COVID-19 | 167/4020 | 232/8465 | 1.50e-14 | 4.19e-13 | 2.33e-13 | 167 |
| hsa0301030 | Oral cavity | OSCC | Ribosome | 128/3704 | 167/8465 | 2.42e-18 | 1.62e-16 | 8.25e-17 | 128 |
| hsa0517130 | Oral cavity | OSCC | Coronavirus disease - COVID-19 | 156/3704 | 232/8465 | 2.30e-13 | 5.14e-12 | 2.62e-12 | 156 |
| hsa03010114 | Oral cavity | OSCC | Ribosome | 128/3704 | 167/8465 | 2.42e-18 | 1.62e-16 | 8.25e-17 | 128 |
| hsa05171114 | Oral cavity | OSCC | Coronavirus disease - COVID-19 | 156/3704 | 232/8465 | 2.30e-13 | 5.14e-12 | 2.62e-12 | 156 |
| hsa03010210 | Oral cavity | LP | Ribosome | 127/2418 | 167/8465 | 1.22e-37 | 4.05e-35 | 2.61e-35 | 127 |
| hsa05171210 | Oral cavity | LP | Coronavirus disease - COVID-19 | 128/2418 | 232/8465 | 7.04e-18 | 2.34e-16 | 1.51e-16 | 128 |
| hsa0301038 | Oral cavity | LP | Ribosome | 127/2418 | 167/8465 | 1.22e-37 | 4.05e-35 | 2.61e-35 | 127 |
| hsa0517138 | Oral cavity | LP | Coronavirus disease - COVID-19 | 128/2418 | 232/8465 | 7.04e-18 | 2.34e-16 | 1.51e-16 | 128 |
| Hugo Symbol | Variant Class | Variant Classification | dbSNP RS | HGVSc | HGVSp | HGVSp Short | SWISSPROT | BIOTYPE | SIFT | PolyPhen | Tumor Sample Barcode | Tissue | Histology | Sex | Age | Stage | Therapy Types | Drugs | Outcome |
| RPL26L1 | SNV | Missense_Mutation | | c.228N>T | p.Lys76Asn | p.K76N | Q9UNX3 | protein_coding | deleterious(0.01) | probably_damaging(0.98) | TCGA-F5-6814-01 | Colorectum | rectum adenocarcinoma | Male | <65 | I/II | Unknown | Unknown | SD |
| RPL26L1 | SNV | Missense_Mutation | | c.228N>T | p.Lys76Asn | p.K76N | Q9UNX3 | protein_coding | deleterious(0.01) | probably_damaging(0.98) | TCGA-AX-A0J0-01 | Endometrium | uterine corpus endometrioid carcinoma | Female | <65 | I/II | Unknown | Unknown | SD |
| RPL26L1 | SNV | Missense_Mutation | | c.260N>A | p.Arg87His | p.R87H | Q9UNX3 | protein_coding | tolerated(0.07) | benign(0.021) | TCGA-B5-A11E-01 | Endometrium | uterine corpus endometrioid carcinoma | Female | <65 | I/II | Unknown | Unknown | SD |
| RPL26L1 | SNV | Missense_Mutation | rs773507352 | c.250N>T | p.Arg84Trp | p.R84W | Q9UNX3 | protein_coding | tolerated(0.1) | benign(0.007) | TCGA-B5-A3FC-01 | Endometrium | uterine corpus endometrioid carcinoma | Female | <65 | I/II | Unknown | Unknown | SD |
| RPL26L1 | SNV | Missense_Mutation | novel | c.423N>T | p.Glu141Asp | p.E141D | Q9UNX3 | protein_coding | tolerated(0.1) | benign(0.005) | TCGA-B5-A3FC-01 | Endometrium | uterine corpus endometrioid carcinoma | Female | <65 | I/II | Unknown | Unknown | SD |
| RPL26L1 | SNV | Missense_Mutation | novel | c.258G>T | p.Gln86His | p.Q86H | Q9UNX3 | protein_coding | tolerated(0.06) | benign(0.019) | TCGA-BG-A222-01 | Endometrium | uterine corpus endometrioid carcinoma | Female | <65 | I/II | Unknown | Unknown | SD |
| RPL26L1 | SNV | Missense_Mutation | | c.247G>A | p.Glu83Lys | p.E83K | Q9UNX3 | protein_coding | tolerated(0.05) | possibly_damaging(0.793) | TCGA-BS-A0U8-01 | Endometrium | uterine corpus endometrioid carcinoma | Female | <65 | III/IV | Chemotherapy | doxorubicin | SD |
| RPL26L1 | SNV | Missense_Mutation | rs779289794 | c.355N>A | p.Leu119Ile | p.L119I | Q9UNX3 | protein_coding | tolerated(0.12) | benign(0.102) | TCGA-BS-A0UV-01 | Endometrium | uterine corpus endometrioid carcinoma | Female | <65 | III/IV | Unknown | Unknown | SD |
| RPL26L1 | SNV | Missense_Mutation | rs767751234 | c.176N>A | p.Arg59Gln | p.R59Q | Q9UNX3 | protein_coding | tolerated(0.09) | benign(0.116) | TCGA-E6-A1LX-01 | Endometrium | uterine corpus endometrioid carcinoma | Female | <65 | I/II | Unknown | Unknown | SD |
| RPL26L1 | SNV | Missense_Mutation | novel | c.351N>C | p.Lys117Asn | p.K117N | Q9UNX3 | protein_coding | tolerated(0.12) | benign(0.021) | TCGA-FI-A2D5-01 | Endometrium | uterine corpus endometrioid carcinoma | Female | <65 | III/IV | Chemotherapy | carboplatinum | PD |


