
|
|||||
|
 | |
| |
| |
| |
| |
| |
|
Gene: RPL22L1 |
Gene summary for RPL22L1 |
| Gene information | Species | Human | Gene symbol | RPL22L1 | Gene ID | 200916 |
| Gene name | ribosomal protein L22 like 1 | |
| Gene Alias | RPL22L1 | |
| Cytomap | 3q26.2 | |
| Gene Type | protein-coding | GO ID | GO:0002181 | UniProtAcc | Q6P5R6 |
Top |
Malignant transformation analysis |
| Identification of the aberrant gene expression in precancerous and cancerous lesions by comparing the gene expression of stem-like cells in diseased tissues with normal stem cells |
| Entrez ID | Symbol | Replicates | Species | Organ | Tissue | Adj P-value | Log2FC | Malignancy |
| 200916 | RPL22L1 | CA_HPV_1 | Human | Cervix | CC | 2.20e-05 | -1.73e-01 | 0.0264 |
| 200916 | RPL22L1 | N_HPV_2 | Human | Cervix | N_HPV | 2.55e-03 | 1.91e-01 | -0.0131 |
| 200916 | RPL22L1 | CCI_1 | Human | Cervix | CC | 1.14e-09 | -7.19e-01 | 0.528 |
| 200916 | RPL22L1 | CCI_2 | Human | Cervix | CC | 1.41e-02 | -5.52e-01 | 0.5249 |
| 200916 | RPL22L1 | CCI_3 | Human | Cervix | CC | 7.25e-12 | -6.92e-01 | 0.516 |
| 200916 | RPL22L1 | CCII_1 | Human | Cervix | CC | 7.91e-17 | -7.05e-01 | 0.3249 |
| 200916 | RPL22L1 | sample3 | Human | Cervix | CC | 1.43e-04 | -2.10e-01 | 0.1387 |
| 200916 | RPL22L1 | H2 | Human | Cervix | HSIL_HPV | 1.62e-10 | -4.71e-01 | 0.0632 |
| 200916 | RPL22L1 | L1 | Human | Cervix | CC | 2.68e-03 | -2.82e-01 | 0.0802 |
| 200916 | RPL22L1 | T3 | Human | Cervix | CC | 6.21e-03 | -2.08e-01 | 0.1389 |
| 200916 | RPL22L1 | HTA11_2951_2000001011 | Human | Colorectum | AD | 3.84e-03 | 4.97e-01 | 0.0216 |
| 200916 | RPL22L1 | HTA11_1391_2000001011 | Human | Colorectum | AD | 1.07e-05 | 3.52e-01 | -0.059 |
| 200916 | RPL22L1 | HTA11_866_3004761011 | Human | Colorectum | AD | 1.10e-09 | 4.08e-01 | 0.096 |
| 200916 | RPL22L1 | HTA11_8622_2000001021 | Human | Colorectum | SER | 4.35e-04 | 4.34e-01 | 0.0528 |
| 200916 | RPL22L1 | HTA11_7696_3000711011 | Human | Colorectum | AD | 1.40e-02 | 2.31e-01 | 0.0674 |
| 200916 | RPL22L1 | HTA11_6818_2000001021 | Human | Colorectum | AD | 8.25e-20 | 8.13e-01 | 0.0588 |
| 200916 | RPL22L1 | HTA11_99999970781_79442 | Human | Colorectum | MSS | 3.98e-40 | 9.01e-01 | 0.294 |
| 200916 | RPL22L1 | HTA11_99999965062_69753 | Human | Colorectum | MSI-H | 4.98e-22 | 2.50e+00 | 0.3487 |
| 200916 | RPL22L1 | HTA11_99999971662_82457 | Human | Colorectum | MSS | 6.15e-12 | 4.27e-01 | 0.3859 |
| 200916 | RPL22L1 | HTA11_99999974143_84620 | Human | Colorectum | MSS | 6.35e-18 | 5.59e-01 | 0.3005 |
| Page: 1 2 3 4 5 6 7 8 9 10 |
| Tissue | Expression Dynamics | Abbreviation |
| Cervix | 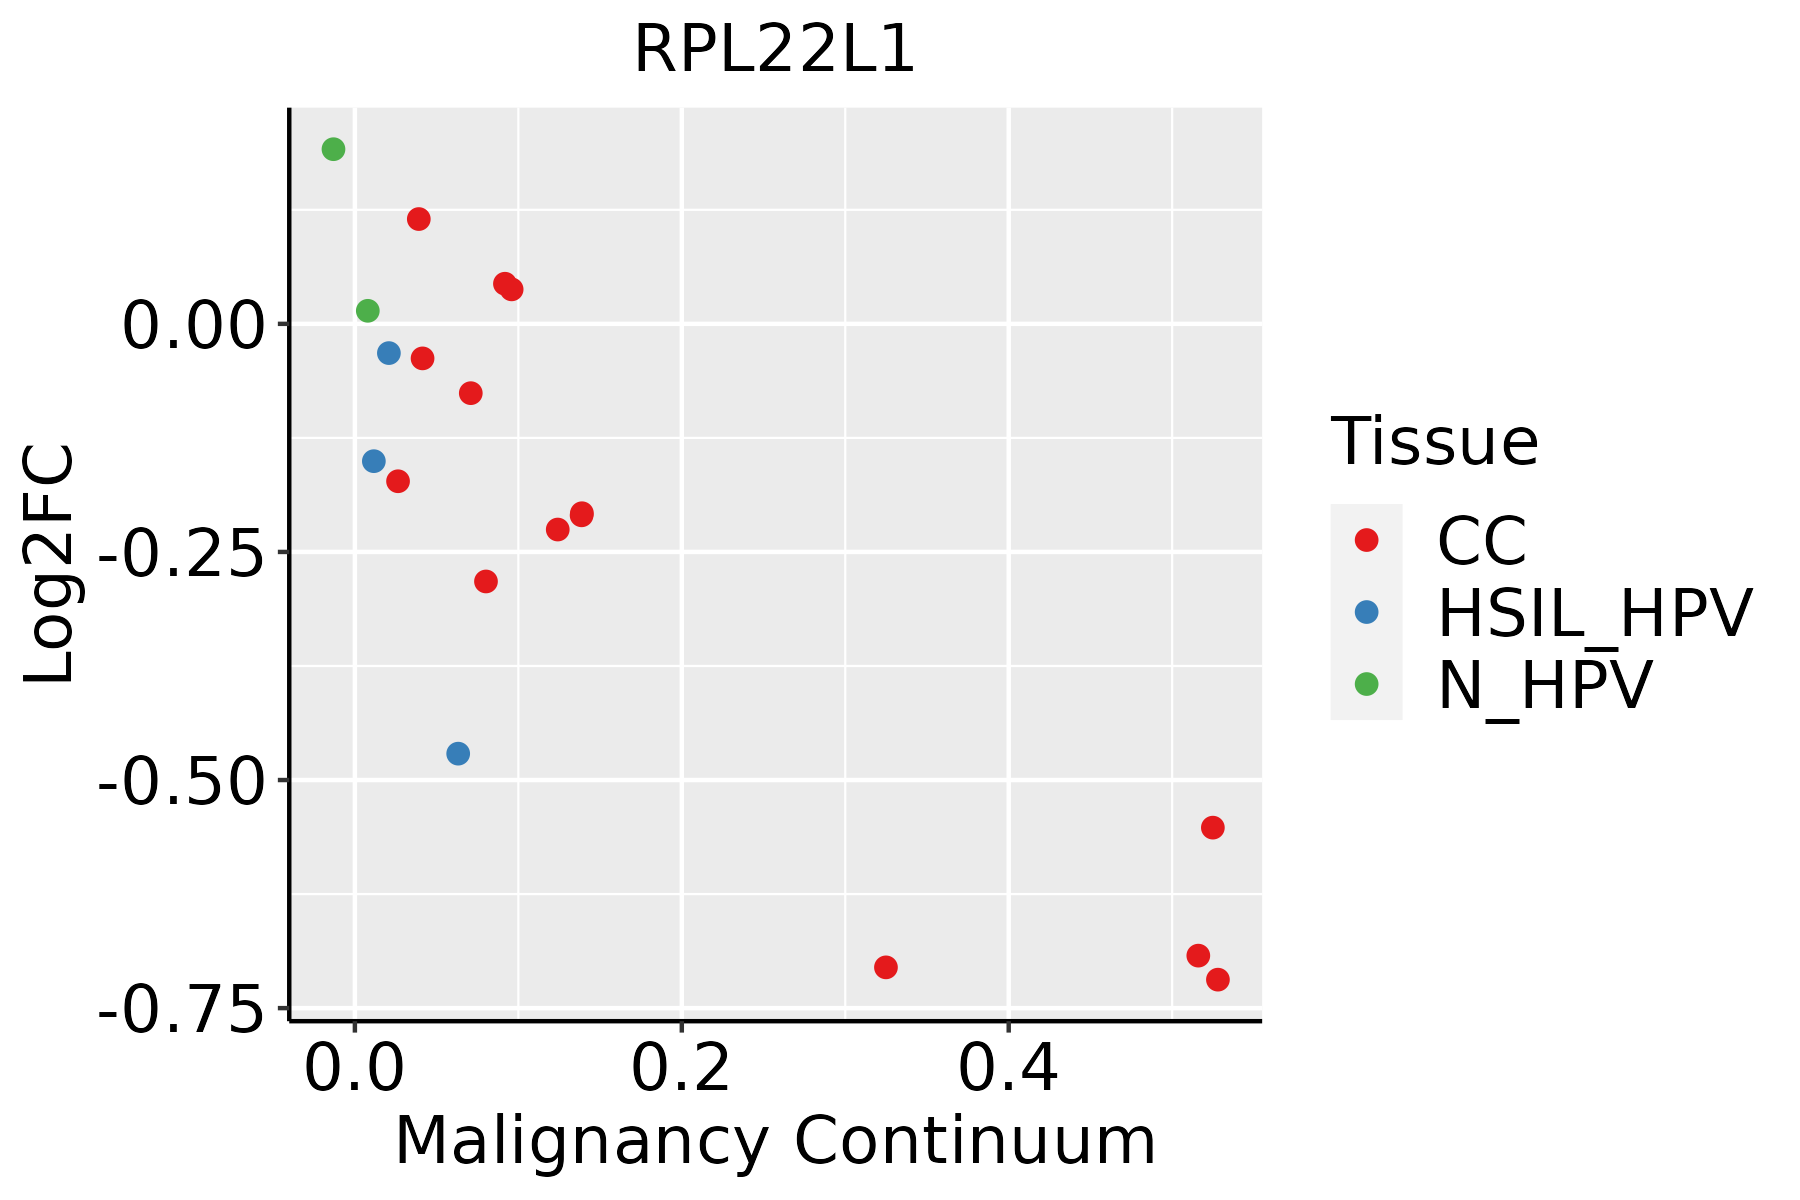 | CC: Cervix cancer |
| HSIL_HPV: HPV-infected high-grade squamous intraepithelial lesions | ||
| N_HPV: HPV-infected normal cervix | ||
| Colorectum (GSE201348) |  | FAP: Familial adenomatous polyposis |
| CRC: Colorectal cancer | ||
| Colorectum (HTA11) |  | AD: Adenomas |
| SER: Sessile serrated lesions | ||
| MSI-H: Microsatellite-high colorectal cancer | ||
| MSS: Microsatellite stable colorectal cancer | ||
| Endometrium | 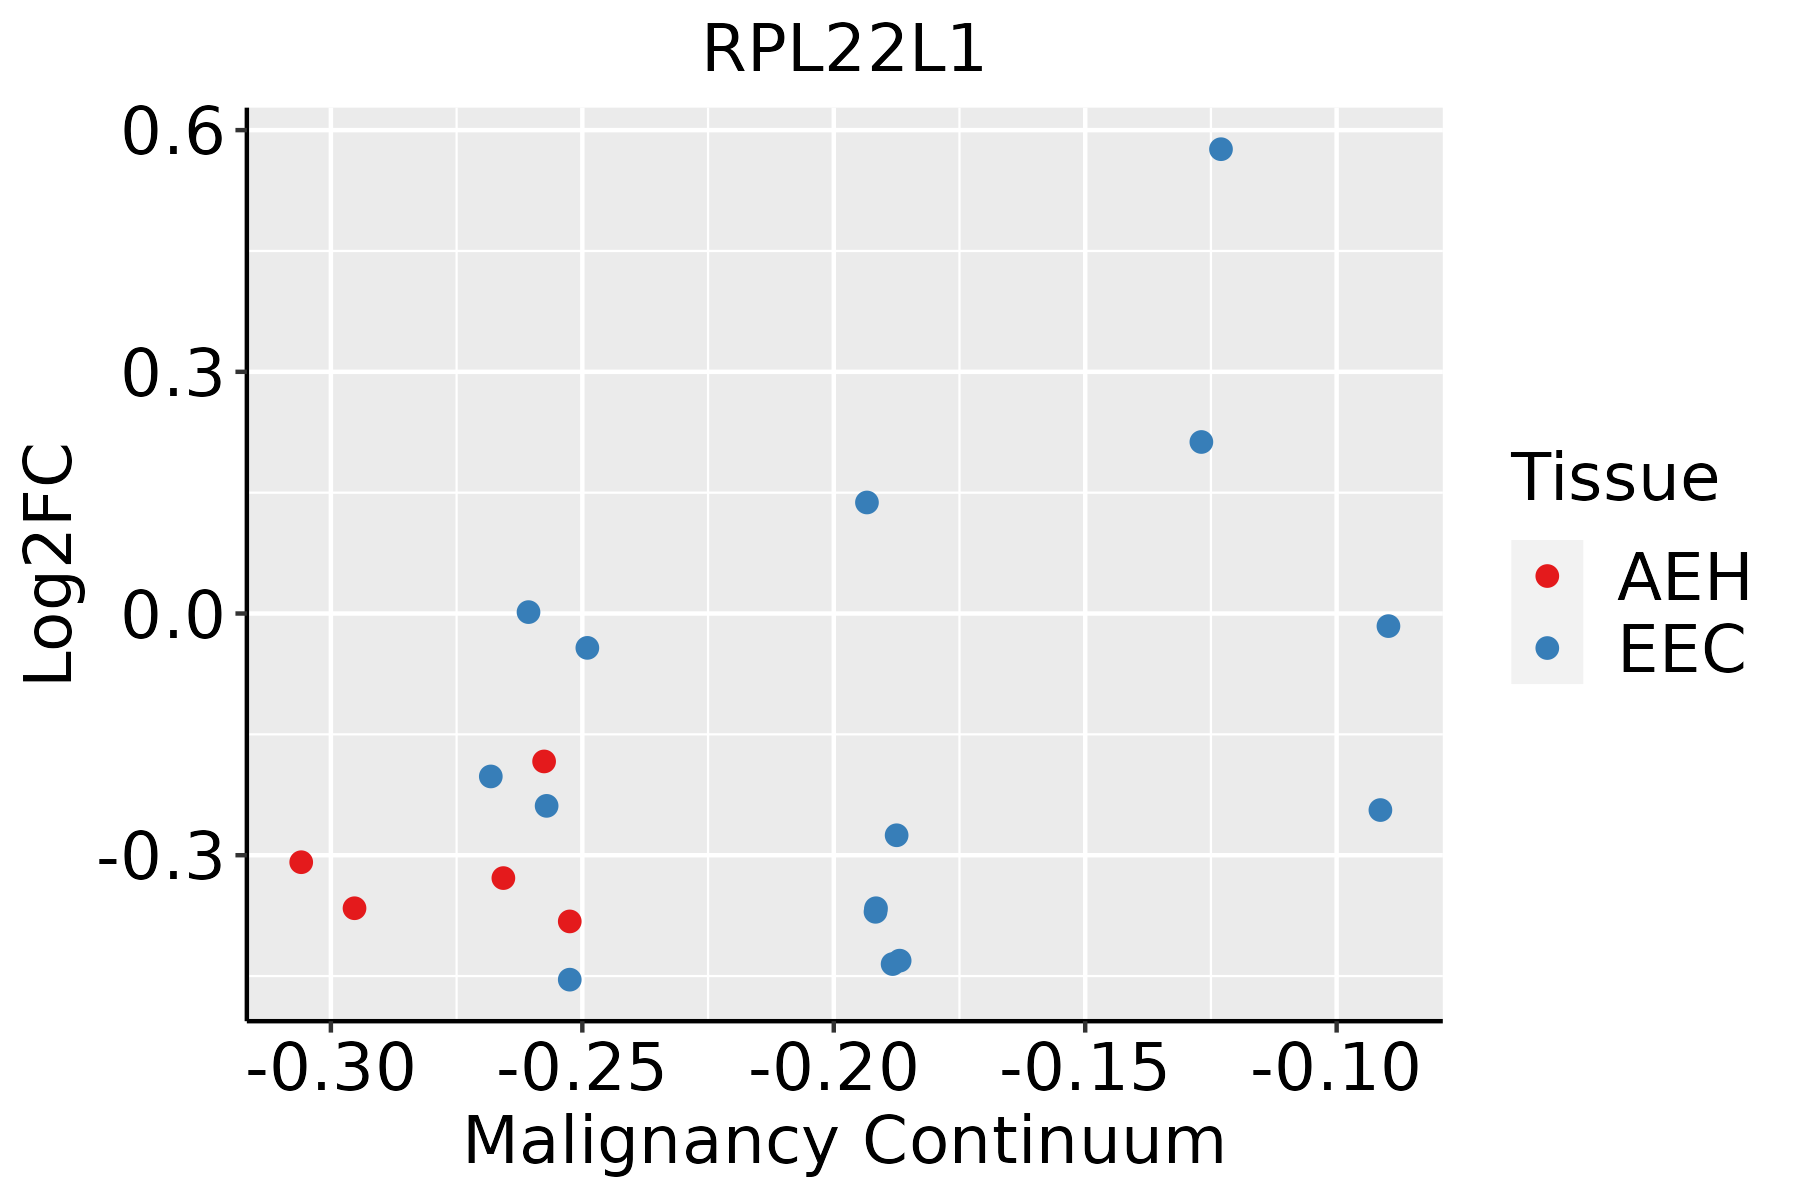 | AEH: Atypical endometrial hyperplasia |
| EEC: Endometrioid Cancer | ||
| Esophagus | 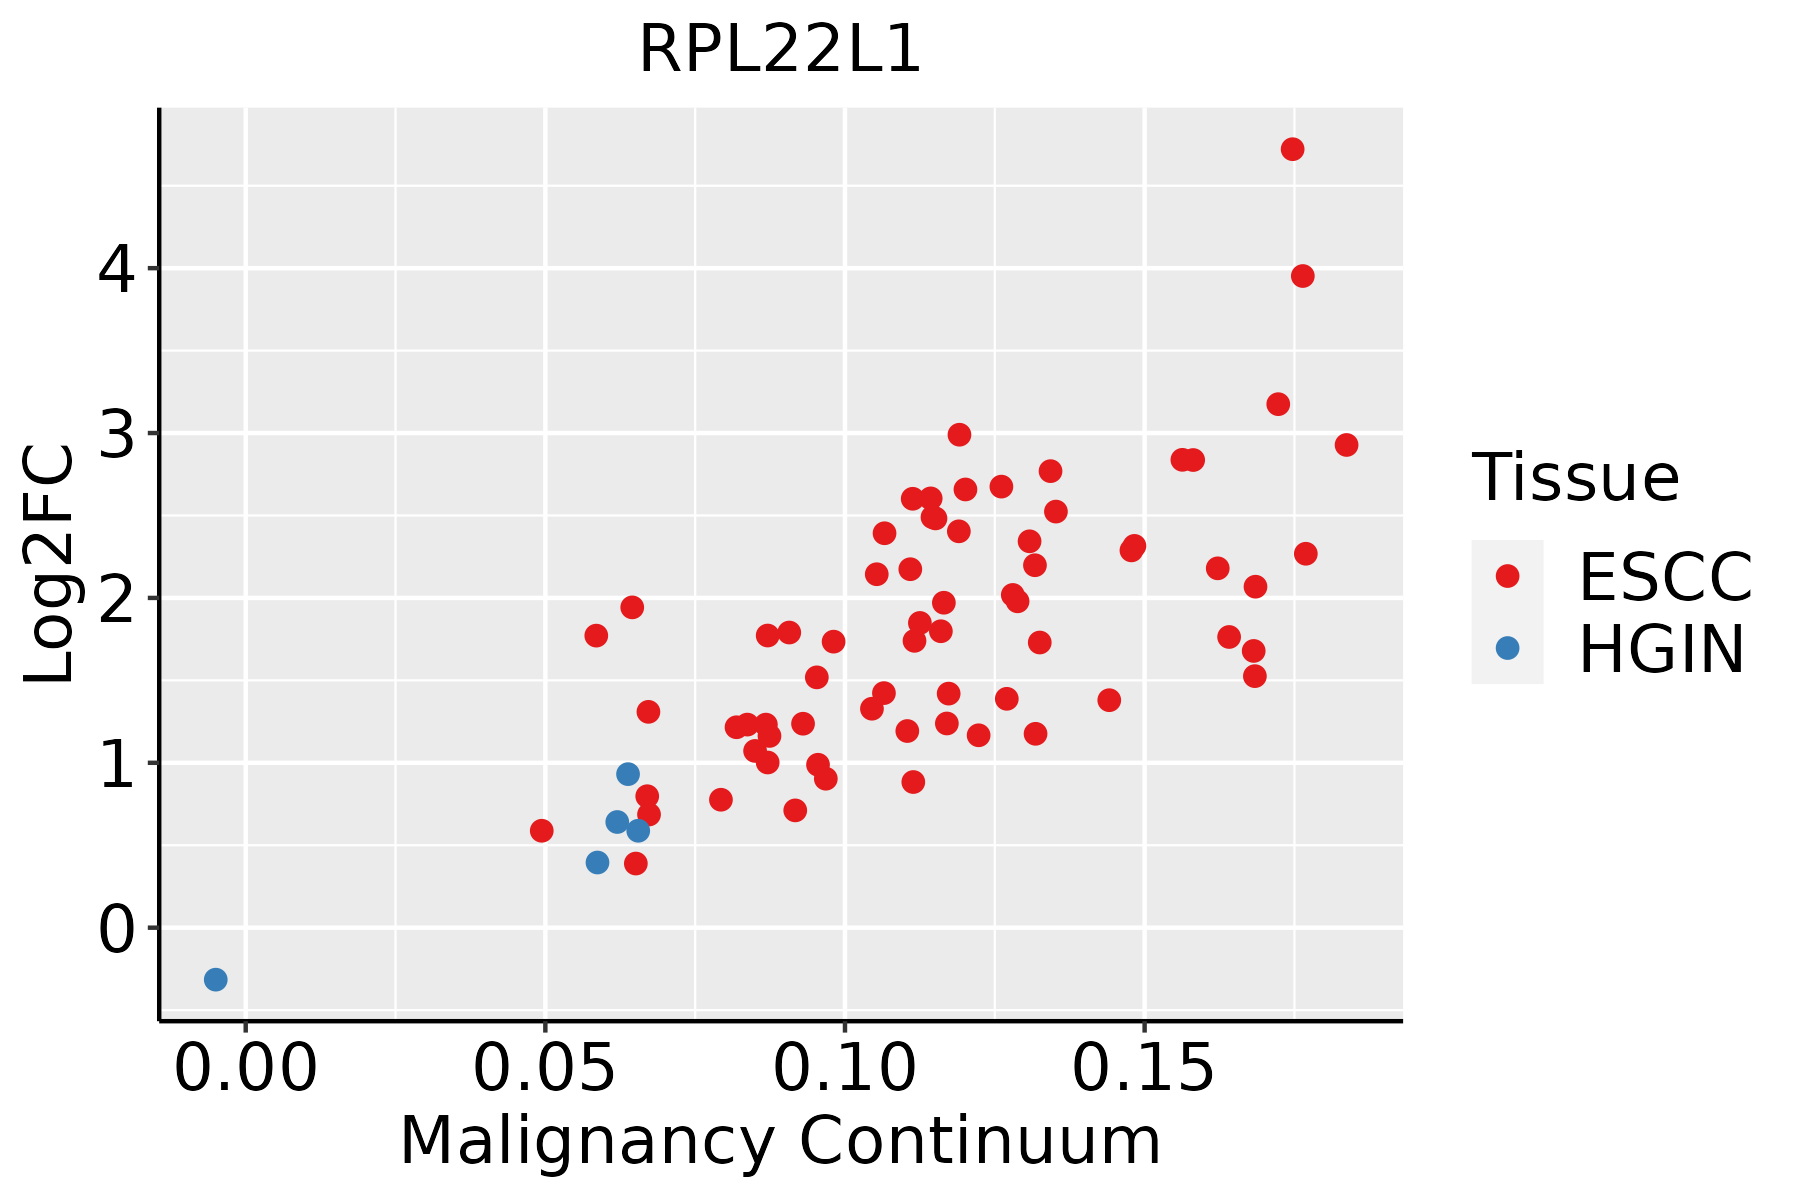 | ESCC: Esophageal squamous cell carcinoma |
| HGIN: High-grade intraepithelial neoplasias | ||
| LGIN: Low-grade intraepithelial neoplasias | ||
| Liver | 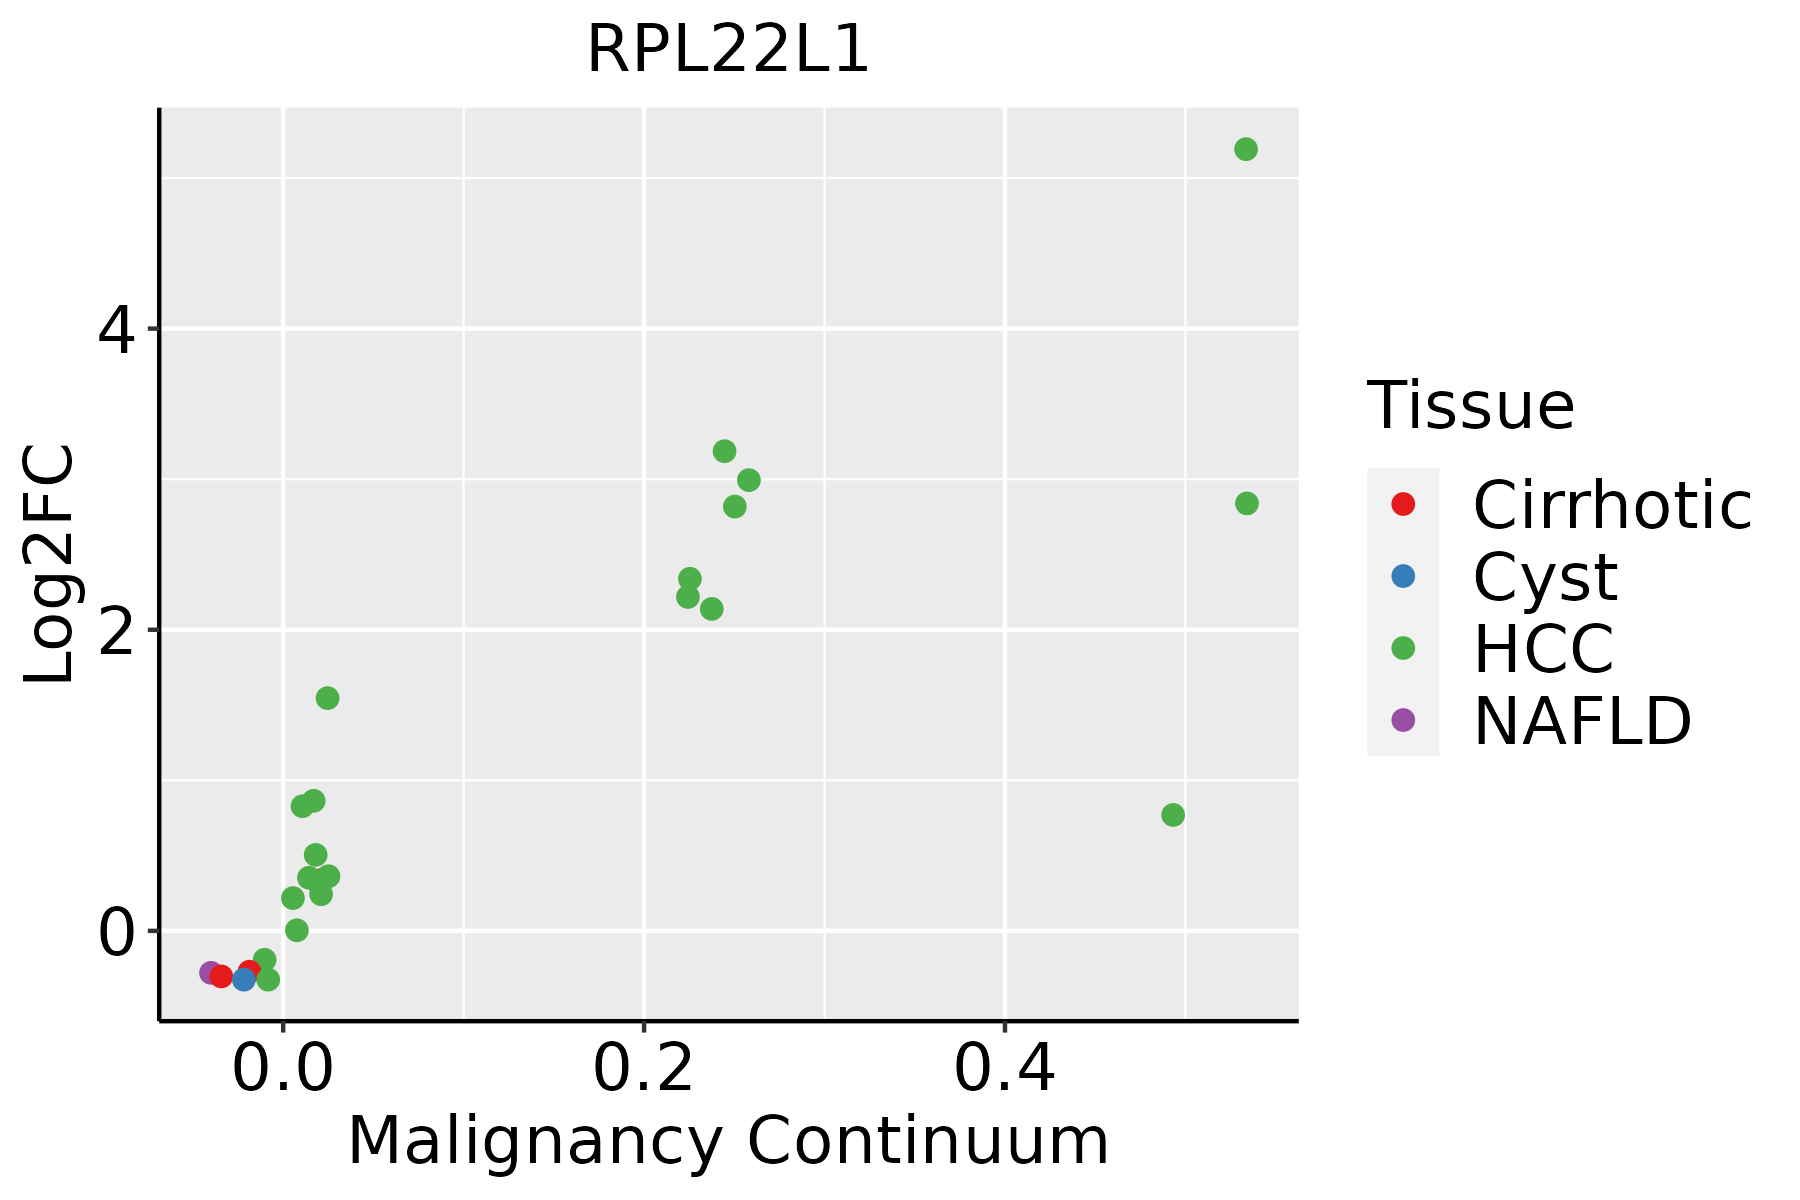 | HCC: Hepatocellular carcinoma |
| NAFLD: Non-alcoholic fatty liver disease | ||
| Oral Cavity | 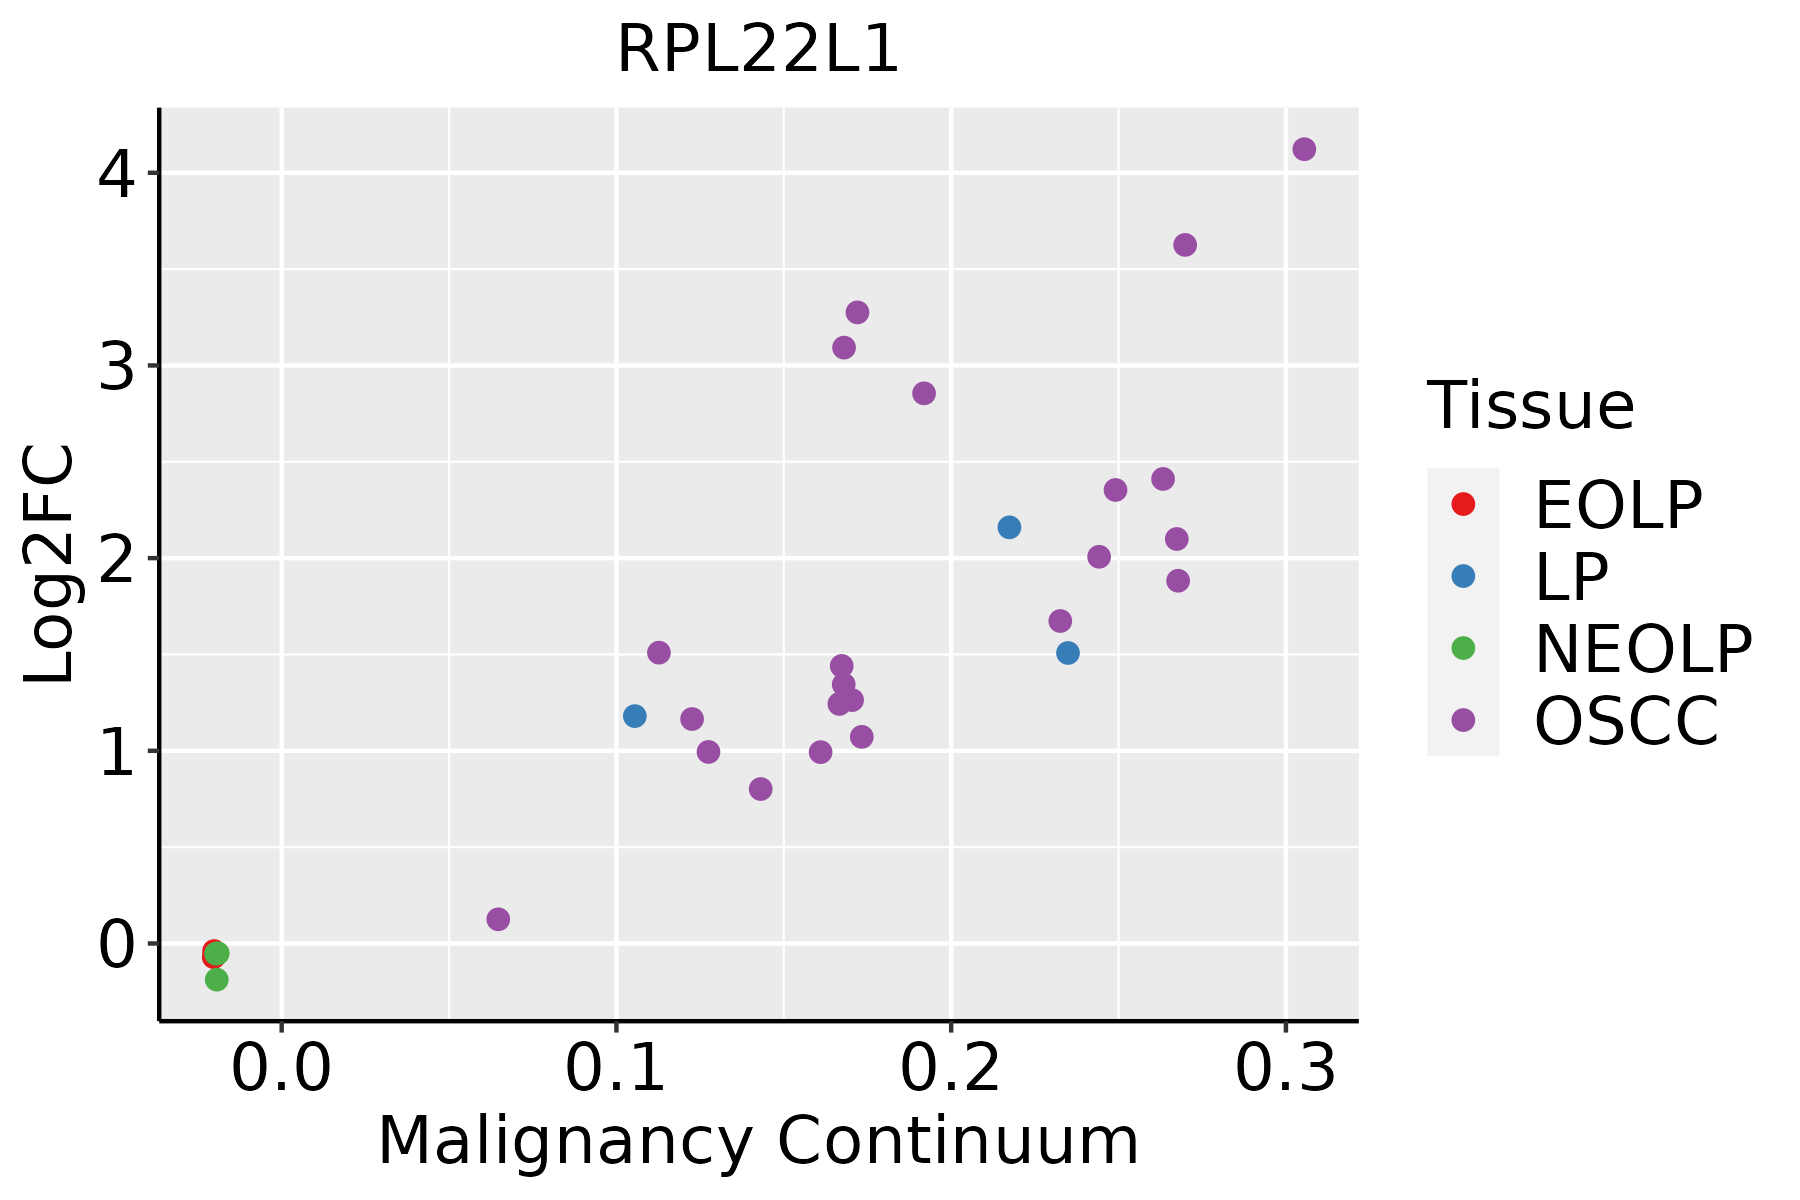 | EOLP: Erosive Oral lichen planus |
| LP: leukoplakia | ||
| NEOLP: Non-erosive oral lichen planus | ||
| OSCC: Oral squamous cell carcinoma | ||
| Prostate | 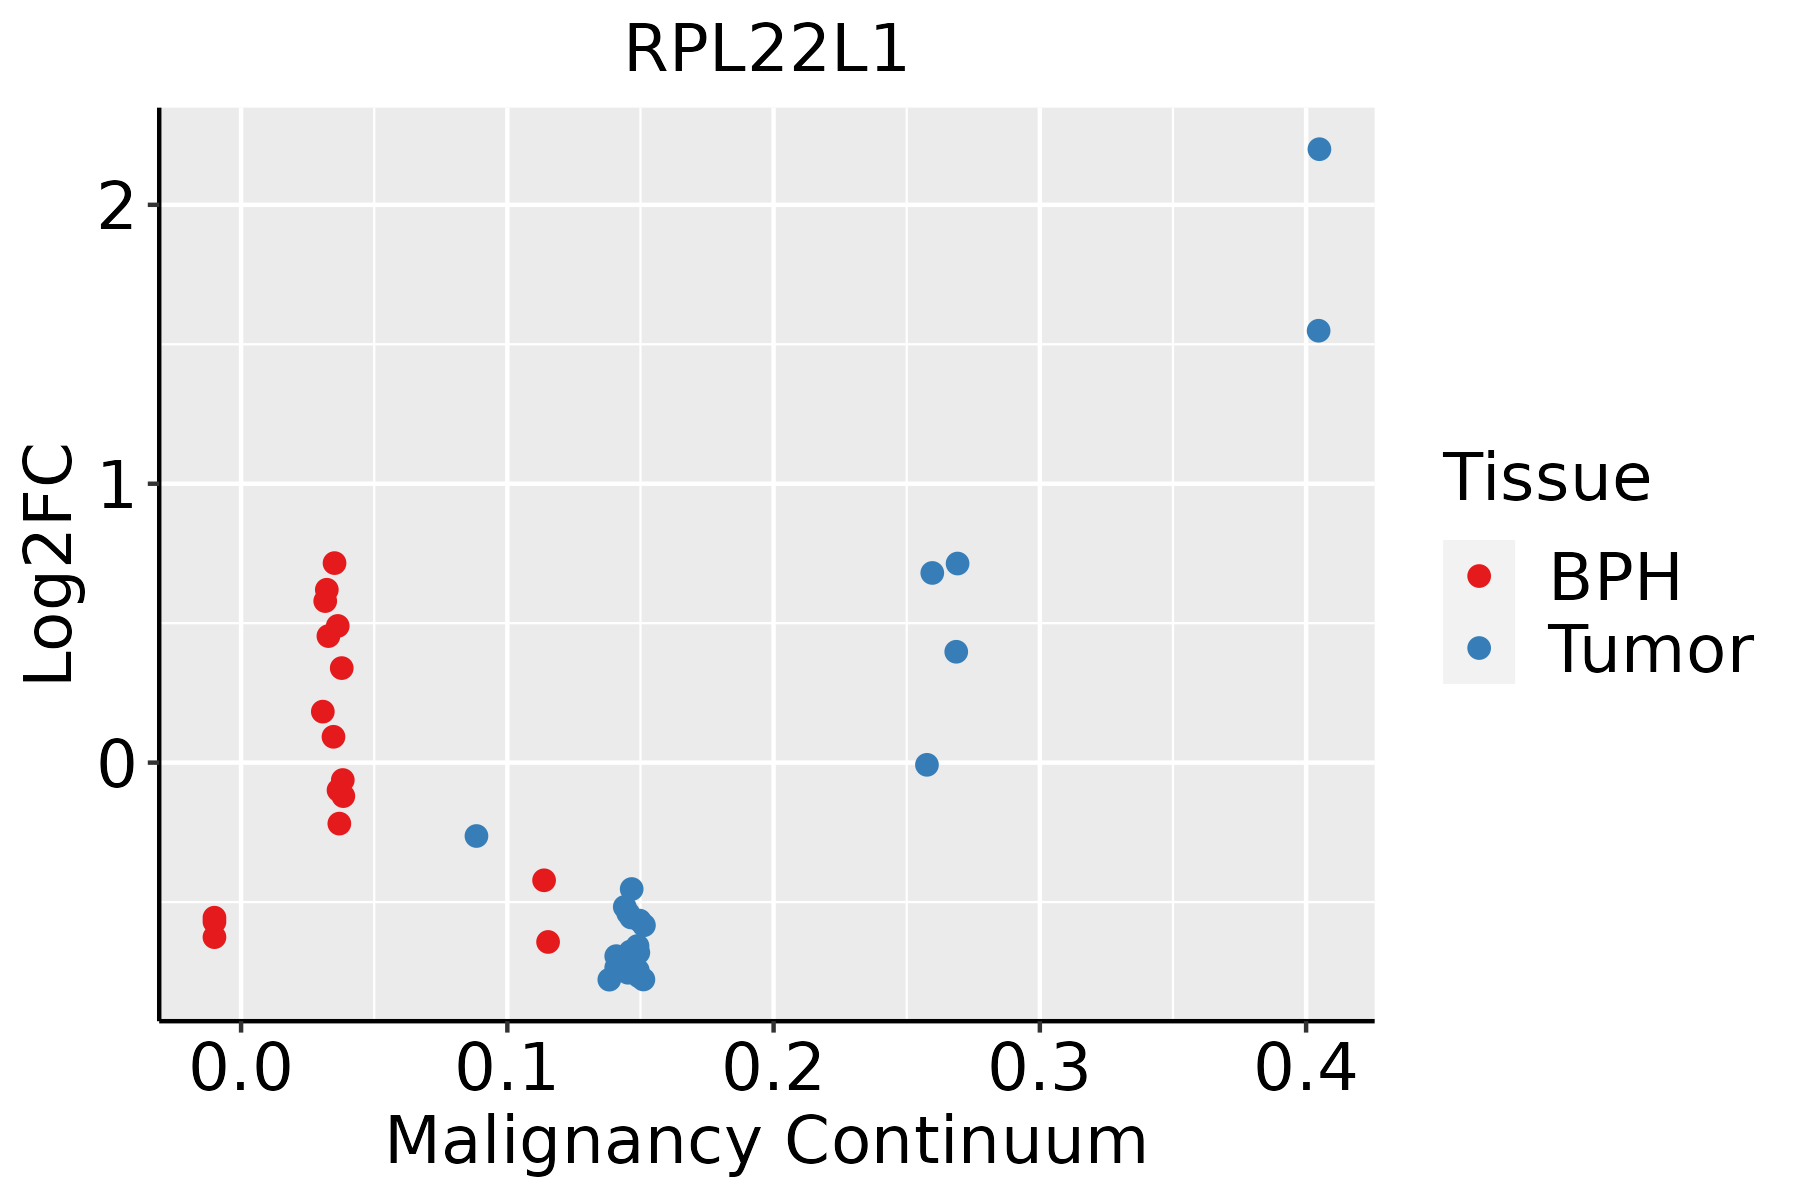 | BPH: Benign Prostatic Hyperplasia |
| Skin | 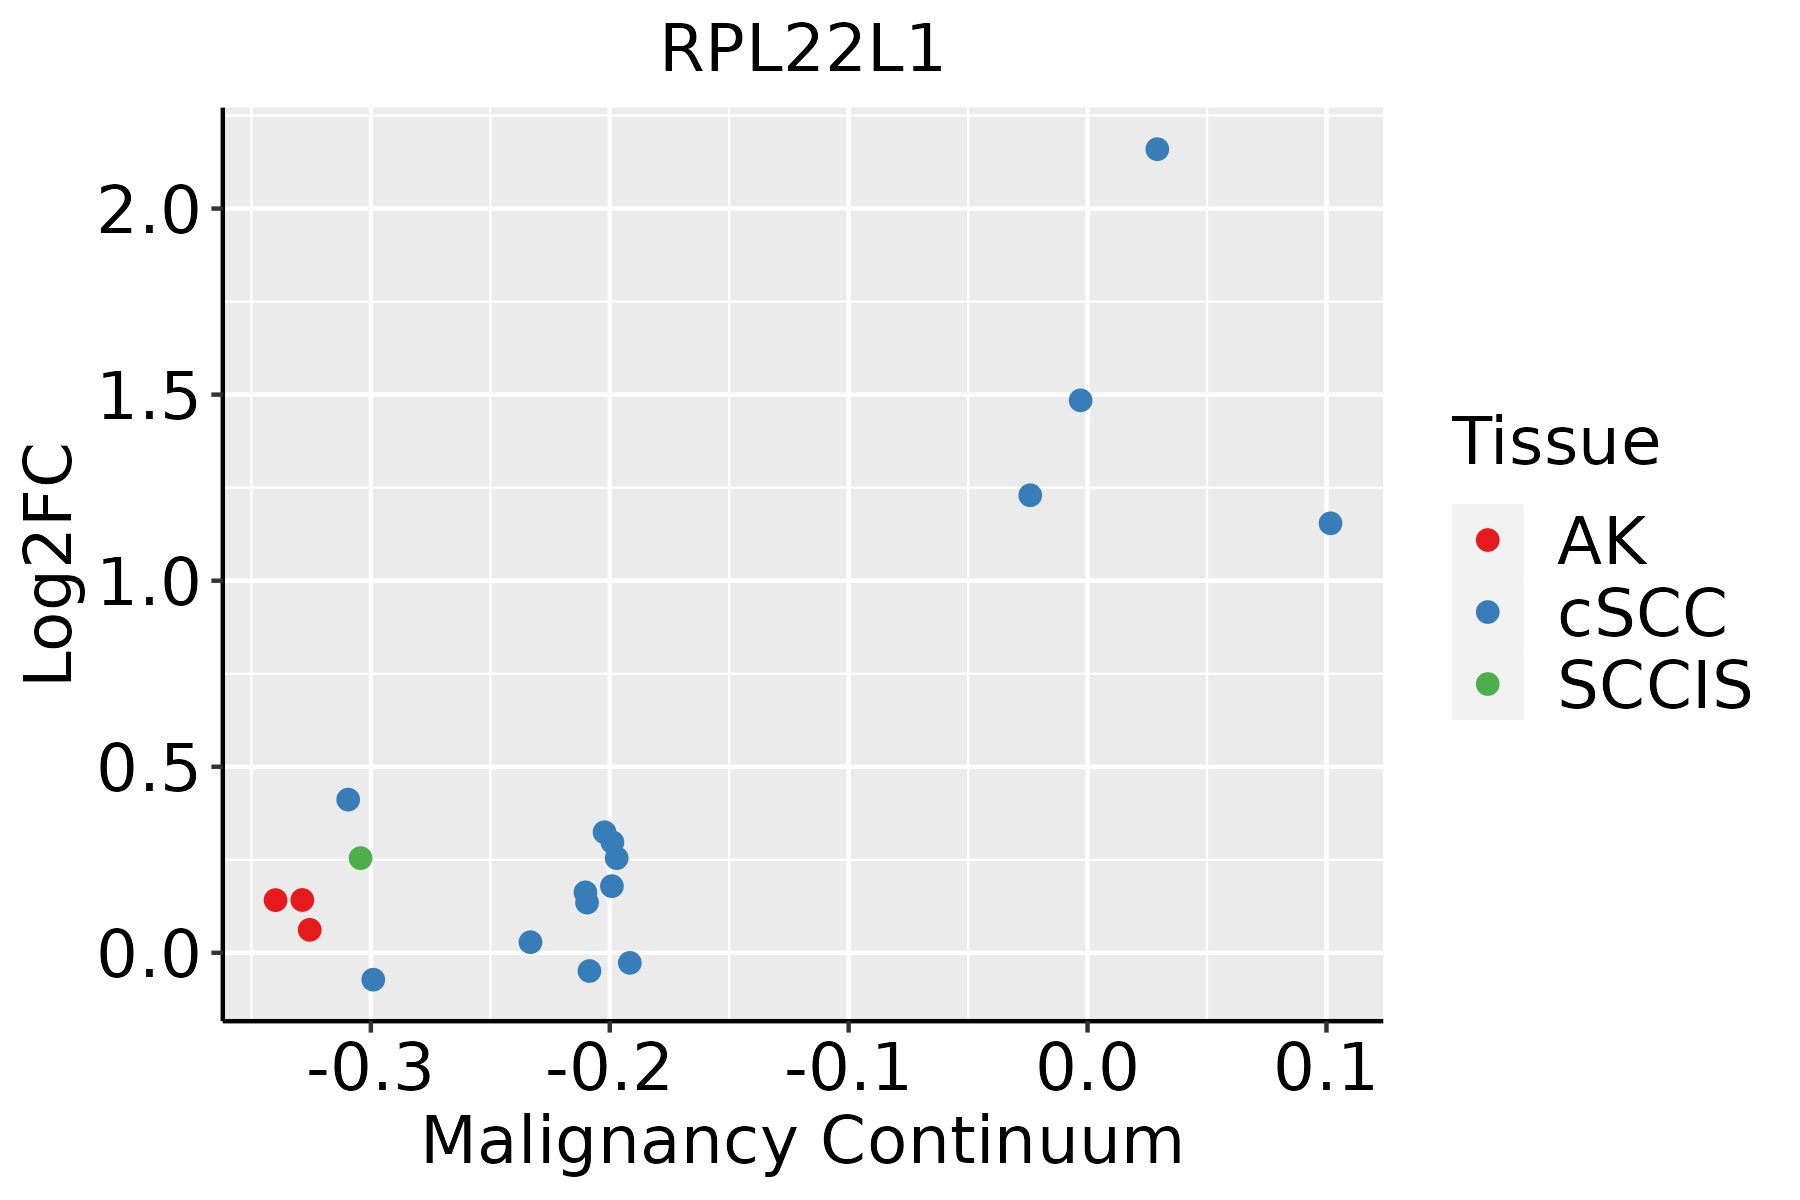 | AK: Actinic keratosis |
| cSCC: Cutaneous squamous cell carcinoma | ||
| SCCIS:squamous cell carcinoma in situ | ||
| Thyroid | 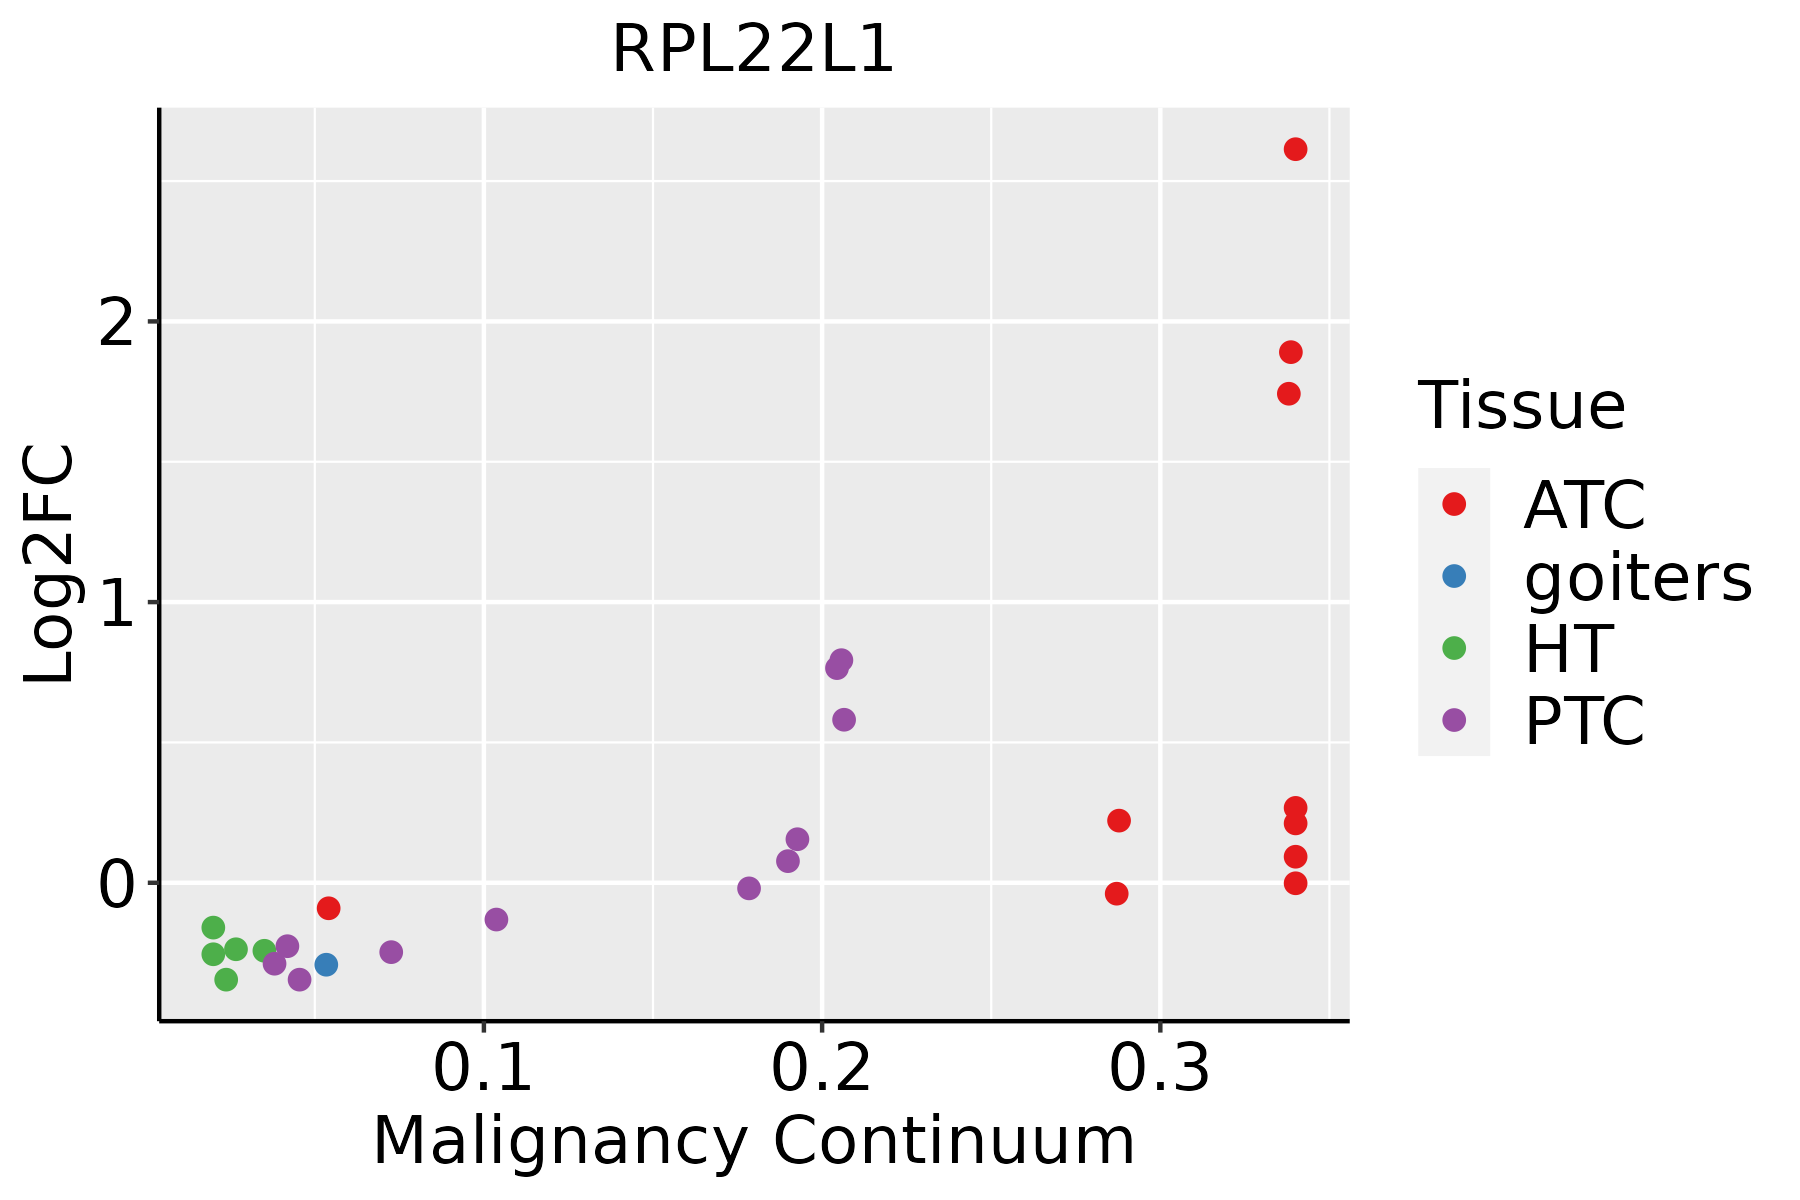 | ATC: Anaplastic thyroid cancer |
| HT: Hashimoto's thyroiditis | ||
| PTC: Papillary thyroid cancer |
| ∗log2FC in expression of this searched gene in stem-like cells from each diseased tissue sample relative to stem-like cells in normal samples in each tissue plotted against the malignancy continuum. Samples are colored based on if they are from different disease stage. |
Top |
Malignant transformation related pathway analysis |
| Find out the enriched GO biological processes and KEGG pathways involved in transition from healthy to precancer to cancer |
| Tissue | Disease Stage | Enriched GO biological Processes |
| Colorectum | AD |  |
| Colorectum | SER |  |
| Colorectum | MSS |  |
| Colorectum | MSI-H |  |
| Colorectum | FAP |  |
| ∗Top 15 enriched GO BP terms are showed in the bar plot of each disease state in each tissue. Each row represents a significant GO biological process which is colored according to the -log10(p.adjust). |
| Page: 1 2 3 4 5 6 7 8 9 |
| GO ID | Tissue | Disease Stage | Description | Gene Ratio | Bg Ratio | pvalue | p.adjust | Count |
| GO:000218110 | Cervix | CC | cytoplasmic translation | 96/2311 | 148/18723 | 4.87e-51 | 2.91e-47 | 96 |
| GO:000218115 | Cervix | HSIL_HPV | cytoplasmic translation | 86/737 | 148/18723 | 3.97e-82 | 1.91e-78 | 86 |
| GO:000218125 | Cervix | N_HPV | cytoplasmic translation | 42/534 | 148/18723 | 2.61e-30 | 1.19e-26 | 42 |
| GO:0002181 | Colorectum | AD | cytoplasmic translation | 109/3918 | 148/18723 | 3.40e-43 | 2.13e-39 | 109 |
| GO:00021811 | Colorectum | SER | cytoplasmic translation | 102/2897 | 148/18723 | 1.38e-48 | 8.49e-45 | 102 |
| GO:00021812 | Colorectum | MSS | cytoplasmic translation | 108/3467 | 148/18723 | 1.78e-47 | 1.11e-43 | 108 |
| GO:00021813 | Colorectum | MSI-H | cytoplasmic translation | 100/1319 | 148/18723 | 1.50e-79 | 8.31e-76 | 100 |
| GO:000218116 | Endometrium | AEH | cytoplasmic translation | 104/2100 | 148/18723 | 1.01e-64 | 6.07e-61 | 104 |
| GO:000218117 | Endometrium | EEC | cytoplasmic translation | 104/2168 | 148/18723 | 2.53e-63 | 1.52e-59 | 104 |
| GO:0002181111 | Esophagus | ESCC | cytoplasmic translation | 135/8552 | 148/18723 | 4.17e-32 | 2.65e-29 | 135 |
| GO:000218112 | Liver | Cirrhotic | cytoplasmic translation | 120/4634 | 148/18723 | 2.95e-47 | 1.85e-43 | 120 |
| GO:000218122 | Liver | HCC | cytoplasmic translation | 132/7958 | 148/18723 | 9.09e-33 | 5.76e-30 | 132 |
| GO:000218120 | Oral cavity | OSCC | cytoplasmic translation | 133/7305 | 148/18723 | 1.94e-38 | 2.46e-35 | 133 |
| GO:0002181110 | Oral cavity | LP | cytoplasmic translation | 124/4623 | 148/18723 | 5.09e-52 | 3.19e-48 | 124 |
| GO:000218118 | Prostate | BPH | cytoplasmic translation | 115/3107 | 148/18723 | 1.08e-60 | 6.68e-57 | 115 |
| GO:000218119 | Prostate | Tumor | cytoplasmic translation | 115/3246 | 148/18723 | 1.36e-58 | 8.43e-55 | 115 |
| GO:000218129 | Skin | cSCC | cytoplasmic translation | 127/4864 | 148/18723 | 4.83e-53 | 7.57e-50 | 127 |
| GO:0002181113 | Thyroid | PTC | cytoplasmic translation | 121/5968 | 148/18723 | 4.32e-36 | 4.54e-33 | 121 |
| GO:000218135 | Thyroid | ATC | cytoplasmic translation | 121/6293 | 148/18723 | 1.41e-33 | 1.49e-30 | 121 |
| Page: 1 |
| Pathway ID | Tissue | Disease Stage | Description | Gene Ratio | Bg Ratio | pvalue | p.adjust | qvalue | Count |
| hsa0517120 | Cervix | CC | Coronavirus disease - COVID-19 | 111/1267 | 232/8465 | 1.82e-33 | 5.90e-31 | 3.49e-31 | 111 |
| hsa0301020 | Cervix | CC | Ribosome | 85/1267 | 167/8465 | 3.17e-28 | 5.14e-26 | 3.04e-26 | 85 |
| hsa05171110 | Cervix | CC | Coronavirus disease - COVID-19 | 111/1267 | 232/8465 | 1.82e-33 | 5.90e-31 | 3.49e-31 | 111 |
| hsa03010110 | Cervix | CC | Ribosome | 85/1267 | 167/8465 | 3.17e-28 | 5.14e-26 | 3.04e-26 | 85 |
| hsa0301025 | Cervix | HSIL_HPV | Ribosome | 80/459 | 167/8465 | 9.61e-58 | 2.82e-55 | 2.28e-55 | 80 |
| hsa0517125 | Cervix | HSIL_HPV | Coronavirus disease - COVID-19 | 91/459 | 232/8465 | 2.14e-56 | 3.13e-54 | 2.53e-54 | 91 |
| hsa0301035 | Cervix | HSIL_HPV | Ribosome | 80/459 | 167/8465 | 9.61e-58 | 2.82e-55 | 2.28e-55 | 80 |
| hsa0517135 | Cervix | HSIL_HPV | Coronavirus disease - COVID-19 | 91/459 | 232/8465 | 2.14e-56 | 3.13e-54 | 2.53e-54 | 91 |
| hsa0517145 | Cervix | N_HPV | Coronavirus disease - COVID-19 | 47/349 | 232/8465 | 1.79e-20 | 4.86e-18 | 3.80e-18 | 47 |
| hsa0301045 | Cervix | N_HPV | Ribosome | 39/349 | 167/8465 | 2.05e-19 | 2.79e-17 | 2.18e-17 | 39 |
| hsa0517155 | Cervix | N_HPV | Coronavirus disease - COVID-19 | 47/349 | 232/8465 | 1.79e-20 | 4.86e-18 | 3.80e-18 | 47 |
| hsa0301055 | Cervix | N_HPV | Ribosome | 39/349 | 167/8465 | 2.05e-19 | 2.79e-17 | 2.18e-17 | 39 |
| hsa03010 | Colorectum | AD | Ribosome | 96/2092 | 167/8465 | 8.28e-20 | 5.54e-18 | 3.54e-18 | 96 |
| hsa05171 | Colorectum | AD | Coronavirus disease - COVID-19 | 113/2092 | 232/8465 | 9.90e-16 | 2.55e-14 | 1.63e-14 | 113 |
| hsa030101 | Colorectum | AD | Ribosome | 96/2092 | 167/8465 | 8.28e-20 | 5.54e-18 | 3.54e-18 | 96 |
| hsa051711 | Colorectum | AD | Coronavirus disease - COVID-19 | 113/2092 | 232/8465 | 9.90e-16 | 2.55e-14 | 1.63e-14 | 113 |
| hsa030104 | Colorectum | MSS | Ribosome | 96/1875 | 167/8465 | 1.82e-23 | 2.03e-21 | 1.24e-21 | 96 |
| hsa051714 | Colorectum | MSS | Coronavirus disease - COVID-19 | 108/1875 | 232/8465 | 6.50e-17 | 1.67e-15 | 1.03e-15 | 108 |
| hsa030105 | Colorectum | MSS | Ribosome | 96/1875 | 167/8465 | 1.82e-23 | 2.03e-21 | 1.24e-21 | 96 |
| hsa051715 | Colorectum | MSS | Coronavirus disease - COVID-19 | 108/1875 | 232/8465 | 6.50e-17 | 1.67e-15 | 1.03e-15 | 108 |
| Page: 1 2 3 |
Top |
Cell-cell communication analysis |
| Identification of potential cell-cell interactions between two cell types and their ligand-receptor pairs for different disease states |
| Ligand | Receptor | LRpair | Pathway | Tissue | Disease Stage |
| Page: 1 |
Top |
Single-cell gene regulatory network inference analysis |
| Find out the significant the regulons (TFs) and the target genes of each regulon across cell types for different disease states |
| TF | Cell Type | Tissue | Disease Stage | Target Gene | RSS | Regulon Activity |
| ∗The dot plots of a searched regulon are shown for all cell subpopulations in each disease state of each tissue based on the regulon specific score inferred using pySCENIC and by calculating the average expression. |
| Page: 1 |
Top |
Somatic mutation of malignant transformation related genes |
| Annotation of somatic variants for genes involved in malignant transformation |
| Hugo Symbol | Variant Class | Variant Classification | dbSNP RS | HGVSc | HGVSp | HGVSp Short | SWISSPROT | BIOTYPE | SIFT | PolyPhen | Tumor Sample Barcode | Tissue | Histology | Sex | Age | Stage | Therapy Types | Drugs | Outcome |
| RPL22L1 | SNV | Missense_Mutation | novel | c.361N>C | p.Glu121Gln | p.E121Q | Q6P5R6 | protein_coding | deleterious(0) | benign(0.305) | TCGA-BH-A0B6-01 | Breast | breast invasive carcinoma | Female | <65 | I/II | Unknown | Unknown | SD |
| RPL22L1 | SNV | Missense_Mutation | novel | c.317N>G | p.Leu106Arg | p.L106R | Q6P5R6 | protein_coding | deleterious(0) | probably_damaging(0.999) | TCGA-A6-2672-01 | Colorectum | colon adenocarcinoma | Female | >=65 | III/IV | Unknown | Unknown | SD |
| RPL22L1 | SNV | Missense_Mutation | c.151N>A | p.Leu51Ile | p.L51I | Q6P5R6 | protein_coding | deleterious(0.02) | probably_damaging(0.984) | TCGA-AP-A059-01 | Endometrium | uterine corpus endometrioid carcinoma | Female | >=65 | I/II | Unknown | Unknown | SD | |
| RPL22L1 | SNV | Missense_Mutation | c.151N>A | p.Leu51Ile | p.L51I | Q6P5R6 | protein_coding | deleterious(0.02) | probably_damaging(0.984) | TCGA-B5-A1MR-01 | Endometrium | uterine corpus endometrioid carcinoma | Female | >=65 | III/IV | Unknown | Unknown | SD | |
| RPL22L1 | SNV | Missense_Mutation | rs761781205 | c.313G>A | p.Glu105Lys | p.E105K | Q6P5R6 | protein_coding | tolerated(0.13) | possibly_damaging(0.537) | TCGA-D1-A103-01 | Endometrium | uterine corpus endometrioid carcinoma | Female | >=65 | I/II | Unknown | Unknown | SD |
| RPL22L1 | SNV | Missense_Mutation | novel | c.55N>A | p.Asp19Asn | p.D19N | Q6P5R6 | protein_coding | tolerated(0.12) | possibly_damaging(0.651) | TCGA-DF-A2KU-01 | Endometrium | uterine corpus endometrioid carcinoma | Female | Unknown | I/II | Unknown | Unknown | SD |
| RPL22L1 | SNV | Missense_Mutation | c.319C>T | p.Arg107Cys | p.R107C | Q6P5R6 | protein_coding | tolerated(0.12) | benign(0.081) | TCGA-E6-A1LX-01 | Endometrium | uterine corpus endometrioid carcinoma | Female | <65 | I/II | Unknown | Unknown | SD | |
| RPL22L1 | SNV | Missense_Mutation | rs200190593 | c.115N>T | p.Arg39Trp | p.R39W | Q6P5R6 | protein_coding | tolerated(0.18) | benign(0.022) | TCGA-EO-A22U-01 | Endometrium | uterine corpus endometrioid carcinoma | Female | >=65 | I/II | Unknown | Unknown | SD |
| RPL22L1 | SNV | Missense_Mutation | c.319N>T | p.Arg107Cys | p.R107C | Q6P5R6 | protein_coding | tolerated(0.12) | benign(0.081) | TCGA-EO-A3AV-01 | Endometrium | uterine corpus endometrioid carcinoma | Female | <65 | III/IV | Chemotherapy | carboplatin | CR | |
| RPL22L1 | SNV | Missense_Mutation | novel | c.23N>T | p.Lys8Met | p.K8M | Q6P5R6 | protein_coding | deleterious(0) | probably_damaging(0.951) | TCGA-56-7823-01 | Lung | lung squamous cell carcinoma | Female | <65 | I/II | Chemotherapy | cisplatin | CR |
| Page: 1 2 |
Top |
Related drugs of malignant transformation related genes |
| Identification of chemicals and drugs interact with genes involved in malignant transfromation |
| (DGIdb 4.0) |
| Entrez ID | Symbol | Category | Interaction Types | Drug Claim Name | Drug Name | PMIDs |
| Page: 1 |

Copyright 2023-Present -The University of Texas Health Science Center at Houston |