
|
|||||
|
 | |
| |
| |
| |
| |
| |
|
Gene: RPL22 |
Gene summary for RPL22 |
| Gene information | Species | Human | Gene symbol | RPL22 | Gene ID | 6146 |
| Gene name | ribosomal protein L22 | |
| Gene Alias | EAP | |
| Cytomap | 1p36.31 | |
| Gene Type | protein-coding | GO ID | GO:0001775 | UniProtAcc | P35268 |
Top |
Malignant transformation analysis |
| Identification of the aberrant gene expression in precancerous and cancerous lesions by comparing the gene expression of stem-like cells in diseased tissues with normal stem cells |
| Entrez ID | Symbol | Replicates | Species | Organ | Tissue | Adj P-value | Log2FC | Malignancy |
| 6146 | RPL22 | GSM4909282 | Human | Breast | IDC | 1.71e-19 | -2.49e-01 | -0.0288 |
| 6146 | RPL22 | GSM4909288 | Human | Breast | IDC | 4.99e-10 | 2.63e-01 | 0.0988 |
| 6146 | RPL22 | GSM4909291 | Human | Breast | IDC | 3.58e-06 | -2.22e-01 | 0.1753 |
| 6146 | RPL22 | GSM4909294 | Human | Breast | IDC | 1.14e-22 | 2.04e-01 | 0.2022 |
| 6146 | RPL22 | GSM4909296 | Human | Breast | IDC | 1.38e-04 | 1.06e-01 | 0.1524 |
| 6146 | RPL22 | GSM4909297 | Human | Breast | IDC | 8.92e-05 | -2.21e-01 | 0.1517 |
| 6146 | RPL22 | GSM4909301 | Human | Breast | IDC | 2.11e-22 | -3.42e-01 | 0.1577 |
| 6146 | RPL22 | GSM4909306 | Human | Breast | IDC | 1.43e-05 | -1.40e-01 | 0.1564 |
| 6146 | RPL22 | GSM4909307 | Human | Breast | IDC | 3.71e-19 | -2.83e-01 | 0.1569 |
| 6146 | RPL22 | GSM4909308 | Human | Breast | IDC | 4.20e-30 | -3.35e-01 | 0.158 |
| 6146 | RPL22 | GSM4909309 | Human | Breast | IDC | 4.90e-02 | -2.13e-01 | 0.0483 |
| 6146 | RPL22 | GSM4909311 | Human | Breast | IDC | 4.59e-33 | -5.08e-01 | 0.1534 |
| 6146 | RPL22 | GSM4909312 | Human | Breast | IDC | 3.23e-32 | -5.29e-01 | 0.1552 |
| 6146 | RPL22 | GSM4909313 | Human | Breast | IDC | 2.38e-04 | -2.58e-01 | 0.0391 |
| 6146 | RPL22 | GSM4909315 | Human | Breast | IDC | 5.89e-20 | 2.24e-01 | 0.21 |
| 6146 | RPL22 | GSM4909316 | Human | Breast | IDC | 2.16e-10 | 1.56e-01 | 0.21 |
| 6146 | RPL22 | GSM4909319 | Human | Breast | IDC | 3.39e-70 | -9.45e-01 | 0.1563 |
| 6146 | RPL22 | GSM4909321 | Human | Breast | IDC | 1.92e-25 | -4.97e-01 | 0.1559 |
| 6146 | RPL22 | brca1 | Human | Breast | Precancer | 1.12e-09 | -1.37e-01 | -0.0338 |
| 6146 | RPL22 | brca2 | Human | Breast | Precancer | 2.31e-23 | -2.14e-01 | -0.024 |
| Page: 1 2 3 4 5 6 7 8 9 10 11 12 13 14 15 16 17 |
| Tissue | Expression Dynamics | Abbreviation |
| Breast | 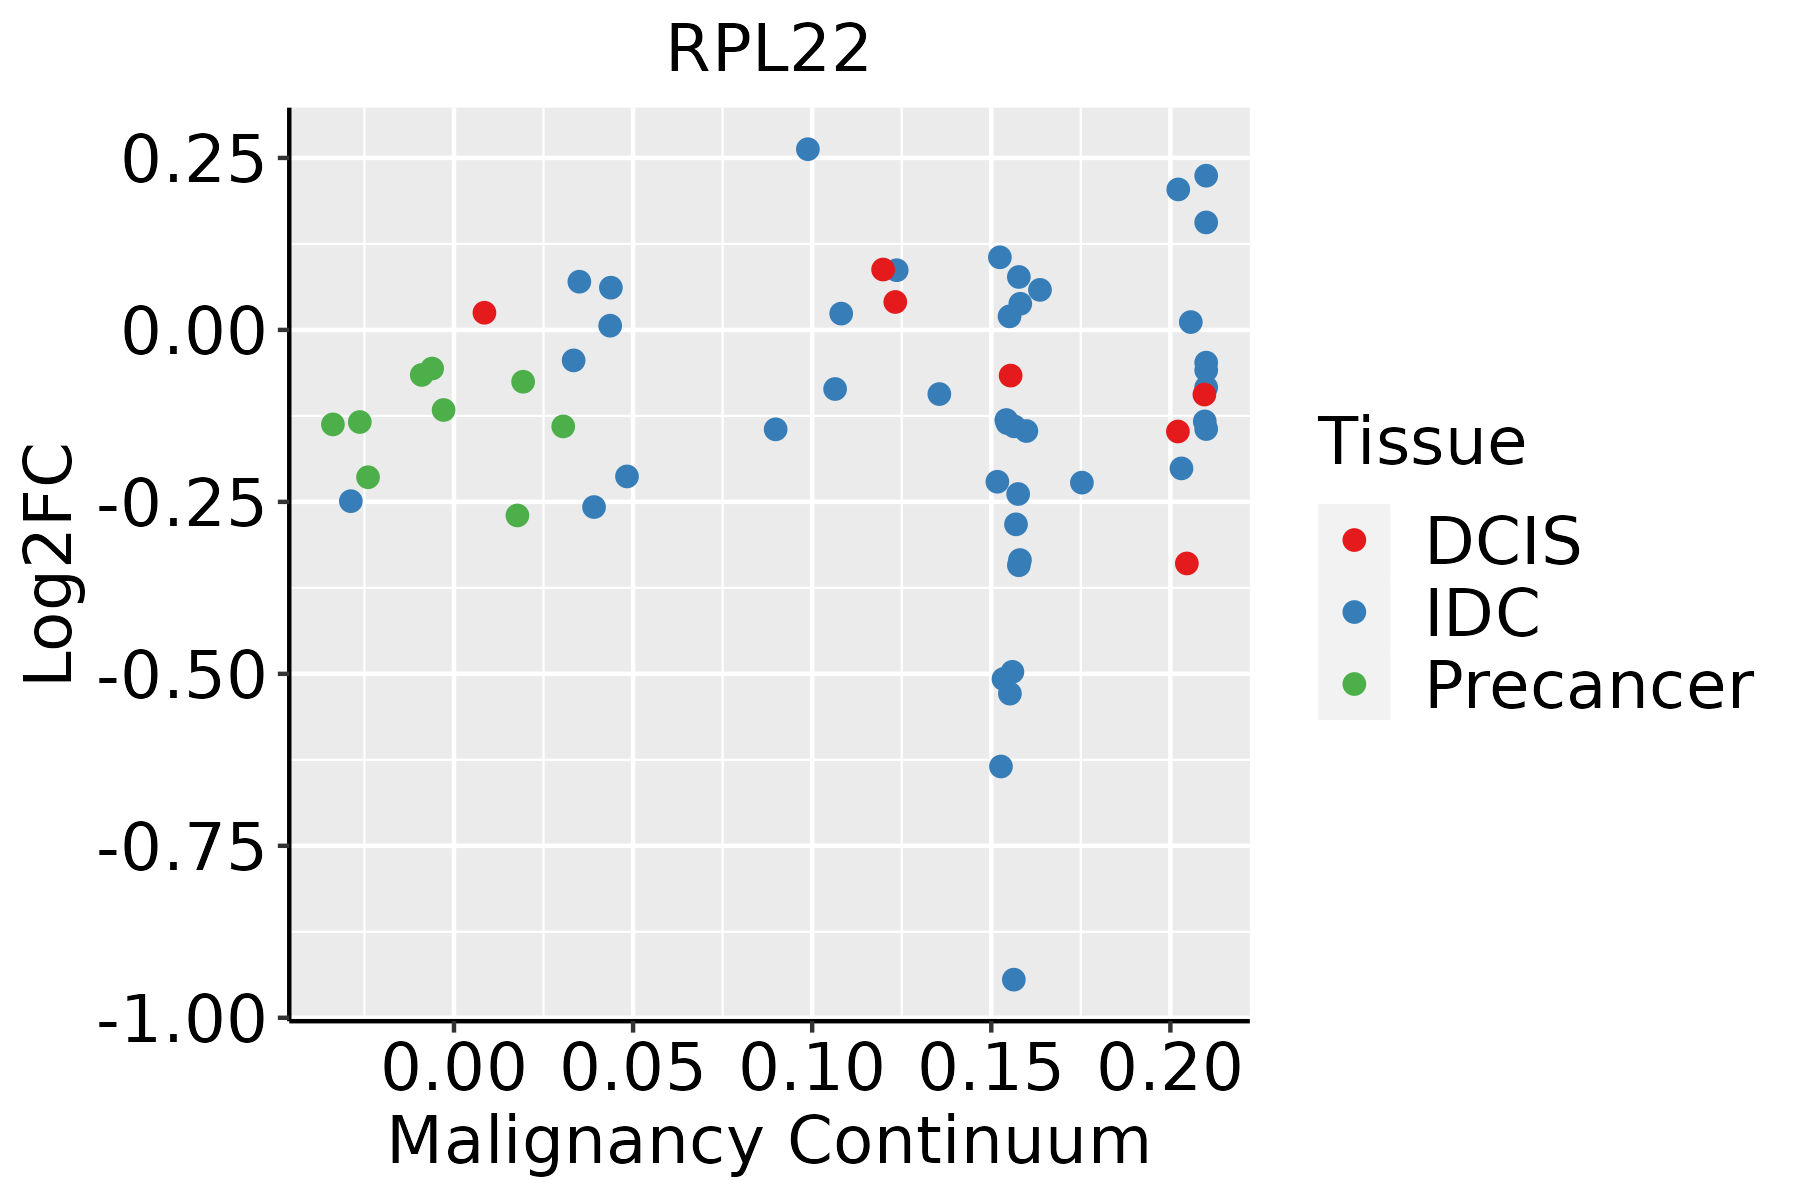 | IDC: Invasive ductal carcinoma |
| DCIS: Ductal carcinoma in situ | ||
| Precancer(BRCA1-mut): Precancerous lesion from BRCA1 mutation carriers | ||
| Cervix | 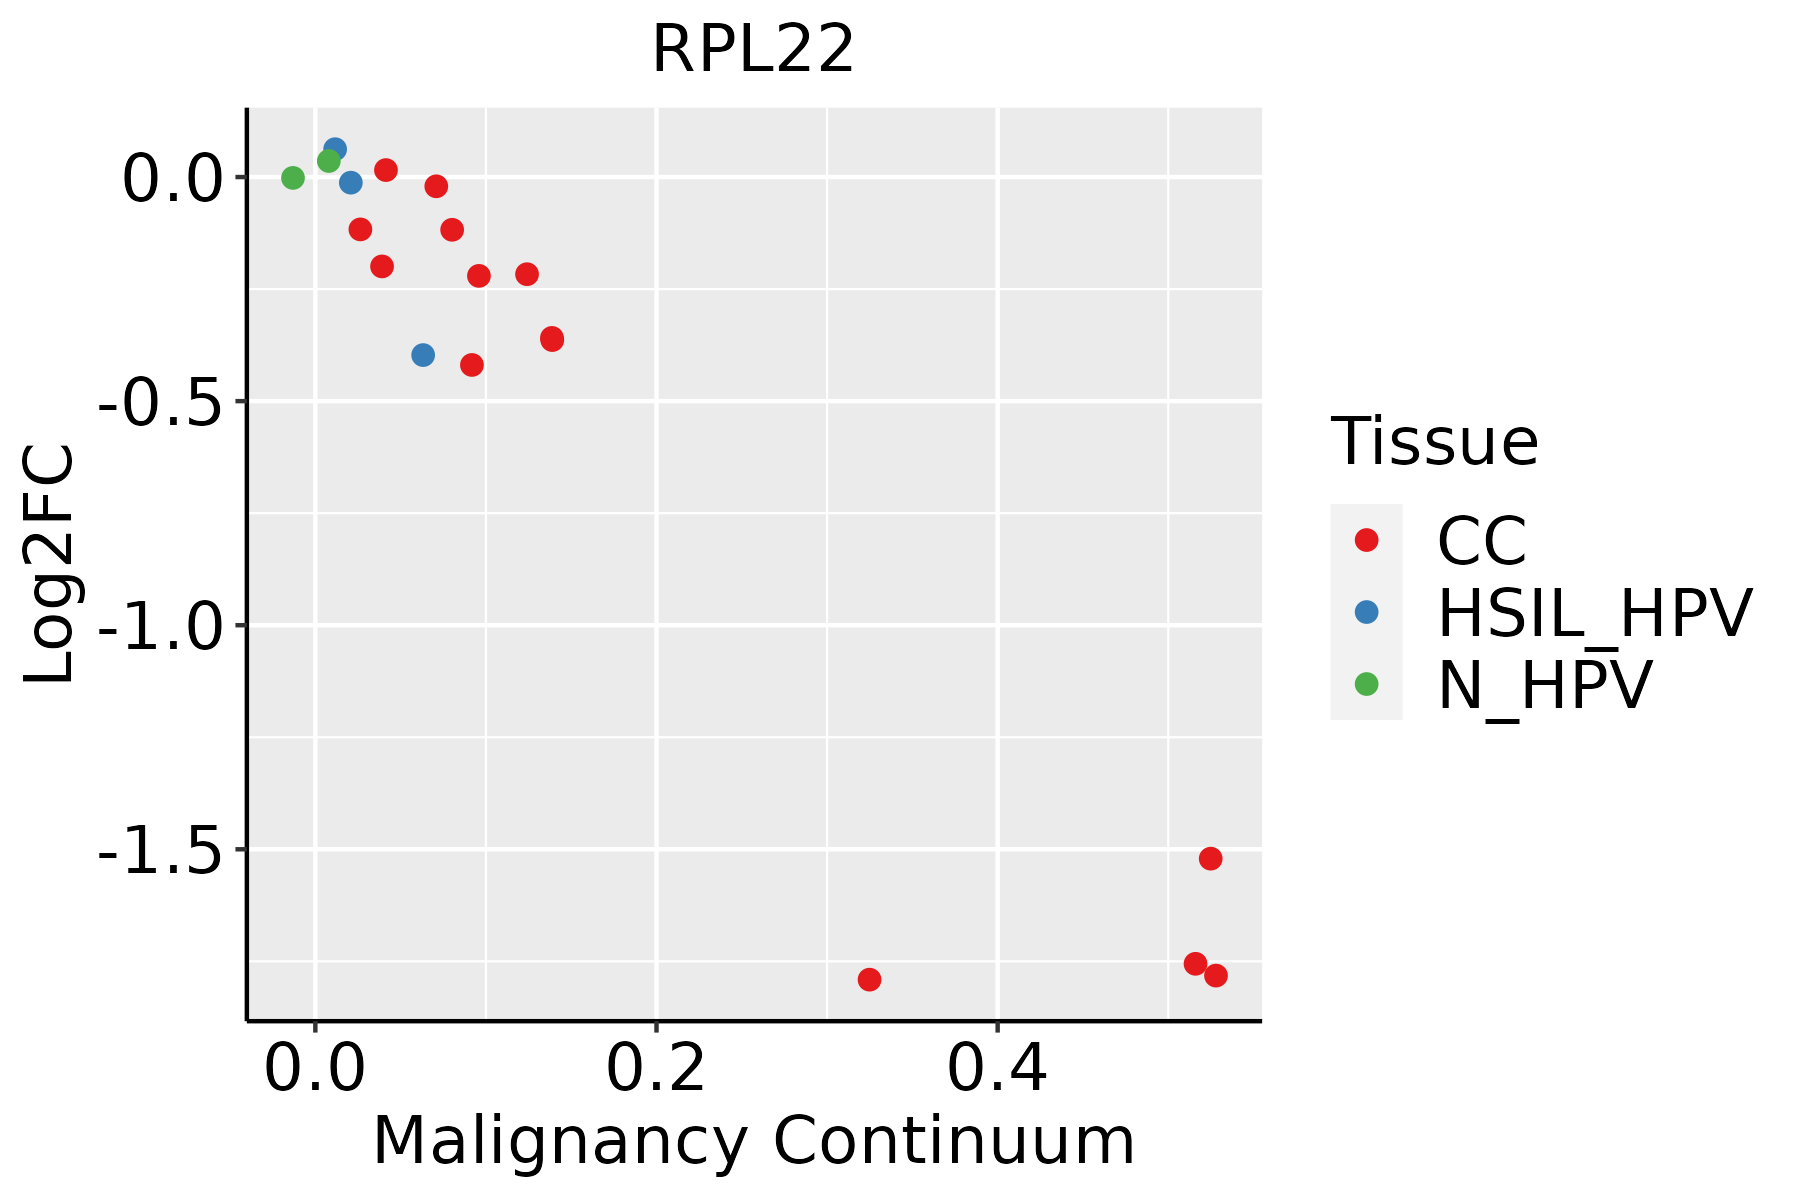 | CC: Cervix cancer |
| HSIL_HPV: HPV-infected high-grade squamous intraepithelial lesions | ||
| N_HPV: HPV-infected normal cervix | ||
| Colorectum (GSE201348) |  | FAP: Familial adenomatous polyposis |
| CRC: Colorectal cancer | ||
| Colorectum (HTA11) |  | AD: Adenomas |
| SER: Sessile serrated lesions | ||
| MSI-H: Microsatellite-high colorectal cancer | ||
| MSS: Microsatellite stable colorectal cancer | ||
| Endometrium |  | AEH: Atypical endometrial hyperplasia |
| EEC: Endometrioid Cancer | ||
| Esophagus | 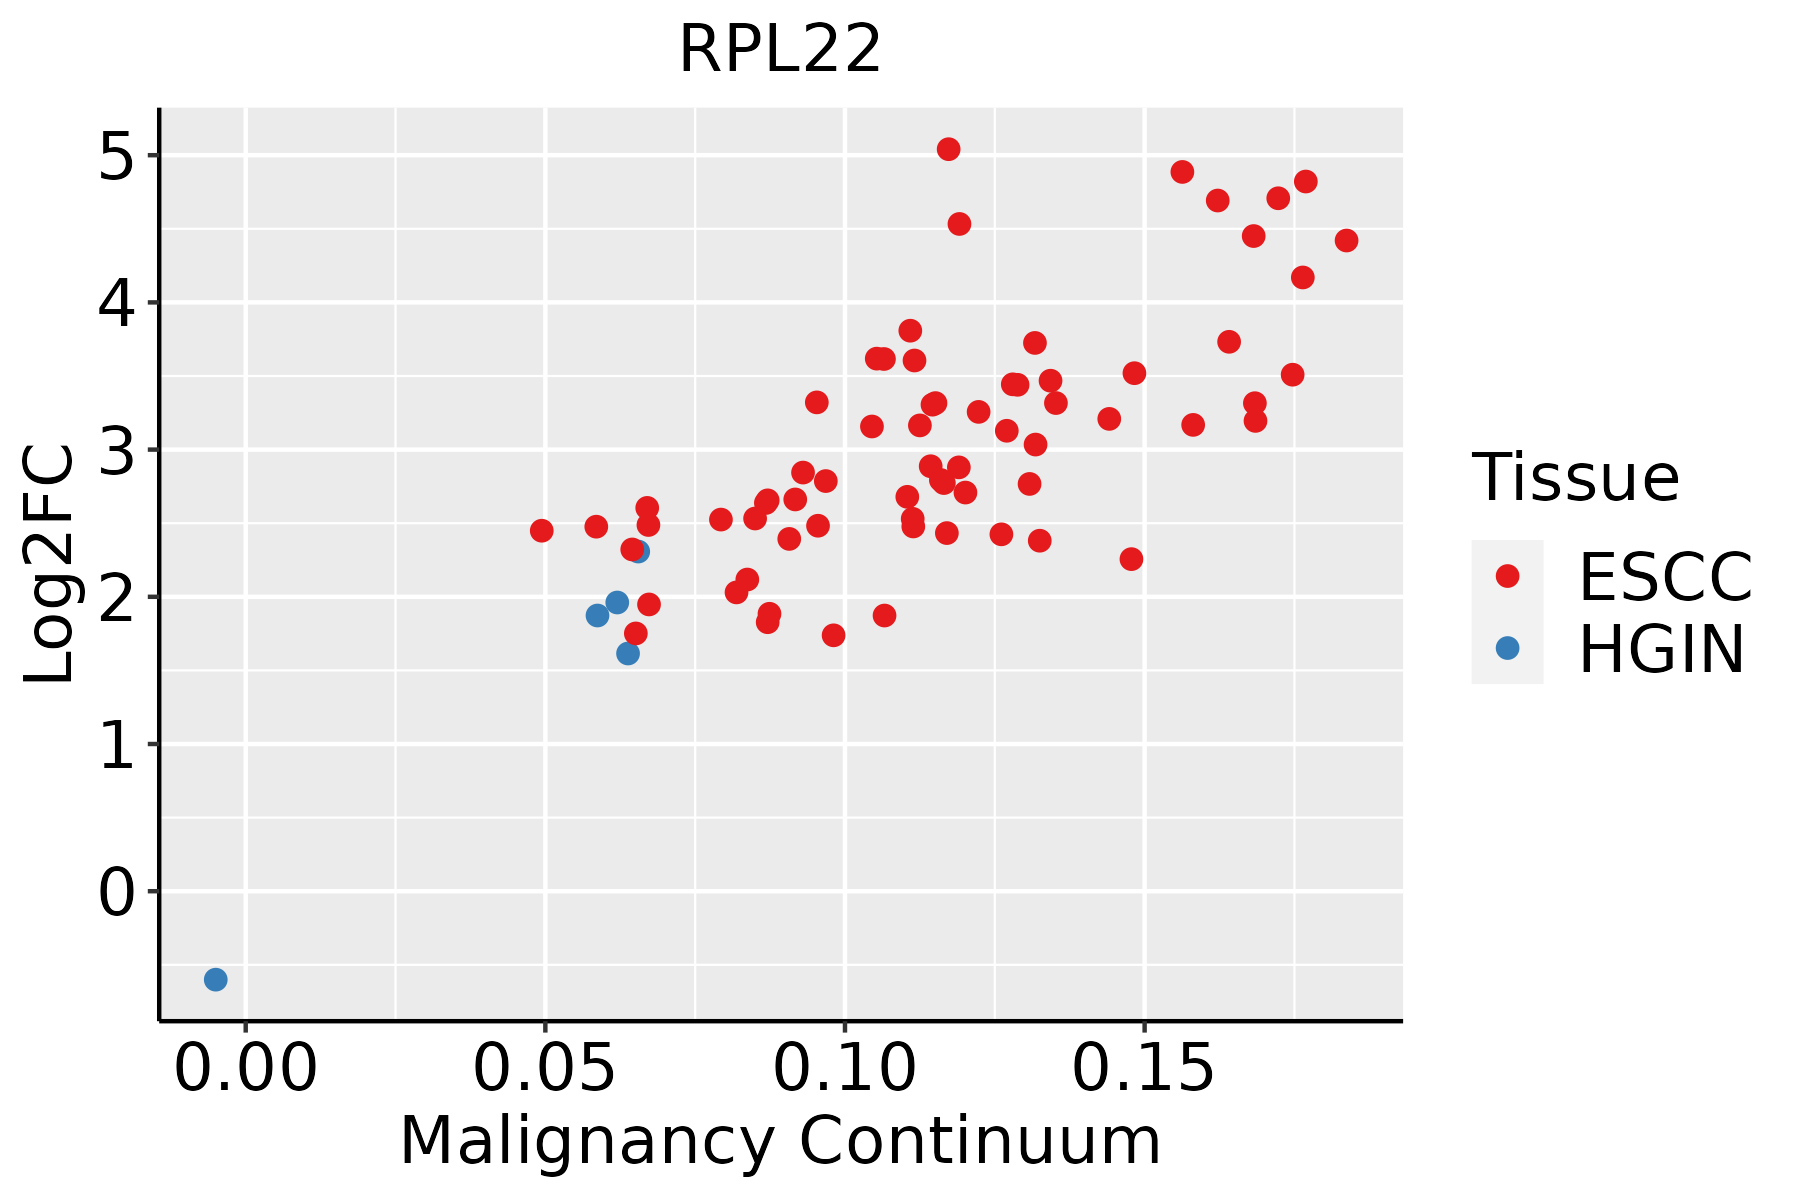 | ESCC: Esophageal squamous cell carcinoma |
| HGIN: High-grade intraepithelial neoplasias | ||
| LGIN: Low-grade intraepithelial neoplasias | ||
| Liver | 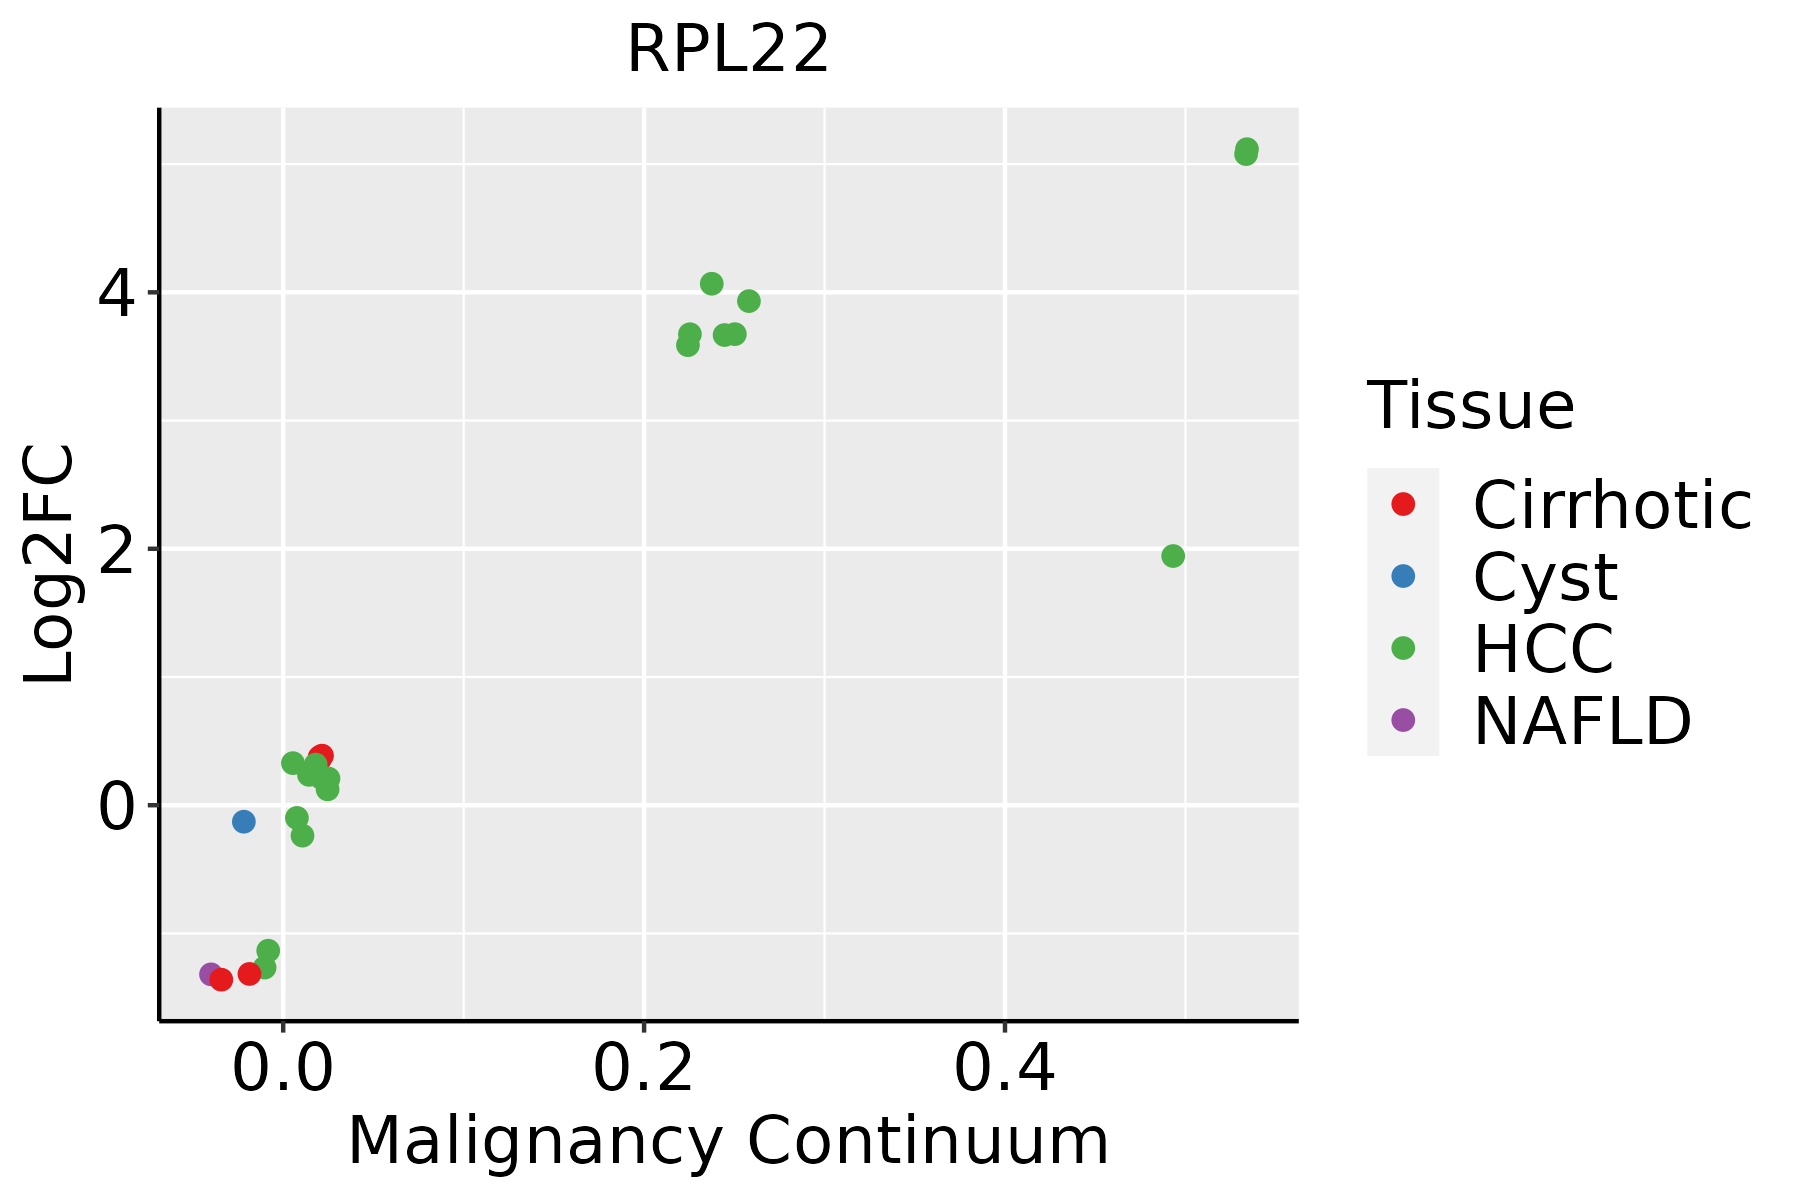 | HCC: Hepatocellular carcinoma |
| NAFLD: Non-alcoholic fatty liver disease | ||
| Lung | 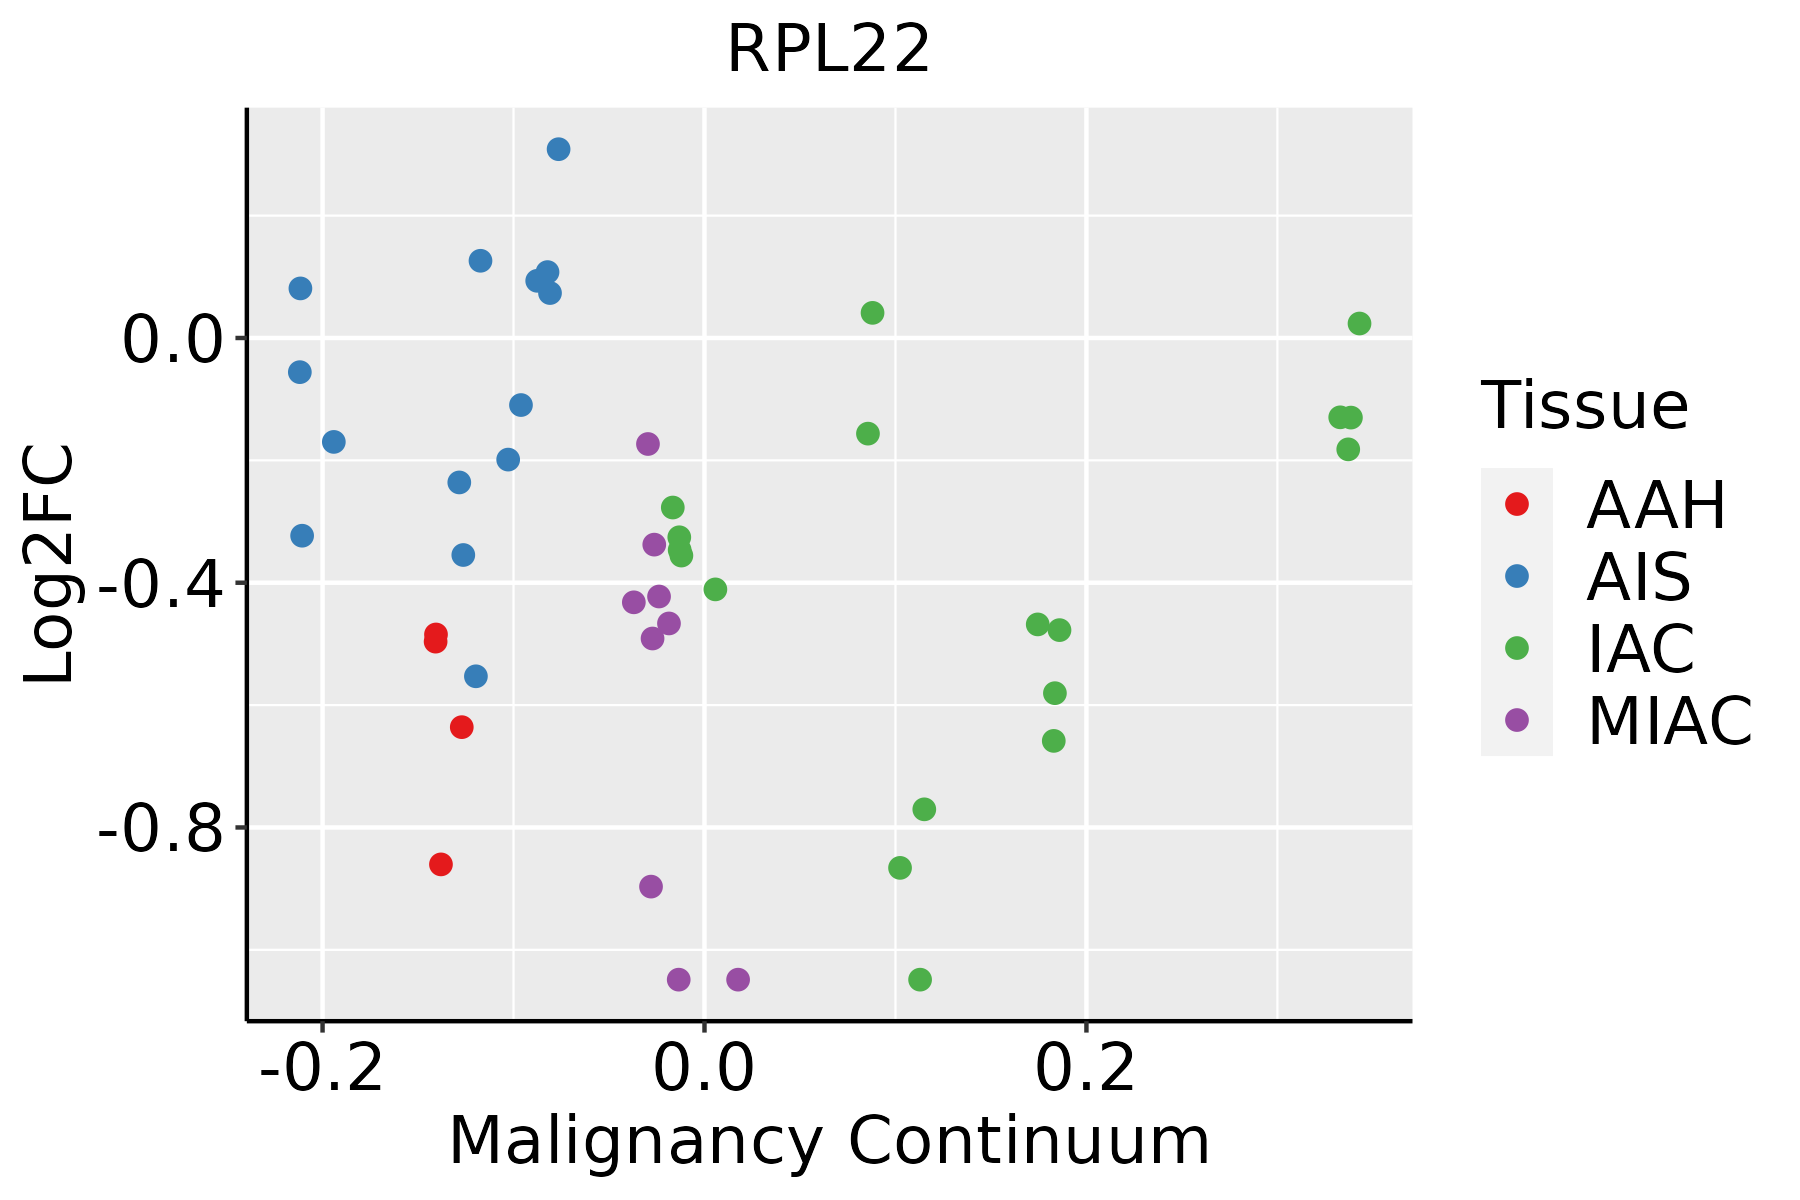 | AAH: Atypical adenomatous hyperplasia |
| AIS: Adenocarcinoma in situ | ||
| IAC: Invasive lung adenocarcinoma | ||
| MIA: Minimally invasive adenocarcinoma | ||
| Oral Cavity | 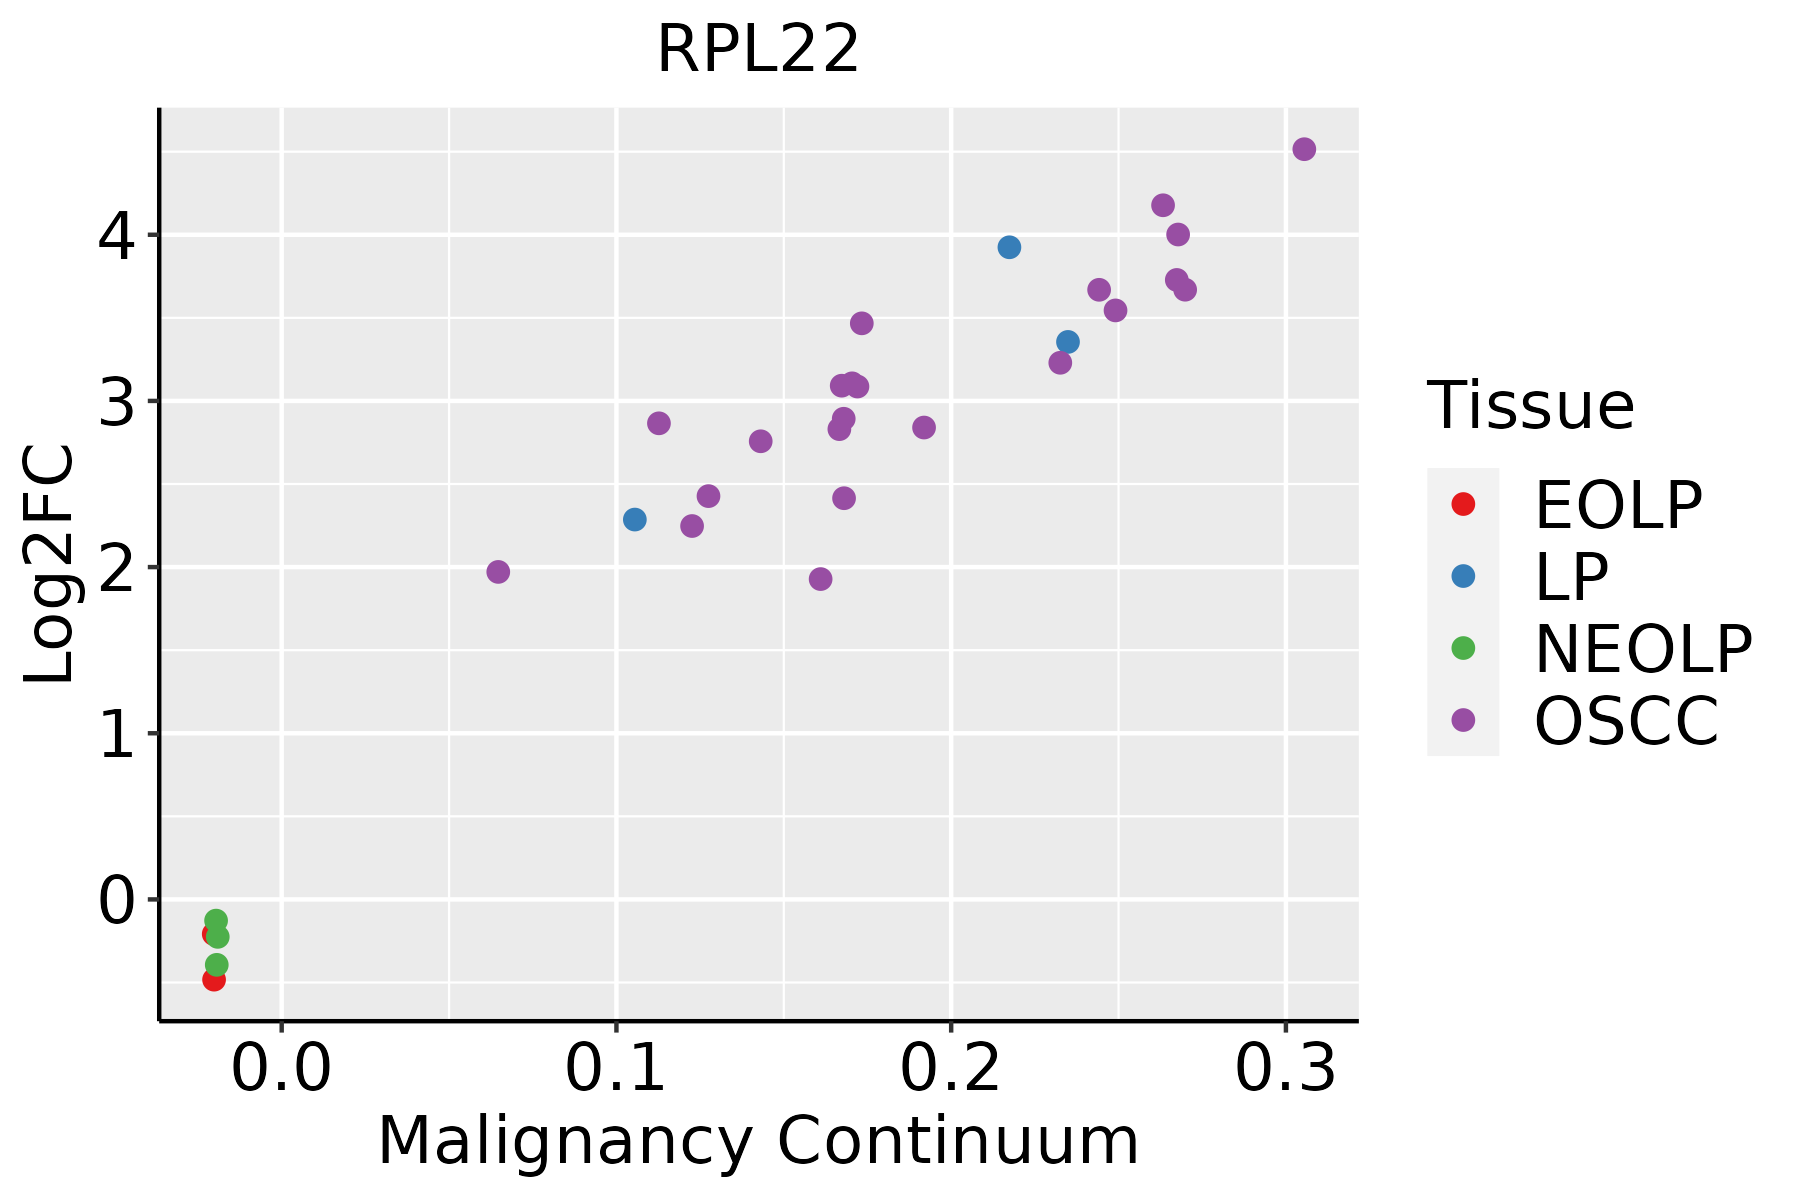 | EOLP: Erosive Oral lichen planus |
| LP: leukoplakia | ||
| NEOLP: Non-erosive oral lichen planus | ||
| OSCC: Oral squamous cell carcinoma | ||
| Prostate |  | BPH: Benign Prostatic Hyperplasia |
| Skin | 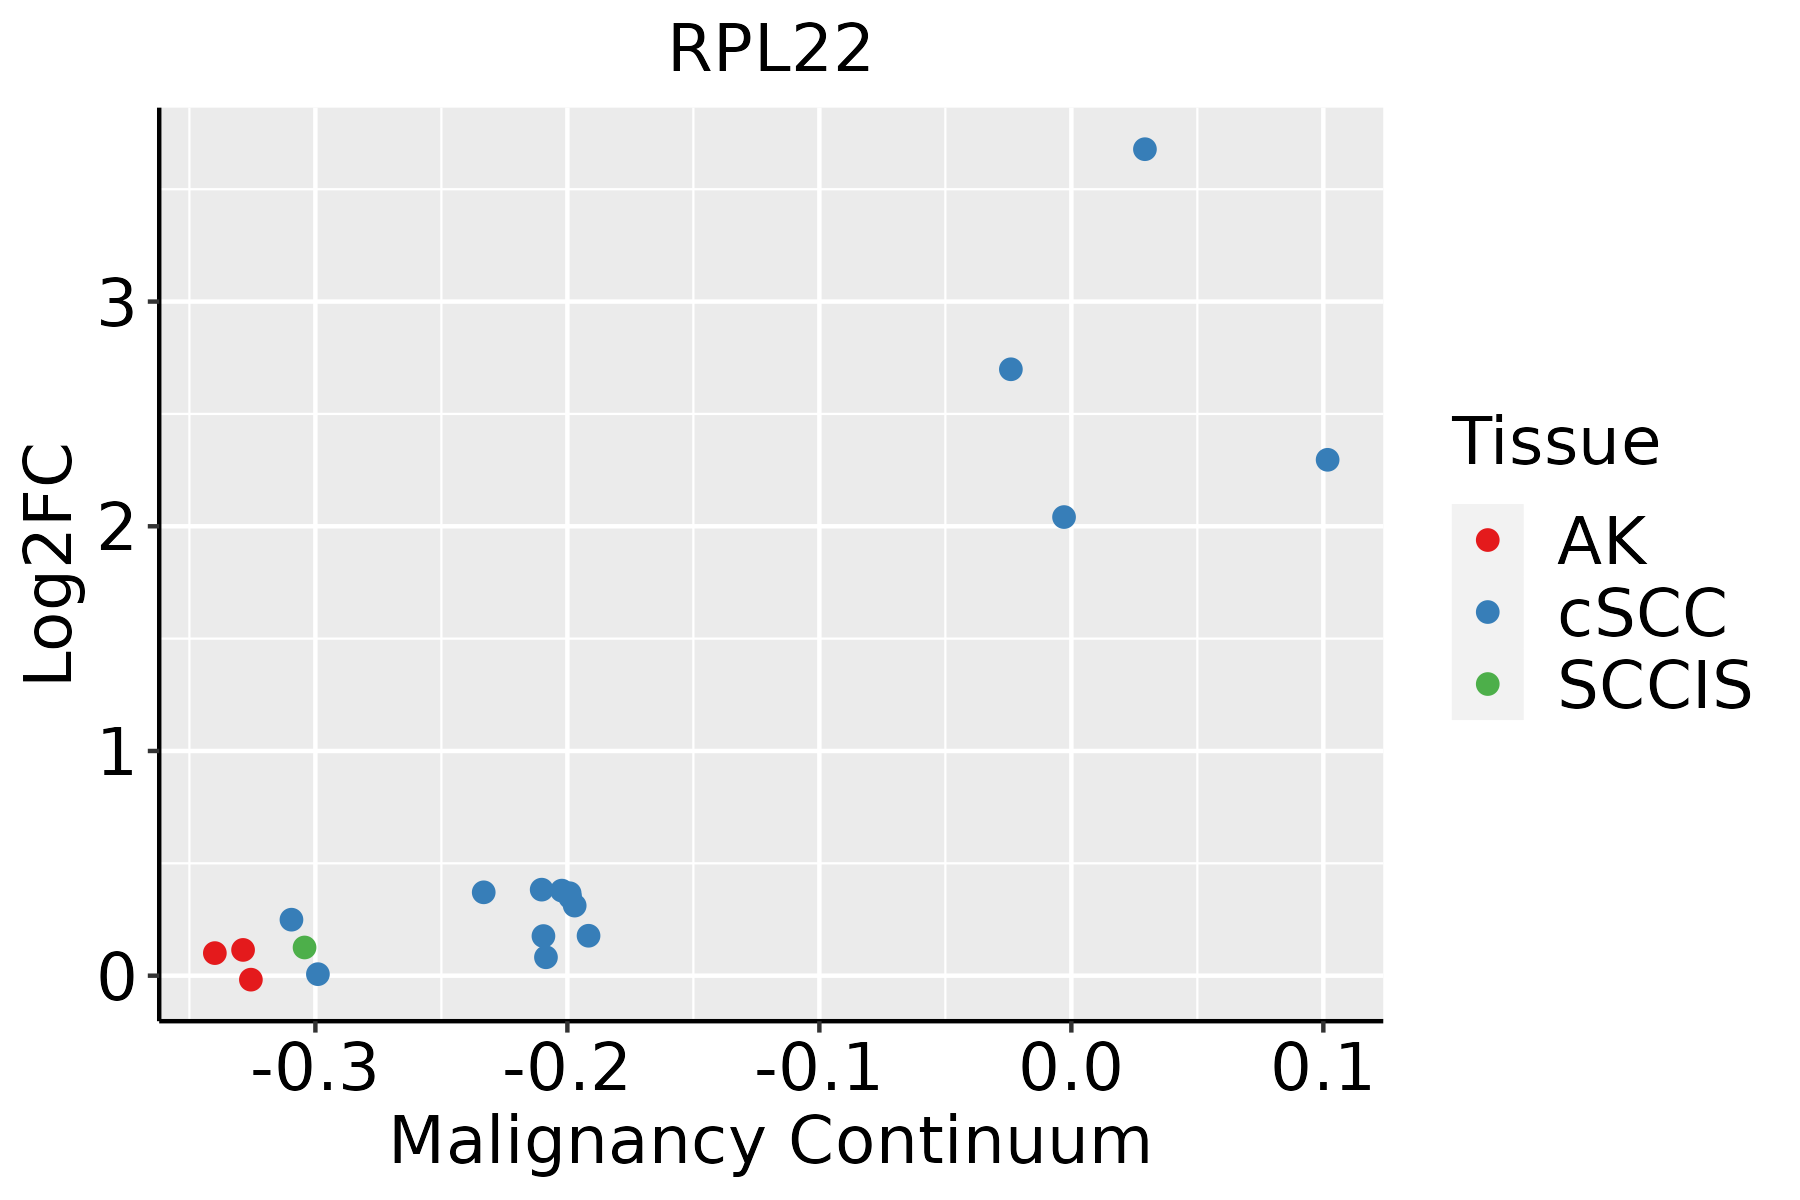 | AK: Actinic keratosis |
| cSCC: Cutaneous squamous cell carcinoma | ||
| SCCIS:squamous cell carcinoma in situ | ||
| Thyroid | 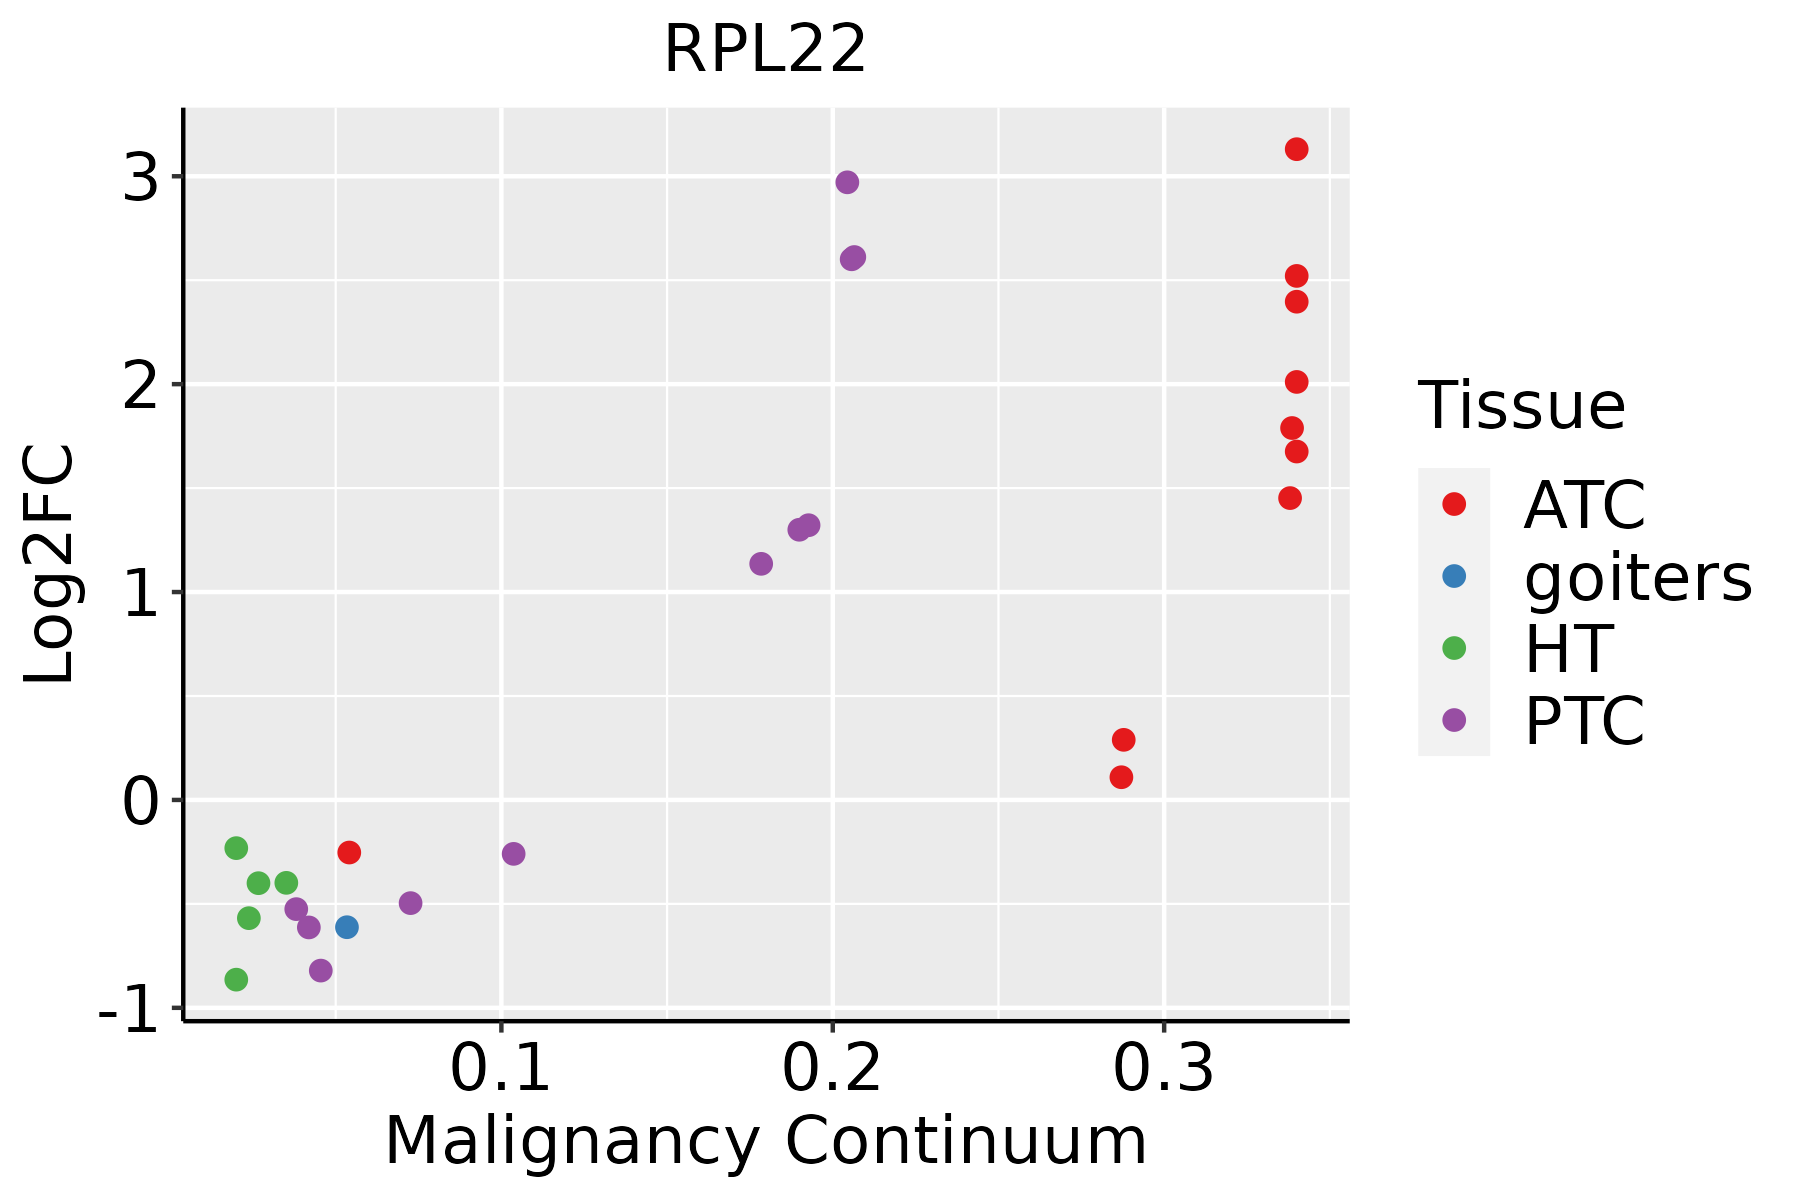 | ATC: Anaplastic thyroid cancer |
| HT: Hashimoto's thyroiditis | ||
| PTC: Papillary thyroid cancer |
| ∗log2FC in expression of this searched gene in stem-like cells from each diseased tissue sample relative to stem-like cells in normal samples in each tissue plotted against the malignancy continuum. Samples are colored based on if they are from different disease stage. |
Top |
Malignant transformation related pathway analysis |
| Find out the enriched GO biological processes and KEGG pathways involved in transition from healthy to precancer to cancer |
| Tissue | Disease Stage | Enriched GO biological Processes |
| Colorectum | AD |  |
| Colorectum | SER |  |
| Colorectum | MSS |  |
| Colorectum | MSI-H |  |
| Colorectum | FAP |  |
| ∗Top 15 enriched GO BP terms are showed in the bar plot of each disease state in each tissue. Each row represents a significant GO biological process which is colored according to the -log10(p.adjust). |
| Page: 1 2 3 4 5 6 7 8 9 |
| GO ID | Tissue | Disease Stage | Description | Gene Ratio | Bg Ratio | pvalue | p.adjust | Count |
| GO:00021819 | Breast | Precancer | cytoplasmic translation | 80/1080 | 148/18723 | 1.59e-59 | 8.54e-56 | 80 |
| GO:00064179 | Breast | Precancer | regulation of translation | 67/1080 | 468/18723 | 4.71e-12 | 7.64e-10 | 67 |
| GO:00421107 | Breast | Precancer | T cell activation | 52/1080 | 487/18723 | 1.37e-05 | 3.42e-04 | 52 |
| GO:19031313 | Breast | Precancer | mononuclear cell differentiation | 43/1080 | 426/18723 | 2.61e-04 | 3.84e-03 | 43 |
| GO:0030098 | Breast | Precancer | lymphocyte differentiation | 36/1080 | 374/18723 | 1.85e-03 | 1.81e-02 | 36 |
| GO:0030217 | Breast | Precancer | T cell differentiation | 26/1080 | 257/18723 | 3.89e-03 | 3.10e-02 | 26 |
| GO:000218114 | Breast | IDC | cytoplasmic translation | 82/1434 | 148/18723 | 2.60e-52 | 1.48e-48 | 82 |
| GO:000641714 | Breast | IDC | regulation of translation | 74/1434 | 468/18723 | 1.67e-09 | 1.53e-07 | 74 |
| GO:004211012 | Breast | IDC | T cell activation | 64/1434 | 487/18723 | 1.49e-05 | 3.77e-04 | 64 |
| GO:190313111 | Breast | IDC | mononuclear cell differentiation | 51/1434 | 426/18723 | 9.81e-04 | 1.11e-02 | 51 |
| GO:000218124 | Breast | DCIS | cytoplasmic translation | 82/1390 | 148/18723 | 2.21e-53 | 1.25e-49 | 82 |
| GO:000641724 | Breast | DCIS | regulation of translation | 72/1390 | 468/18723 | 2.46e-09 | 2.17e-07 | 72 |
| GO:004211021 | Breast | DCIS | T cell activation | 65/1390 | 487/18723 | 2.78e-06 | 9.42e-05 | 65 |
| GO:19031312 | Breast | DCIS | mononuclear cell differentiation | 51/1390 | 426/18723 | 4.88e-04 | 6.40e-03 | 51 |
| GO:000218110 | Cervix | CC | cytoplasmic translation | 96/2311 | 148/18723 | 4.87e-51 | 2.91e-47 | 96 |
| GO:00421108 | Cervix | CC | T cell activation | 107/2311 | 487/18723 | 1.24e-09 | 1.46e-07 | 107 |
| GO:000641710 | Cervix | CC | regulation of translation | 89/2311 | 468/18723 | 1.86e-05 | 3.46e-04 | 89 |
| GO:00302173 | Cervix | CC | T cell differentiation | 51/2311 | 257/18723 | 3.81e-04 | 3.89e-03 | 51 |
| GO:19031314 | Cervix | CC | mononuclear cell differentiation | 76/2311 | 426/18723 | 5.66e-04 | 5.42e-03 | 76 |
| GO:00300981 | Cervix | CC | lymphocyte differentiation | 63/2311 | 374/18723 | 6.21e-03 | 3.52e-02 | 63 |
| Page: 1 2 3 4 5 6 7 8 |
| Pathway ID | Tissue | Disease Stage | Description | Gene Ratio | Bg Ratio | pvalue | p.adjust | qvalue | Count |
| hsa0301018 | Breast | Precancer | Ribosome | 80/684 | 167/8465 | 7.33e-44 | 2.32e-41 | 1.77e-41 | 80 |
| hsa0517118 | Breast | Precancer | Coronavirus disease - COVID-19 | 81/684 | 232/8465 | 3.74e-32 | 2.36e-30 | 1.81e-30 | 81 |
| hsa0301019 | Breast | Precancer | Ribosome | 80/684 | 167/8465 | 7.33e-44 | 2.32e-41 | 1.77e-41 | 80 |
| hsa0517119 | Breast | Precancer | Coronavirus disease - COVID-19 | 81/684 | 232/8465 | 3.74e-32 | 2.36e-30 | 1.81e-30 | 81 |
| hsa0301024 | Breast | IDC | Ribosome | 83/867 | 167/8465 | 6.07e-39 | 9.87e-37 | 7.38e-37 | 83 |
| hsa0517124 | Breast | IDC | Coronavirus disease - COVID-19 | 86/867 | 232/8465 | 1.50e-28 | 9.72e-27 | 7.27e-27 | 86 |
| hsa0301034 | Breast | IDC | Ribosome | 83/867 | 167/8465 | 6.07e-39 | 9.87e-37 | 7.38e-37 | 83 |
| hsa0517134 | Breast | IDC | Coronavirus disease - COVID-19 | 86/867 | 232/8465 | 1.50e-28 | 9.72e-27 | 7.27e-27 | 86 |
| hsa0301044 | Breast | DCIS | Ribosome | 82/846 | 167/8465 | 8.69e-39 | 1.40e-36 | 1.03e-36 | 82 |
| hsa0517144 | Breast | DCIS | Coronavirus disease - COVID-19 | 86/846 | 232/8465 | 2.42e-29 | 1.56e-27 | 1.15e-27 | 86 |
| hsa0301054 | Breast | DCIS | Ribosome | 82/846 | 167/8465 | 8.69e-39 | 1.40e-36 | 1.03e-36 | 82 |
| hsa0517154 | Breast | DCIS | Coronavirus disease - COVID-19 | 86/846 | 232/8465 | 2.42e-29 | 1.56e-27 | 1.15e-27 | 86 |
| hsa0517120 | Cervix | CC | Coronavirus disease - COVID-19 | 111/1267 | 232/8465 | 1.82e-33 | 5.90e-31 | 3.49e-31 | 111 |
| hsa0301020 | Cervix | CC | Ribosome | 85/1267 | 167/8465 | 3.17e-28 | 5.14e-26 | 3.04e-26 | 85 |
| hsa05171110 | Cervix | CC | Coronavirus disease - COVID-19 | 111/1267 | 232/8465 | 1.82e-33 | 5.90e-31 | 3.49e-31 | 111 |
| hsa03010110 | Cervix | CC | Ribosome | 85/1267 | 167/8465 | 3.17e-28 | 5.14e-26 | 3.04e-26 | 85 |
| hsa0301025 | Cervix | HSIL_HPV | Ribosome | 80/459 | 167/8465 | 9.61e-58 | 2.82e-55 | 2.28e-55 | 80 |
| hsa0517125 | Cervix | HSIL_HPV | Coronavirus disease - COVID-19 | 91/459 | 232/8465 | 2.14e-56 | 3.13e-54 | 2.53e-54 | 91 |
| hsa0301035 | Cervix | HSIL_HPV | Ribosome | 80/459 | 167/8465 | 9.61e-58 | 2.82e-55 | 2.28e-55 | 80 |
| hsa0517135 | Cervix | HSIL_HPV | Coronavirus disease - COVID-19 | 91/459 | 232/8465 | 2.14e-56 | 3.13e-54 | 2.53e-54 | 91 |
| Page: 1 2 3 4 5 6 |
Top |
Cell-cell communication analysis |
| Identification of potential cell-cell interactions between two cell types and their ligand-receptor pairs for different disease states |
| Ligand | Receptor | LRpair | Pathway | Tissue | Disease Stage |
| Page: 1 |
Top |
Single-cell gene regulatory network inference analysis |
| Find out the significant the regulons (TFs) and the target genes of each regulon across cell types for different disease states |
| TF | Cell Type | Tissue | Disease Stage | Target Gene | RSS | Regulon Activity |
| ∗The dot plots of a searched regulon are shown for all cell subpopulations in each disease state of each tissue based on the regulon specific score inferred using pySCENIC and by calculating the average expression. |
| Page: 1 |
Top |
Somatic mutation of malignant transformation related genes |
| Annotation of somatic variants for genes involved in malignant transformation |
| Hugo Symbol | Variant Class | Variant Classification | dbSNP RS | HGVSc | HGVSp | HGVSp Short | SWISSPROT | BIOTYPE | SIFT | PolyPhen | Tumor Sample Barcode | Tissue | Histology | Sex | Age | Stage | Therapy Types | Drugs | Outcome |
| RPL22 | SNV | Missense_Mutation | c.301N>T | p.Arg101Cys | p.R101C | P35268 | protein_coding | deleterious(0.05) | benign(0.018) | TCGA-AA-3713-01 | Colorectum | colon adenocarcinoma | Male | >=65 | III/IV | Chemotherapy | 5-fluorouracil | PR | |
| RPL22 | SNV | Missense_Mutation | novel | c.268N>C | p.Tyr90His | p.Y90H | P35268 | protein_coding | tolerated(0.06) | benign(0.007) | TCGA-CA-6717-01 | Colorectum | colon adenocarcinoma | Male | <65 | I/II | Chemotherapy | oxaliplatin | CR |
| RPL22 | insertion | Frame_Shift_Ins | rs777006564 | c.44dupA | p.Lys16GlufsTer9 | p.K16Efs*9 | P35268 | protein_coding | TCGA-CM-5861-01 | Colorectum | colon adenocarcinoma | Female | <65 | I/II | Unknown | Unknown | PD | ||
| RPL22 | insertion | Frame_Shift_Ins | rs777006564 | c.44dupA | p.Lys16GlufsTer9 | p.K16Efs*9 | P35268 | protein_coding | TCGA-CM-6165-01 | Colorectum | colon adenocarcinoma | Male | >=65 | I/II | Unknown | Unknown | SD | ||
| RPL22 | insertion | Frame_Shift_Ins | rs752855455 | c.35_36insG | p.Lys13GlnfsTer12 | p.K13Qfs*12 | P35268 | protein_coding | TCGA-NH-A5IV-01 | Colorectum | colon adenocarcinoma | Female | >=65 | I/II | Unknown | Unknown | SD | ||
| RPL22 | SNV | Missense_Mutation | novel | c.361N>A | p.Glu121Lys | p.E121K | P35268 | protein_coding | tolerated(0.09) | probably_damaging(0.974) | TCGA-A5-A2K5-01 | Endometrium | uterine corpus endometrioid carcinoma | Female | >=65 | I/II | Unknown | Unknown | SD |
| RPL22 | SNV | Missense_Mutation | c.266N>C | p.Lys89Thr | p.K89T | P35268 | protein_coding | deleterious(0.02) | benign(0.012) | TCGA-AX-A05Z-01 | Endometrium | uterine corpus endometrioid carcinoma | Female | <65 | III/IV | Chemotherapy | adriamycin | SD | |
| RPL22 | SNV | Missense_Mutation | c.264N>C | p.Lys88Asn | p.K88N | P35268 | protein_coding | deleterious(0.02) | probably_damaging(0.924) | TCGA-AX-A0J0-01 | Endometrium | uterine corpus endometrioid carcinoma | Female | <65 | I/II | Unknown | Unknown | SD | |
| RPL22 | SNV | Missense_Mutation | c.116T>A | p.Phe39Tyr | p.F39Y | P35268 | protein_coding | deleterious(0.02) | probably_damaging(0.926) | TCGA-B5-A0JY-01 | Endometrium | uterine corpus endometrioid carcinoma | Female | <65 | III/IV | Chemotherapy | doxorubicin | SD | |
| RPL22 | SNV | Missense_Mutation | c.302G>A | p.Arg101His | p.R101H | P35268 | protein_coding | tolerated(0.1) | benign(0.003) | TCGA-B5-A11E-01 | Endometrium | uterine corpus endometrioid carcinoma | Female | <65 | I/II | Unknown | Unknown | SD |
| Page: 1 2 3 |
Top |
Related drugs of malignant transformation related genes |
| Identification of chemicals and drugs interact with genes involved in malignant transfromation |
| (DGIdb 4.0) |
| Entrez ID | Symbol | Category | Interaction Types | Drug Claim Name | Drug Name | PMIDs |
| Page: 1 |

Copyright 2023-Present -The University of Texas Health Science Center at Houston |