
|
|||||
|
 | |
| |
| |
| |
| |
| |
|
Gene: RPH3AL |
Gene summary for RPH3AL |
| Gene information | Species | Human | Gene symbol | RPH3AL | Gene ID | 9501 |
| Gene name | rabphilin 3A like (without C2 domains) | |
| Gene Alias | NOC2 | |
| Cytomap | 17p13.3 | |
| Gene Type | protein-coding | GO ID | GO:0006810 | UniProtAcc | Q9UNE2 |
Top |
Malignant transformation analysis |
| Identification of the aberrant gene expression in precancerous and cancerous lesions by comparing the gene expression of stem-like cells in diseased tissues with normal stem cells |
| Entrez ID | Symbol | Replicates | Species | Organ | Tissue | Adj P-value | Log2FC | Malignancy |
| 9501 | RPH3AL | LZE24T | Human | Esophagus | ESCC | 1.29e-03 | 1.11e-01 | 0.0596 |
| 9501 | RPH3AL | P4T-E | Human | Esophagus | ESCC | 7.93e-03 | 1.32e-01 | 0.1323 |
| 9501 | RPH3AL | P20T-E | Human | Esophagus | ESCC | 5.39e-08 | 2.33e-01 | 0.1124 |
| 9501 | RPH3AL | P27T-E | Human | Esophagus | ESCC | 9.21e-25 | 5.11e-01 | 0.1055 |
| 9501 | RPH3AL | P31T-E | Human | Esophagus | ESCC | 1.72e-19 | 2.72e-01 | 0.1251 |
| 9501 | RPH3AL | P37T-E | Human | Esophagus | ESCC | 2.86e-04 | 6.97e-02 | 0.1371 |
| 9501 | RPH3AL | P42T-E | Human | Esophagus | ESCC | 1.50e-03 | 1.51e-01 | 0.1175 |
| 9501 | RPH3AL | P62T-E | Human | Esophagus | ESCC | 1.72e-07 | 1.60e-01 | 0.1302 |
| 9501 | RPH3AL | P65T-E | Human | Esophagus | ESCC | 3.32e-12 | 2.60e-01 | 0.0978 |
| 9501 | RPH3AL | P74T-E | Human | Esophagus | ESCC | 1.10e-19 | 5.60e-01 | 0.1479 |
| 9501 | RPH3AL | P75T-E | Human | Esophagus | ESCC | 2.17e-47 | 8.15e-01 | 0.1125 |
| 9501 | RPH3AL | P76T-E | Human | Esophagus | ESCC | 2.04e-02 | 4.84e-02 | 0.1207 |
| 9501 | RPH3AL | P79T-E | Human | Esophagus | ESCC | 2.53e-03 | 1.17e-01 | 0.1154 |
| 9501 | RPH3AL | P80T-E | Human | Esophagus | ESCC | 3.46e-03 | 1.36e-01 | 0.155 |
| 9501 | RPH3AL | P82T-E | Human | Esophagus | ESCC | 1.10e-04 | 2.82e-01 | 0.1072 |
| 9501 | RPH3AL | P89T-E | Human | Esophagus | ESCC | 1.54e-02 | 1.79e-01 | 0.1752 |
| 9501 | RPH3AL | P128T-E | Human | Esophagus | ESCC | 2.66e-33 | 8.55e-01 | 0.1241 |
| 9501 | RPH3AL | P130T-E | Human | Esophagus | ESCC | 7.62e-40 | 6.88e-01 | 0.1676 |
| 9501 | RPH3AL | HTA12-26-1 | Human | Pancreas | PDAC | 1.04e-10 | 6.23e-01 | 0.3728 |
| 9501 | RPH3AL | HTA12-29-1 | Human | Pancreas | PDAC | 1.05e-18 | 5.46e-01 | 0.3722 |
| Page: 1 |
| Tissue | Expression Dynamics | Abbreviation |
| Esophagus | 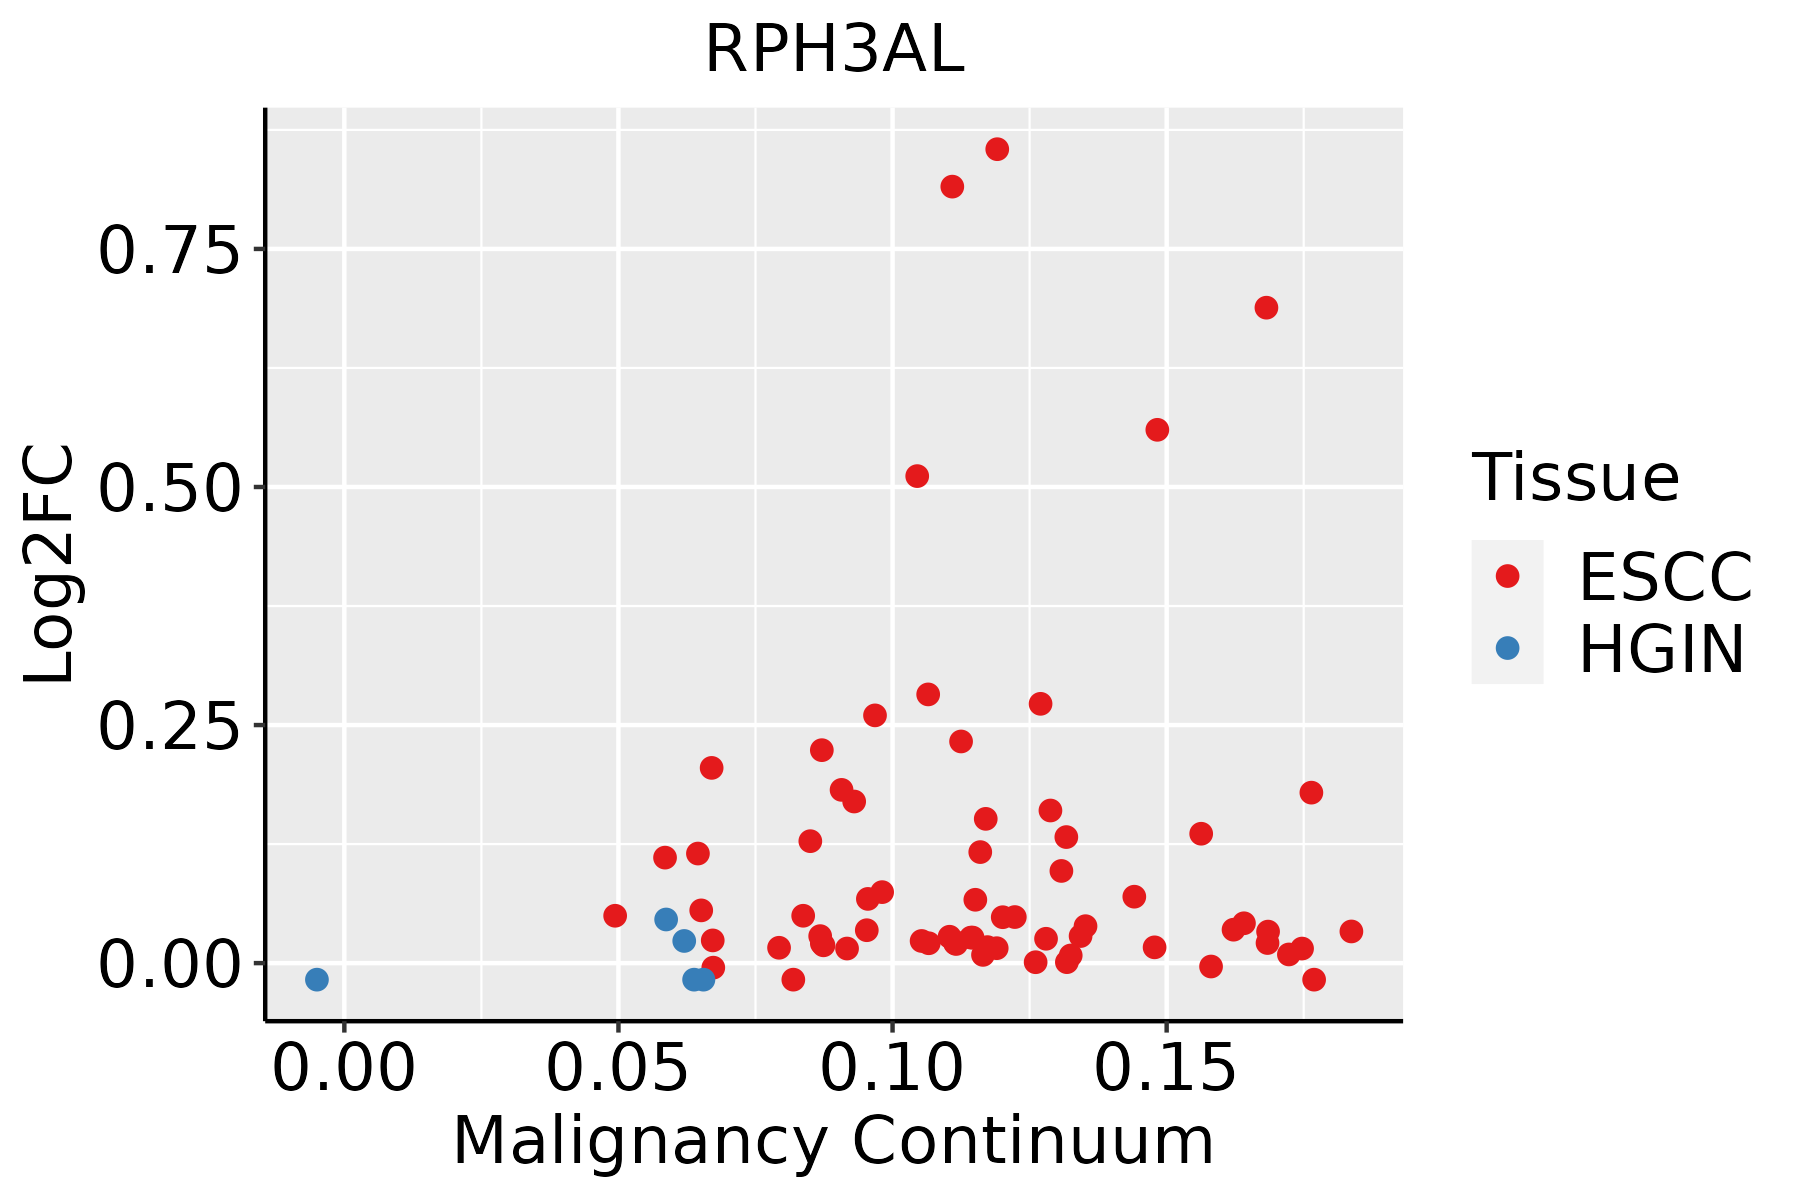 | ESCC: Esophageal squamous cell carcinoma |
| HGIN: High-grade intraepithelial neoplasias | ||
| LGIN: Low-grade intraepithelial neoplasias |
| ∗log2FC in expression of this searched gene in stem-like cells from each diseased tissue sample relative to stem-like cells in normal samples in each tissue plotted against the malignancy continuum. Samples are colored based on if they are from different disease stage. |
Top |
Malignant transformation related pathway analysis |
| Find out the enriched GO biological processes and KEGG pathways involved in transition from healthy to precancer to cancer |
| Tissue | Disease Stage | Enriched GO biological Processes |
| Colorectum | AD |  |
| Colorectum | SER |  |
| Colorectum | MSS |  |
| Colorectum | MSI-H |  |
| Colorectum | FAP |  |
| ∗Top 15 enriched GO BP terms are showed in the bar plot of each disease state in each tissue. Each row represents a significant GO biological process which is colored according to the -log10(p.adjust). |
| Page: 1 2 3 4 5 6 7 8 9 |
| GO ID | Tissue | Disease Stage | Description | Gene Ratio | Bg Ratio | pvalue | p.adjust | Count |
| GO:1904951111 | Esophagus | ESCC | positive regulation of establishment of protein localization | 216/8552 | 319/18723 | 1.01e-15 | 6.86e-14 | 216 |
| GO:0051222111 | Esophagus | ESCC | positive regulation of protein transport | 204/8552 | 303/18723 | 1.56e-14 | 8.38e-13 | 204 |
| GO:000941020 | Esophagus | ESCC | response to xenobiotic stimulus | 253/8552 | 462/18723 | 4.55e-05 | 3.58e-04 | 253 |
| GO:000930617 | Esophagus | ESCC | protein secretion | 190/8552 | 359/18723 | 3.22e-03 | 1.34e-02 | 190 |
| GO:003559217 | Esophagus | ESCC | establishment of protein localization to extracellular region | 190/8552 | 360/18723 | 3.77e-03 | 1.53e-02 | 190 |
| GO:007169210 | Esophagus | ESCC | protein localization to extracellular region | 193/8552 | 368/18723 | 5.01e-03 | 1.92e-02 | 193 |
| GO:005070810 | Esophagus | ESCC | regulation of protein secretion | 142/8552 | 268/18723 | 9.31e-03 | 3.24e-02 | 142 |
| GO:005071416 | Esophagus | ESCC | positive regulation of protein secretion | 76/8552 | 137/18723 | 1.32e-02 | 4.31e-02 | 76 |
| Page: 1 |
| Pathway ID | Tissue | Disease Stage | Description | Gene Ratio | Bg Ratio | pvalue | p.adjust | qvalue | Count |
| Page: 1 |
Top |
Cell-cell communication analysis |
| Identification of potential cell-cell interactions between two cell types and their ligand-receptor pairs for different disease states |
| Ligand | Receptor | LRpair | Pathway | Tissue | Disease Stage |
| Page: 1 |
Top |
Single-cell gene regulatory network inference analysis |
| Find out the significant the regulons (TFs) and the target genes of each regulon across cell types for different disease states |
| TF | Cell Type | Tissue | Disease Stage | Target Gene | RSS | Regulon Activity |
| ∗The dot plots of a searched regulon are shown for all cell subpopulations in each disease state of each tissue based on the regulon specific score inferred using pySCENIC and by calculating the average expression. |
| Page: 1 |
Top |
Somatic mutation of malignant transformation related genes |
| Annotation of somatic variants for genes involved in malignant transformation |
| Hugo Symbol | Variant Class | Variant Classification | dbSNP RS | HGVSc | HGVSp | HGVSp Short | SWISSPROT | BIOTYPE | SIFT | PolyPhen | Tumor Sample Barcode | Tissue | Histology | Sex | Age | Stage | Therapy Types | Drugs | Outcome |
| RPH3AL | SNV | Missense_Mutation | rs772719779 | c.580A>C | p.Thr194Pro | p.T194P | Q9UNE2 | protein_coding | tolerated(0.16) | benign(0.424) | TCGA-C8-A1HO-01 | Breast | breast invasive carcinoma | Female | <65 | III/IV | Chemotherapy | 5-fluorouracil | CR |
| RPH3AL | insertion | Nonsense_Mutation | novel | c.34_35insCAAATTAAAAAAAATTGCAAT | p.Gln12delinsProAsnTerLysLysLeuGlnTer | p.Q12delinsPN*KKLQ* | Q9UNE2 | protein_coding | TCGA-BH-A0B8-01 | Breast | breast invasive carcinoma | Female | <65 | I/II | Hormone Therapy | arimidex | SD | ||
| RPH3AL | SNV | Missense_Mutation | rs528287300 | c.560N>A | p.Arg187Gln | p.R187Q | Q9UNE2 | protein_coding | tolerated(0.79) | benign(0.001) | TCGA-C5-A8XJ-01 | Cervix | cervical & endocervical cancer | Female | >=65 | I/II | Chemotherapy | cisplatin | SD |
| RPH3AL | SNV | Missense_Mutation | rs867104080 | c.943N>A | p.Gly315Ser | p.G315S | Q9UNE2 | protein_coding | deleterious_low_confidence(0) | benign(0.001) | TCGA-EK-A2PG-01 | Cervix | cervical & endocervical cancer | Female | >=65 | I/II | Unknown | Unknown | SD |
| RPH3AL | SNV | Missense_Mutation | c.71N>A | p.Arg24Gln | p.R24Q | Q9UNE2 | protein_coding | deleterious(0.04) | possibly_damaging(0.765) | TCGA-A6-6141-01 | Colorectum | colon adenocarcinoma | Male | <65 | I/II | Chemotherapy | 5-fu | SD | |
| RPH3AL | SNV | Missense_Mutation | rs144718442 | c.452N>T | p.Ser151Leu | p.S151L | Q9UNE2 | protein_coding | deleterious(0.01) | probably_damaging(0.998) | TCGA-A5-A0G2-01 | Endometrium | uterine corpus endometrioid carcinoma | Female | <65 | III/IV | Unknown | Unknown | SD |
| RPH3AL | SNV | Missense_Mutation | novel | c.398N>A | p.Arg133Gln | p.R133Q | Q9UNE2 | protein_coding | tolerated(0.12) | benign(0.026) | TCGA-A5-A0G2-01 | Endometrium | uterine corpus endometrioid carcinoma | Female | <65 | III/IV | Unknown | Unknown | SD |
| RPH3AL | SNV | Missense_Mutation | novel | c.509N>A | p.Gly170Asp | p.G170D | Q9UNE2 | protein_coding | tolerated(0.34) | benign(0.015) | TCGA-A5-A1OF-01 | Endometrium | uterine corpus endometrioid carcinoma | Female | <65 | I/II | Unknown | Unknown | SD |
| RPH3AL | SNV | Missense_Mutation | rs147473081 | c.220N>A | p.Gly74Arg | p.G74R | Q9UNE2 | protein_coding | deleterious(0.02) | probably_damaging(0.99) | TCGA-A5-A2K5-01 | Endometrium | uterine corpus endometrioid carcinoma | Female | >=65 | I/II | Unknown | Unknown | SD |
| RPH3AL | SNV | Missense_Mutation | novel | c.323N>T | p.Ser108Leu | p.S108L | Q9UNE2 | protein_coding | deleterious(0) | benign(0.069) | TCGA-AP-A0LS-01 | Endometrium | uterine corpus endometrioid carcinoma | Female | <65 | I/II | Unknown | Unknown | SD |
| Page: 1 2 3 4 |
Top |
Related drugs of malignant transformation related genes |
| Identification of chemicals and drugs interact with genes involved in malignant transfromation |
| (DGIdb 4.0) |
| Entrez ID | Symbol | Category | Interaction Types | Drug Claim Name | Drug Name | PMIDs |
| Page: 1 |

Copyright 2023-Present -The University of Texas Health Science Center at Houston |