
|
|||||
|
 | |
| |
| |
| |
| |
| |
|
Gene: RPGR |
Gene summary for RPGR |
| Gene information | Species | Human | Gene symbol | RPGR | Gene ID | 6103 |
| Gene name | retinitis pigmentosa GTPase regulator | |
| Gene Alias | COD1 | |
| Cytomap | Xp11.4 | |
| Gene Type | protein-coding | GO ID | GO:0003008 | UniProtAcc | Q92834 |
Top |
Malignant transformation analysis |
| Identification of the aberrant gene expression in precancerous and cancerous lesions by comparing the gene expression of stem-like cells in diseased tissues with normal stem cells |
| Entrez ID | Symbol | Replicates | Species | Organ | Tissue | Adj P-value | Log2FC | Malignancy |
| 6103 | RPGR | RNA-P17T-P17T-4 | Human | Lung | IAC | 3.73e-02 | 4.38e-01 | 0.343 |
| 6103 | RPGR | RNA-P6T1-P6T1-1 | Human | Lung | MIAC | 5.97e-04 | 8.51e-01 | -0.0238 |
| 6103 | RPGR | RNA-P6T1-P6T1-2 | Human | Lung | MIAC | 6.82e-04 | 8.29e-01 | -0.0186 |
| 6103 | RPGR | RNA-P6T1-P6T1-4 | Human | Lung | MIAC | 2.09e-02 | 6.25e-01 | -0.0263 |
| 6103 | RPGR | male-WTA | Human | Thyroid | PTC | 8.31e-05 | 2.31e-02 | 0.1037 |
| 6103 | RPGR | PTC01 | Human | Thyroid | PTC | 7.26e-13 | 1.49e-01 | 0.1899 |
| 6103 | RPGR | PTC03 | Human | Thyroid | PTC | 1.02e-04 | 3.33e-01 | 0.1784 |
| 6103 | RPGR | PTC04 | Human | Thyroid | PTC | 6.37e-18 | 1.71e-01 | 0.1927 |
| 6103 | RPGR | PTC05 | Human | Thyroid | PTC | 1.86e-09 | 3.95e-01 | 0.2065 |
| 6103 | RPGR | PTC06 | Human | Thyroid | PTC | 5.42e-13 | 3.79e-01 | 0.2057 |
| 6103 | RPGR | PTC07 | Human | Thyroid | PTC | 1.15e-21 | 4.46e-01 | 0.2044 |
| 6103 | RPGR | ATC09 | Human | Thyroid | ATC | 8.49e-06 | 4.05e-01 | 0.2871 |
| 6103 | RPGR | ATC11 | Human | Thyroid | ATC | 1.14e-09 | 9.56e-01 | 0.3386 |
| 6103 | RPGR | ATC13 | Human | Thyroid | ATC | 7.31e-07 | 1.33e-01 | 0.34 |
| 6103 | RPGR | ATC1 | Human | Thyroid | ATC | 1.40e-05 | 4.46e-01 | 0.2878 |
| 6103 | RPGR | ATC3 | Human | Thyroid | ATC | 2.49e-13 | 8.36e-01 | 0.338 |
| 6103 | RPGR | ATC5 | Human | Thyroid | ATC | 1.90e-12 | 1.58e-01 | 0.34 |
| Page: 1 |
| Tissue | Expression Dynamics | Abbreviation |
| Lung | 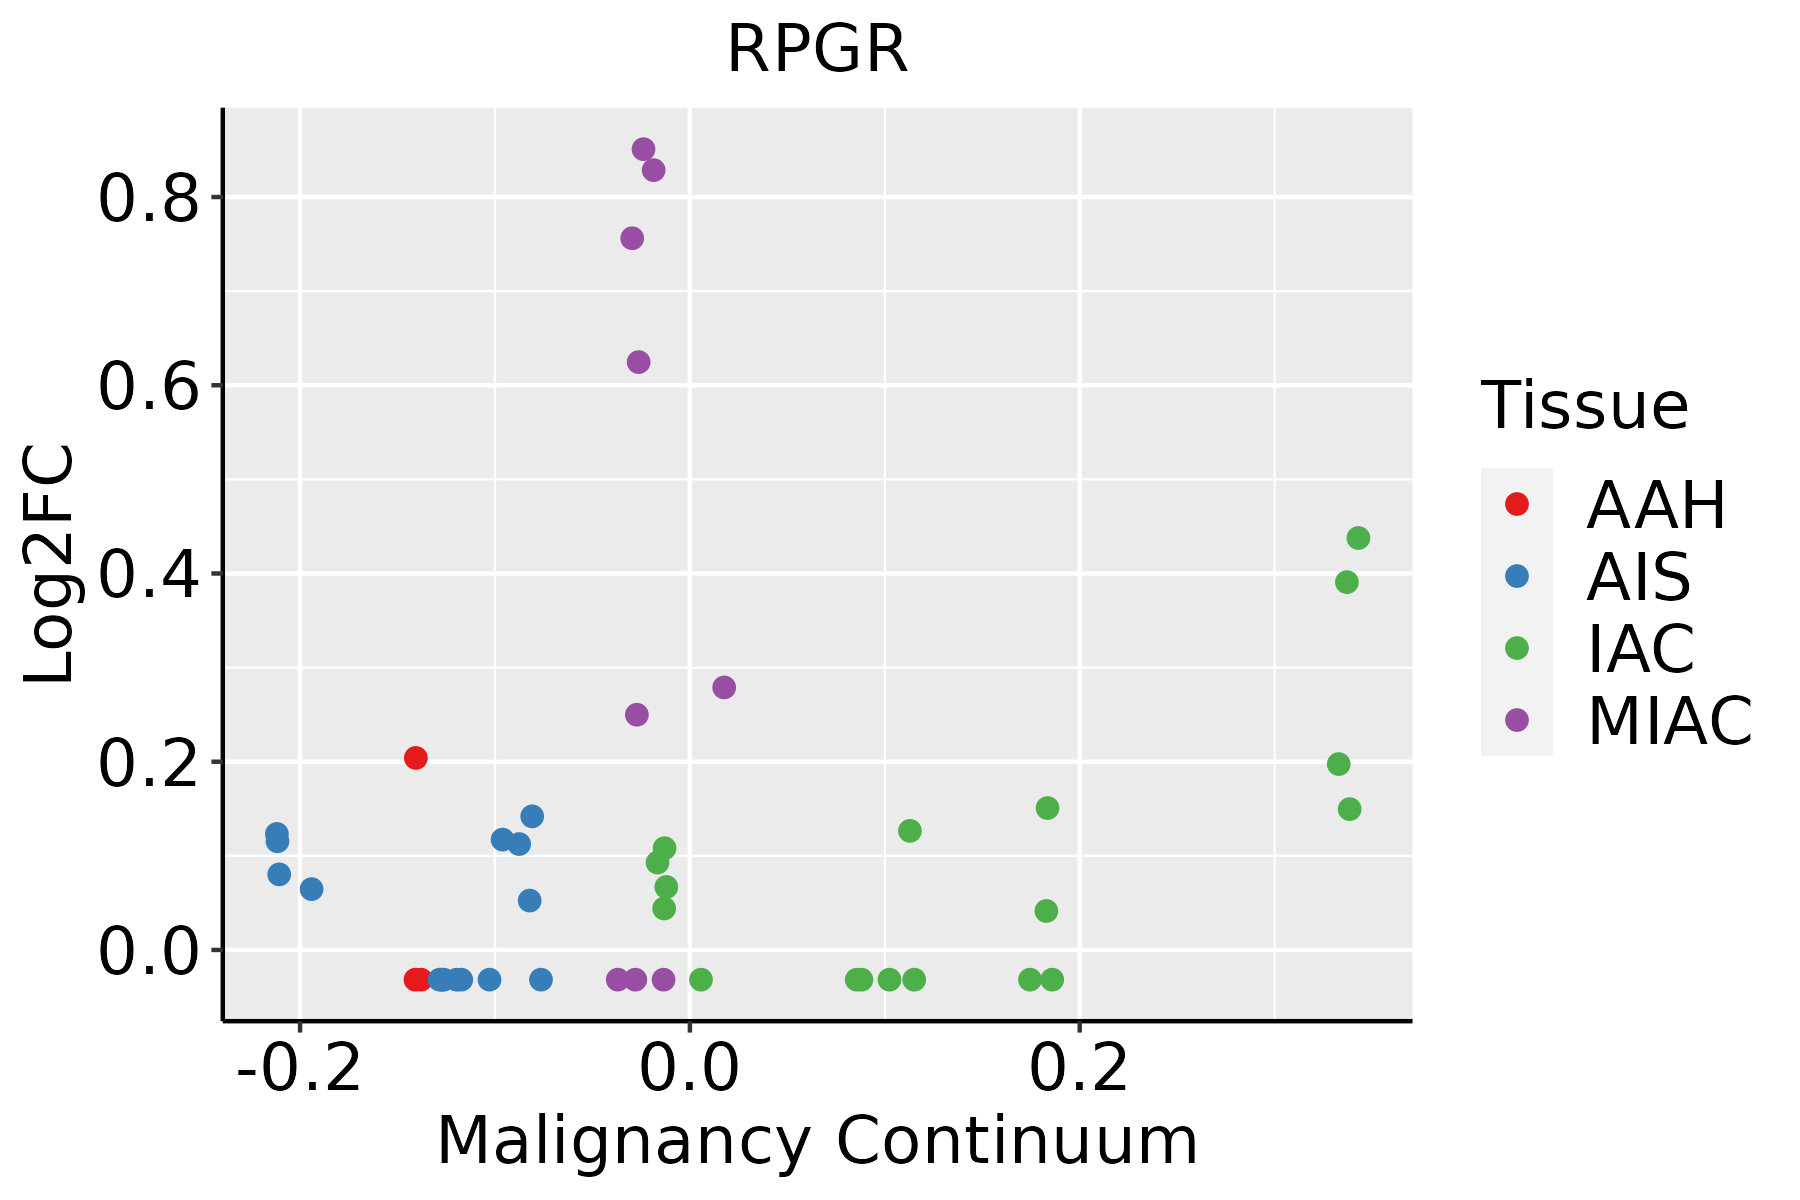 | AAH: Atypical adenomatous hyperplasia |
| AIS: Adenocarcinoma in situ | ||
| IAC: Invasive lung adenocarcinoma | ||
| MIA: Minimally invasive adenocarcinoma | ||
| Thyroid |  | ATC: Anaplastic thyroid cancer |
| HT: Hashimoto's thyroiditis | ||
| PTC: Papillary thyroid cancer |
| ∗log2FC in expression of this searched gene in stem-like cells from each diseased tissue sample relative to stem-like cells in normal samples in each tissue plotted against the malignancy continuum. Samples are colored based on if they are from different disease stage. |
Top |
Malignant transformation related pathway analysis |
| Find out the enriched GO biological processes and KEGG pathways involved in transition from healthy to precancer to cancer |
| Tissue | Disease Stage | Enriched GO biological Processes |
| Colorectum | AD |  |
| Colorectum | SER |  |
| Colorectum | MSS |  |
| Colorectum | MSI-H |  |
| Colorectum | FAP |  |
| ∗Top 15 enriched GO BP terms are showed in the bar plot of each disease state in each tissue. Each row represents a significant GO biological process which is colored according to the -log10(p.adjust). |
| Page: 1 2 3 4 5 6 7 8 9 |
| GO ID | Tissue | Disease Stage | Description | Gene Ratio | Bg Ratio | pvalue | p.adjust | Count |
| GO:00307056 | Lung | IAC | cytoskeleton-dependent intracellular transport | 40/2061 | 195/18723 | 7.30e-05 | 1.54e-03 | 40 |
| GO:00315032 | Lung | IAC | protein-containing complex localization | 42/2061 | 220/18723 | 2.60e-04 | 4.32e-03 | 42 |
| GO:0099111 | Lung | IAC | microtubule-based transport | 35/2061 | 190/18723 | 1.55e-03 | 1.64e-02 | 35 |
| GO:0060271 | Lung | IAC | cilium assembly | 55/2061 | 337/18723 | 1.84e-03 | 1.88e-02 | 55 |
| GO:0044782 | Lung | IAC | cilium organization | 58/2061 | 368/18723 | 3.15e-03 | 2.75e-02 | 58 |
| GO:00109704 | Lung | IAC | transport along microtubule | 28/2061 | 155/18723 | 5.72e-03 | 4.18e-02 | 28 |
| GO:00602711 | Lung | MIAC | cilium assembly | 37/967 | 337/18723 | 1.29e-05 | 9.85e-04 | 37 |
| GO:00447821 | Lung | MIAC | cilium organization | 38/967 | 368/18723 | 3.93e-05 | 2.08e-03 | 38 |
| GO:003070522 | Lung | MIAC | cytoskeleton-dependent intracellular transport | 20/967 | 195/18723 | 2.72e-03 | 3.75e-02 | 20 |
| GO:0007163111 | Thyroid | PTC | establishment or maintenance of cell polarity | 115/5968 | 218/18723 | 1.15e-10 | 3.90e-09 | 115 |
| GO:0001701111 | Thyroid | PTC | in utero embryonic development | 175/5968 | 367/18723 | 1.40e-10 | 4.73e-09 | 175 |
| GO:0030705111 | Thyroid | PTC | cytoskeleton-dependent intracellular transport | 104/5968 | 195/18723 | 3.87e-10 | 1.24e-08 | 104 |
| GO:0048732113 | Thyroid | PTC | gland development | 193/5968 | 436/18723 | 2.88e-08 | 6.42e-07 | 193 |
| GO:0001889112 | Thyroid | PTC | liver development | 79/5968 | 147/18723 | 3.08e-08 | 6.82e-07 | 79 |
| GO:0061008112 | Thyroid | PTC | hepaticobiliary system development | 80/5968 | 150/18723 | 3.94e-08 | 8.55e-07 | 80 |
| GO:00315037 | Thyroid | PTC | protein-containing complex localization | 107/5968 | 220/18723 | 1.47e-07 | 2.82e-06 | 107 |
| GO:00109709 | Thyroid | PTC | transport along microtubule | 80/5968 | 155/18723 | 2.48e-07 | 4.32e-06 | 80 |
| GO:000182215 | Thyroid | PTC | kidney development | 133/5968 | 293/18723 | 7.57e-07 | 1.18e-05 | 133 |
| GO:000165517 | Thyroid | PTC | urogenital system development | 149/5968 | 338/18723 | 1.41e-06 | 2.01e-05 | 149 |
| GO:007200114 | Thyroid | PTC | renal system development | 135/5968 | 302/18723 | 1.76e-06 | 2.43e-05 | 135 |
| Page: 1 2 3 |
| Pathway ID | Tissue | Disease Stage | Description | Gene Ratio | Bg Ratio | pvalue | p.adjust | qvalue | Count |
| Page: 1 |
Top |
Cell-cell communication analysis |
| Identification of potential cell-cell interactions between two cell types and their ligand-receptor pairs for different disease states |
| Ligand | Receptor | LRpair | Pathway | Tissue | Disease Stage |
| Page: 1 |
Top |
Single-cell gene regulatory network inference analysis |
| Find out the significant the regulons (TFs) and the target genes of each regulon across cell types for different disease states |
| TF | Cell Type | Tissue | Disease Stage | Target Gene | RSS | Regulon Activity |
| ∗The dot plots of a searched regulon are shown for all cell subpopulations in each disease state of each tissue based on the regulon specific score inferred using pySCENIC and by calculating the average expression. |
| Page: 1 |
Top |
Somatic mutation of malignant transformation related genes |
| Annotation of somatic variants for genes involved in malignant transformation |
| Hugo Symbol | Variant Class | Variant Classification | dbSNP RS | HGVSc | HGVSp | HGVSp Short | SWISSPROT | BIOTYPE | SIFT | PolyPhen | Tumor Sample Barcode | Tissue | Histology | Sex | Age | Stage | Therapy Types | Drugs | Outcome |
| RPGR | SNV | Missense_Mutation | rs757712647 | c.967N>T | p.Arg323Cys | p.R323C | Q92834 | protein_coding | deleterious_low_confidence(0.01) | probably_damaging(1) | TCGA-A2-A0D2-01 | Breast | breast invasive carcinoma | Female | <65 | I/II | Chemotherapy | adriamycin | SD |
| RPGR | SNV | Missense_Mutation | c.2061G>C | p.Glu687Asp | p.E687D | Q92834 | protein_coding | tolerated_low_confidence(0.13) | benign(0) | TCGA-A2-A0YD-01 | Breast | breast invasive carcinoma | Female | <65 | I/II | Chemotherapy | cytoxan | SD | |
| RPGR | SNV | Missense_Mutation | c.2197N>A | p.Glu733Lys | p.E733K | Q92834 | protein_coding | deleterious_low_confidence(0.05) | benign(0.007) | TCGA-A2-A0YK-01 | Breast | breast invasive carcinoma | Female | <65 | I/II | Chemotherapy | cytoxan | SD | |
| RPGR | SNV | Missense_Mutation | c.1175N>A | p.Pro392Gln | p.P392Q | Q92834 | protein_coding | deleterious_low_confidence(0.02) | possibly_damaging(0.73) | TCGA-A2-A25A-01 | Breast | breast invasive carcinoma | Female | <65 | I/II | Unspecific | Cytoxan | SD | |
| RPGR | SNV | Missense_Mutation | c.593N>T | p.Gly198Val | p.G198V | Q92834 | protein_coding | deleterious_low_confidence(0) | probably_damaging(1) | TCGA-AC-A23H-01 | Breast | breast invasive carcinoma | Female | >=65 | I/II | Unknown | Unknown | PD | |
| RPGR | SNV | Missense_Mutation | novel | c.1397T>C | p.Met466Thr | p.M466T | Q92834 | protein_coding | tolerated_low_confidence(0.23) | benign(0.011) | TCGA-AO-A128-01 | Breast | breast invasive carcinoma | Female | <65 | I/II | Chemotherapy | doxorubicin | SD |
| RPGR | SNV | Missense_Mutation | c.1850G>T | p.Gly617Val | p.G617V | Q92834 | protein_coding | tolerated_low_confidence(0.16) | benign(0.359) | TCGA-AR-A24X-01 | Breast | breast invasive carcinoma | Female | <65 | I/II | Hormone Therapy | tamoxiphen | SD | |
| RPGR | SNV | Missense_Mutation | novel | c.1327N>T | p.Pro443Ser | p.P443S | Q92834 | protein_coding | tolerated_low_confidence(0.08) | benign(0.029) | TCGA-AR-A5QP-01 | Breast | breast invasive carcinoma | Female | <65 | I/II | Hormone Therapy | tamoxiphen | SD |
| RPGR | SNV | Missense_Mutation | novel | c.3146N>G | p.Glu1049Gly | p.E1049G | Q92834 | protein_coding | deleterious_low_confidence(0) | benign(0.003) | TCGA-BH-A0HQ-01 | Breast | breast invasive carcinoma | Female | <65 | I/II | Hormone Therapy | arimidex | SD |
| RPGR | SNV | Missense_Mutation | novel | c.457N>A | p.Ala153Thr | p.A153T | Q92834 | protein_coding | deleterious_low_confidence(0.01) | probably_damaging(0.997) | TCGA-C8-A3M8-01 | Breast | breast invasive carcinoma | Female | >=65 | I/II | Hormone Therapy | tamoxiphen | CR |
| Page: 1 2 3 4 5 6 7 8 9 10 11 12 |
Top |
Related drugs of malignant transformation related genes |
| Identification of chemicals and drugs interact with genes involved in malignant transfromation |
| (DGIdb 4.0) |
| Entrez ID | Symbol | Category | Interaction Types | Drug Claim Name | Drug Name | PMIDs |
| Page: 1 |

Copyright 2023-Present -The University of Texas Health Science Center at Houston |