
|
|||||
|
 | |
| |
| |
| |
| |
| |
|
Gene: RPF1 |
Gene summary for RPF1 |
| Gene information | Species | Human | Gene symbol | RPF1 | Gene ID | 80135 |
| Gene name | ribosome production factor 1 homolog | |
| Gene Alias | BXDC5 | |
| Cytomap | 1p22.3 | |
| Gene Type | protein-coding | GO ID | GO:0000460 | UniProtAcc | Q9H9Y2 |
Top |
Malignant transformation analysis |
| Identification of the aberrant gene expression in precancerous and cancerous lesions by comparing the gene expression of stem-like cells in diseased tissues with normal stem cells |
| Entrez ID | Symbol | Replicates | Species | Organ | Tissue | Adj P-value | Log2FC | Malignancy |
| 80135 | RPF1 | LZE4T | Human | Esophagus | ESCC | 9.42e-03 | 3.01e-02 | 0.0811 |
| 80135 | RPF1 | LZE7T | Human | Esophagus | ESCC | 7.80e-06 | 3.24e-01 | 0.0667 |
| 80135 | RPF1 | LZE8T | Human | Esophagus | ESCC | 9.68e-04 | 3.31e-03 | 0.067 |
| 80135 | RPF1 | LZE20T | Human | Esophagus | ESCC | 2.52e-02 | 9.81e-02 | 0.0662 |
| 80135 | RPF1 | LZE24T | Human | Esophagus | ESCC | 2.49e-07 | 1.58e-01 | 0.0596 |
| 80135 | RPF1 | LZE6T | Human | Esophagus | ESCC | 3.64e-03 | 1.14e-01 | 0.0845 |
| 80135 | RPF1 | P1T-E | Human | Esophagus | ESCC | 1.36e-08 | 1.78e-01 | 0.0875 |
| 80135 | RPF1 | P2T-E | Human | Esophagus | ESCC | 1.73e-14 | 1.84e-01 | 0.1177 |
| 80135 | RPF1 | P4T-E | Human | Esophagus | ESCC | 1.91e-10 | 2.11e-01 | 0.1323 |
| 80135 | RPF1 | P5T-E | Human | Esophagus | ESCC | 1.99e-11 | 2.51e-01 | 0.1327 |
| 80135 | RPF1 | P8T-E | Human | Esophagus | ESCC | 3.88e-10 | 2.41e-01 | 0.0889 |
| 80135 | RPF1 | P9T-E | Human | Esophagus | ESCC | 7.63e-13 | 1.56e-01 | 0.1131 |
| 80135 | RPF1 | P10T-E | Human | Esophagus | ESCC | 1.14e-30 | 5.37e-01 | 0.116 |
| 80135 | RPF1 | P12T-E | Human | Esophagus | ESCC | 1.21e-47 | 1.07e+00 | 0.1122 |
| 80135 | RPF1 | P15T-E | Human | Esophagus | ESCC | 1.16e-09 | 1.68e-01 | 0.1149 |
| 80135 | RPF1 | P16T-E | Human | Esophagus | ESCC | 1.12e-11 | 1.33e-01 | 0.1153 |
| 80135 | RPF1 | P17T-E | Human | Esophagus | ESCC | 8.87e-13 | 2.20e-01 | 0.1278 |
| 80135 | RPF1 | P19T-E | Human | Esophagus | ESCC | 1.51e-04 | 5.45e-01 | 0.1662 |
| 80135 | RPF1 | P20T-E | Human | Esophagus | ESCC | 1.41e-15 | 3.46e-01 | 0.1124 |
| 80135 | RPF1 | P21T-E | Human | Esophagus | ESCC | 1.05e-29 | 5.73e-01 | 0.1617 |
| Page: 1 2 3 4 5 6 |
| Tissue | Expression Dynamics | Abbreviation |
| Esophagus | 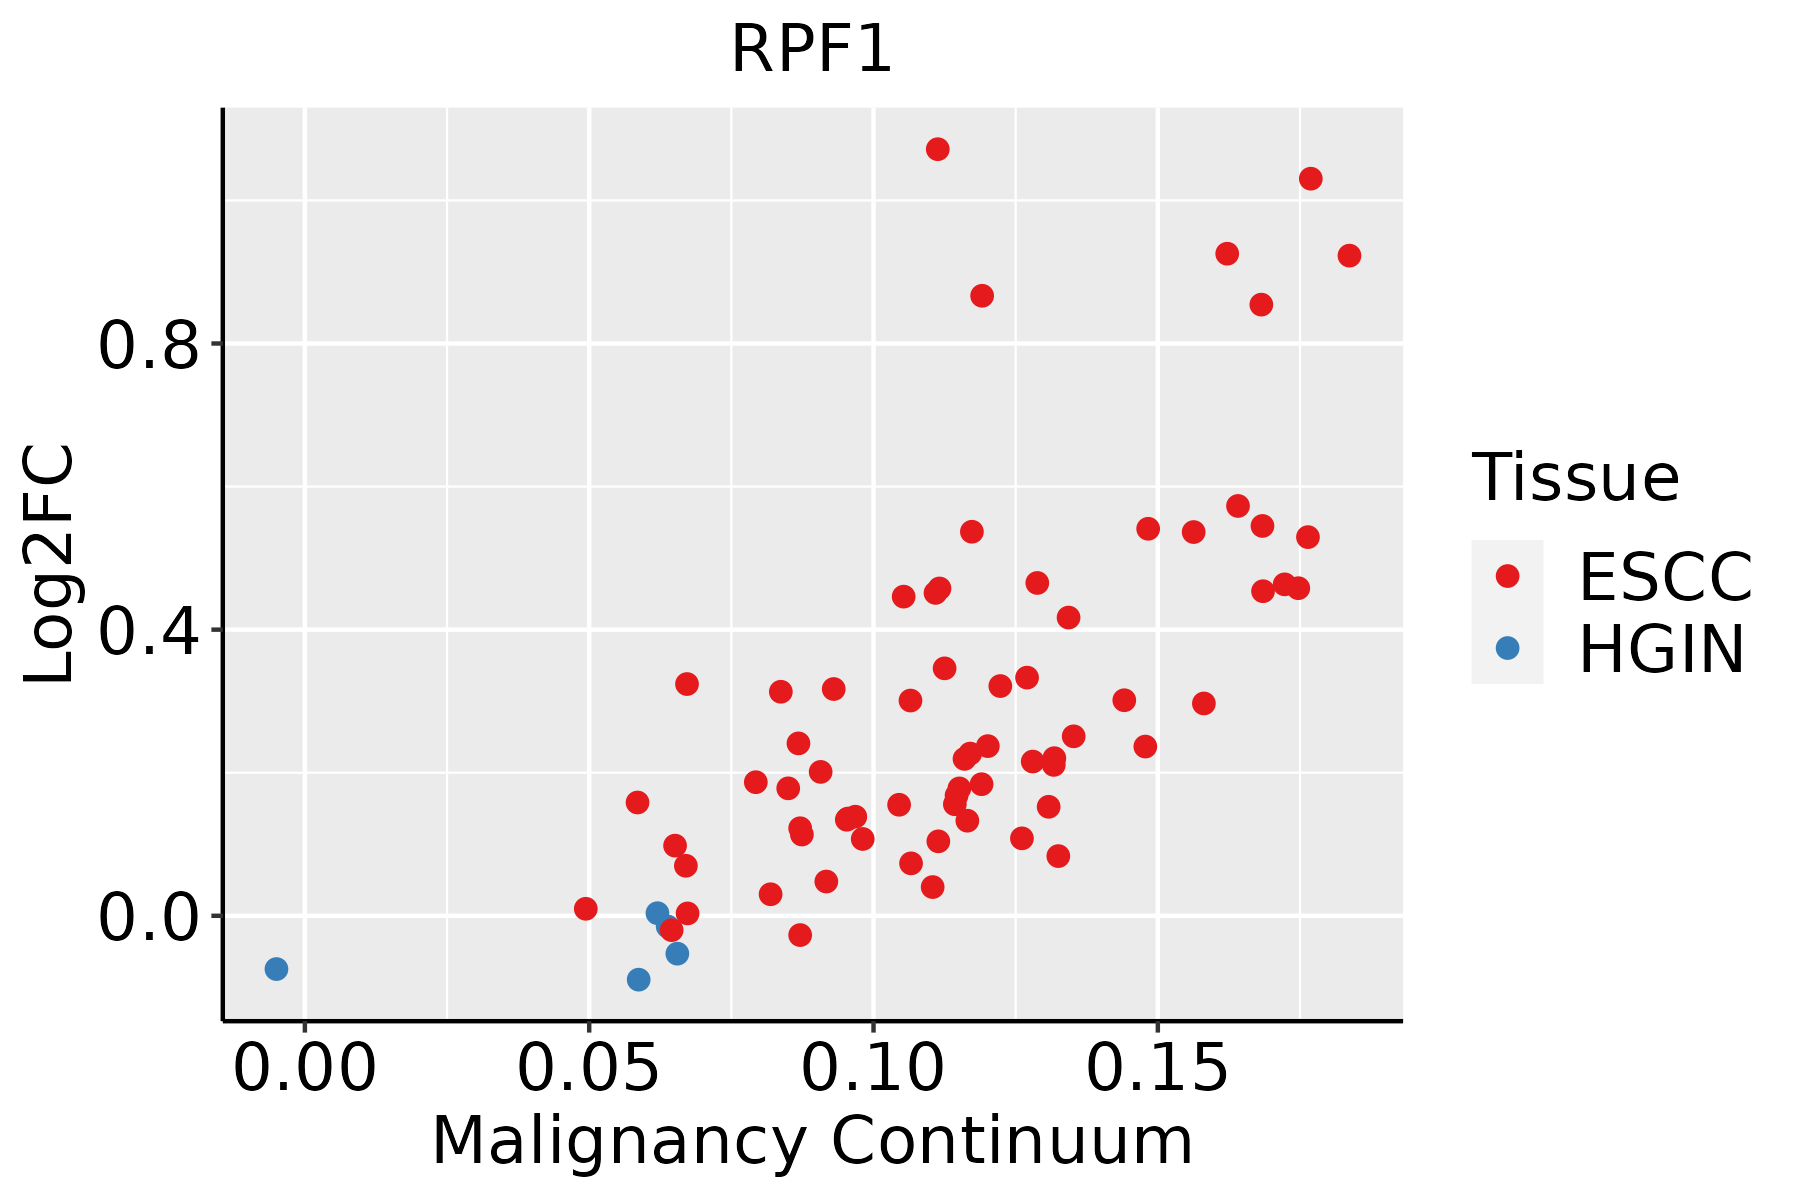 | ESCC: Esophageal squamous cell carcinoma |
| HGIN: High-grade intraepithelial neoplasias | ||
| LGIN: Low-grade intraepithelial neoplasias | ||
| Liver | 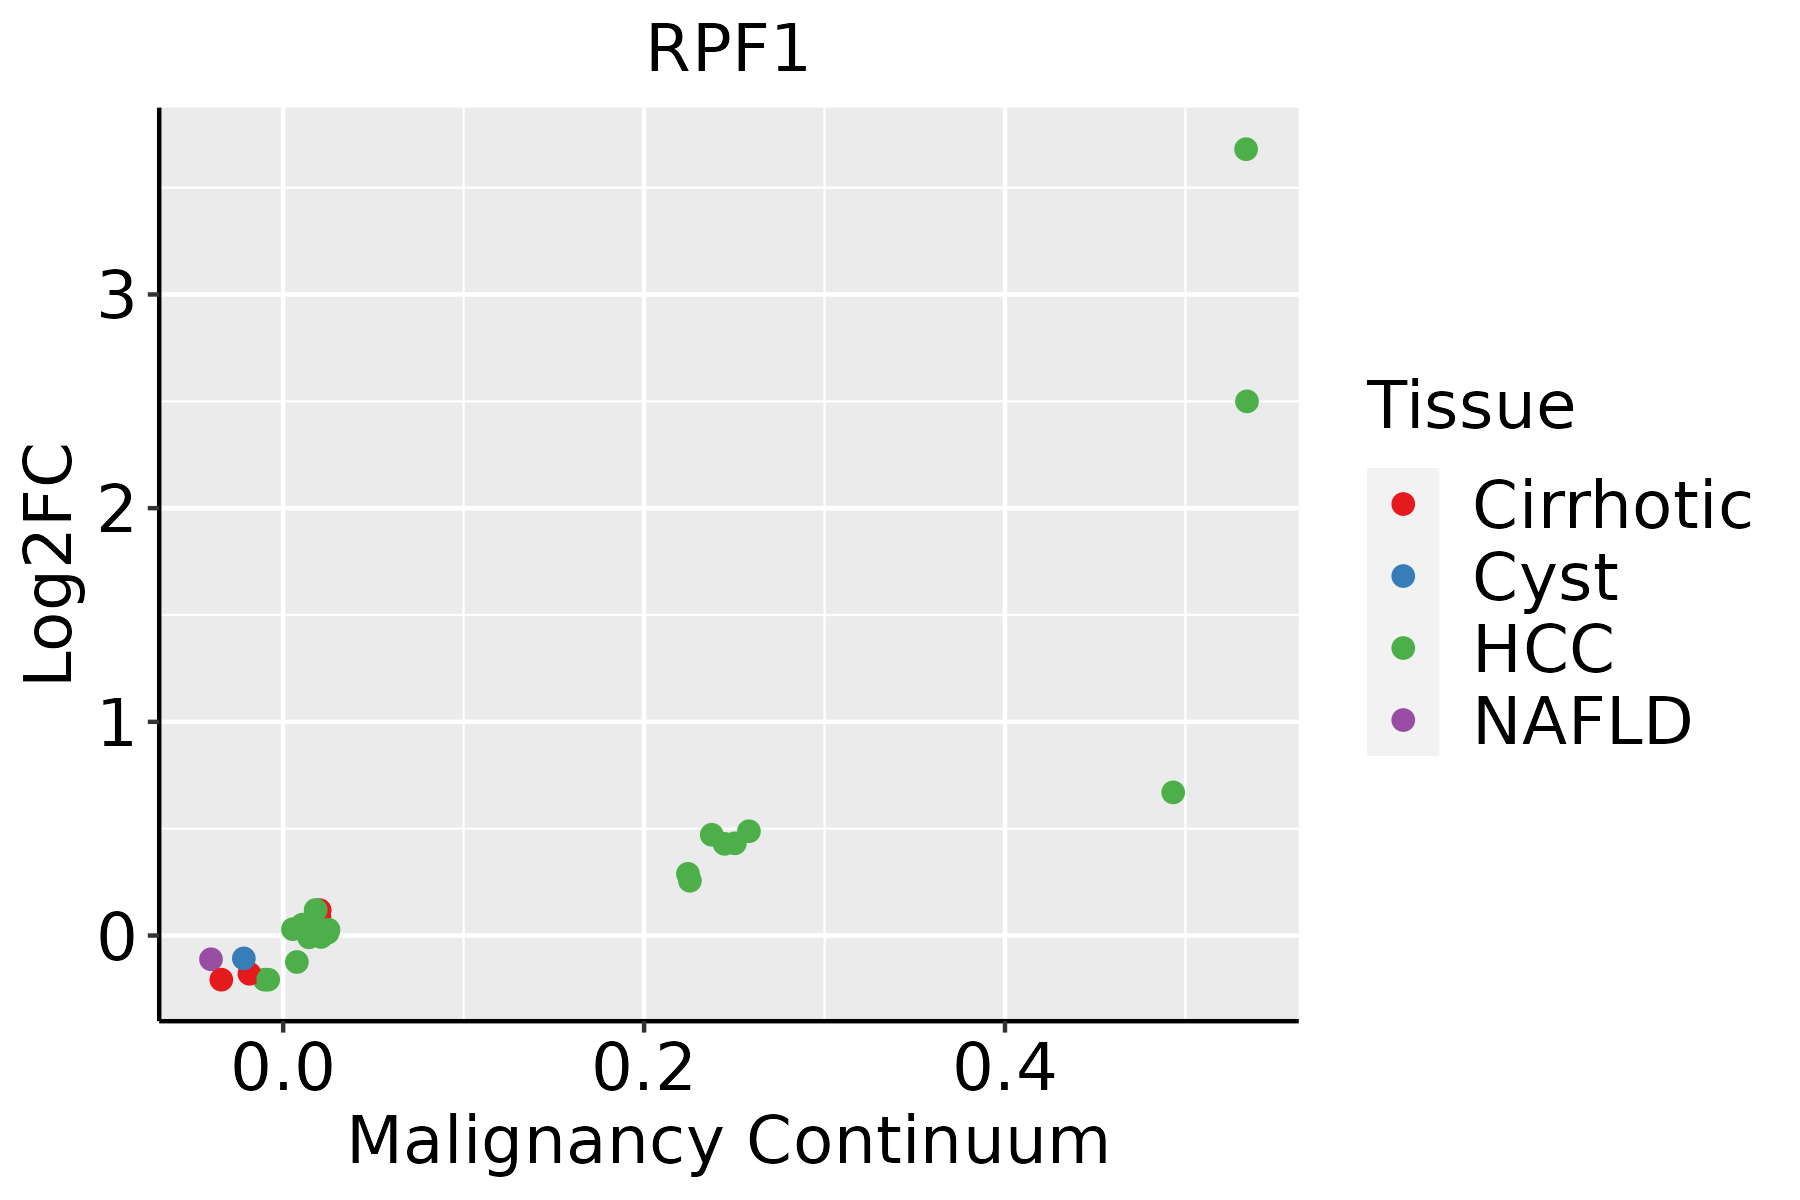 | HCC: Hepatocellular carcinoma |
| NAFLD: Non-alcoholic fatty liver disease | ||
| Oral Cavity | 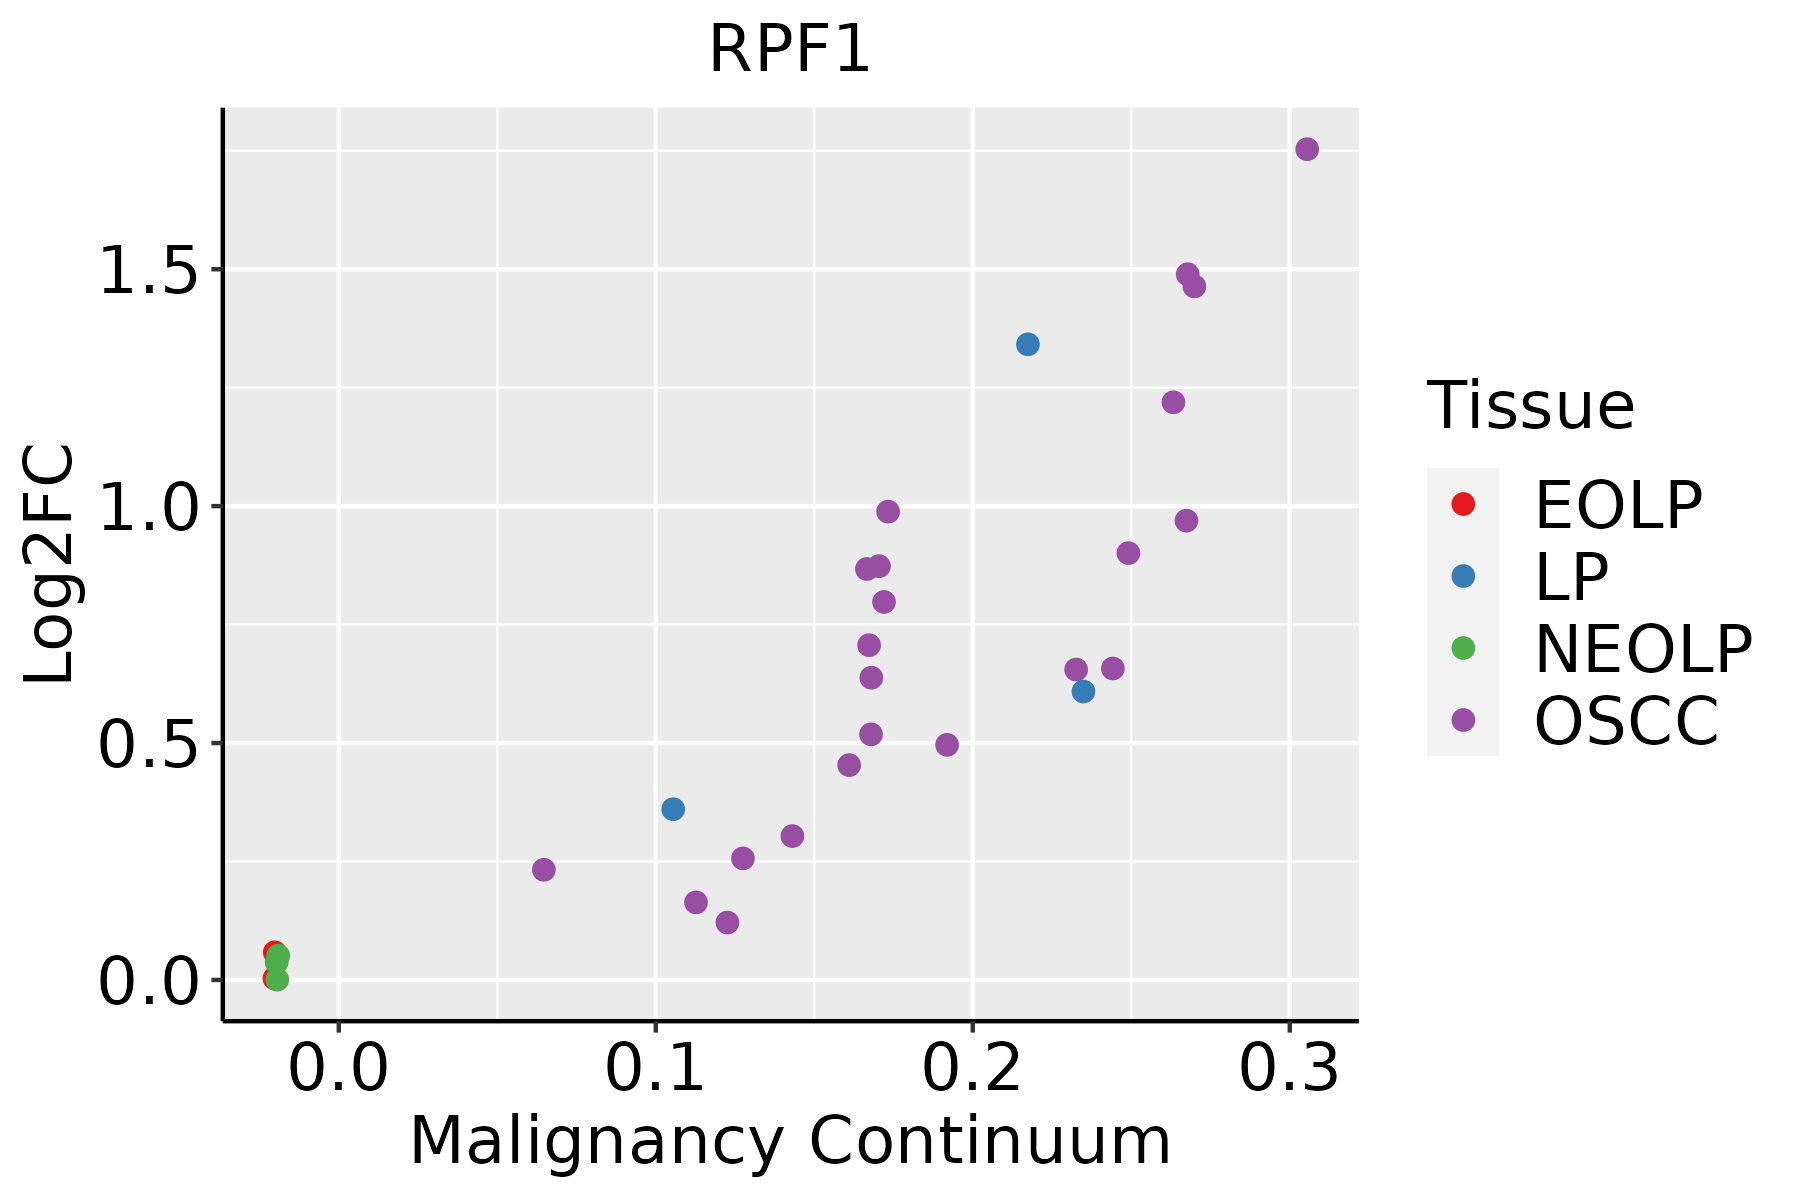 | EOLP: Erosive Oral lichen planus |
| LP: leukoplakia | ||
| NEOLP: Non-erosive oral lichen planus | ||
| OSCC: Oral squamous cell carcinoma | ||
| Skin |  | AK: Actinic keratosis |
| cSCC: Cutaneous squamous cell carcinoma | ||
| SCCIS:squamous cell carcinoma in situ | ||
| Thyroid | 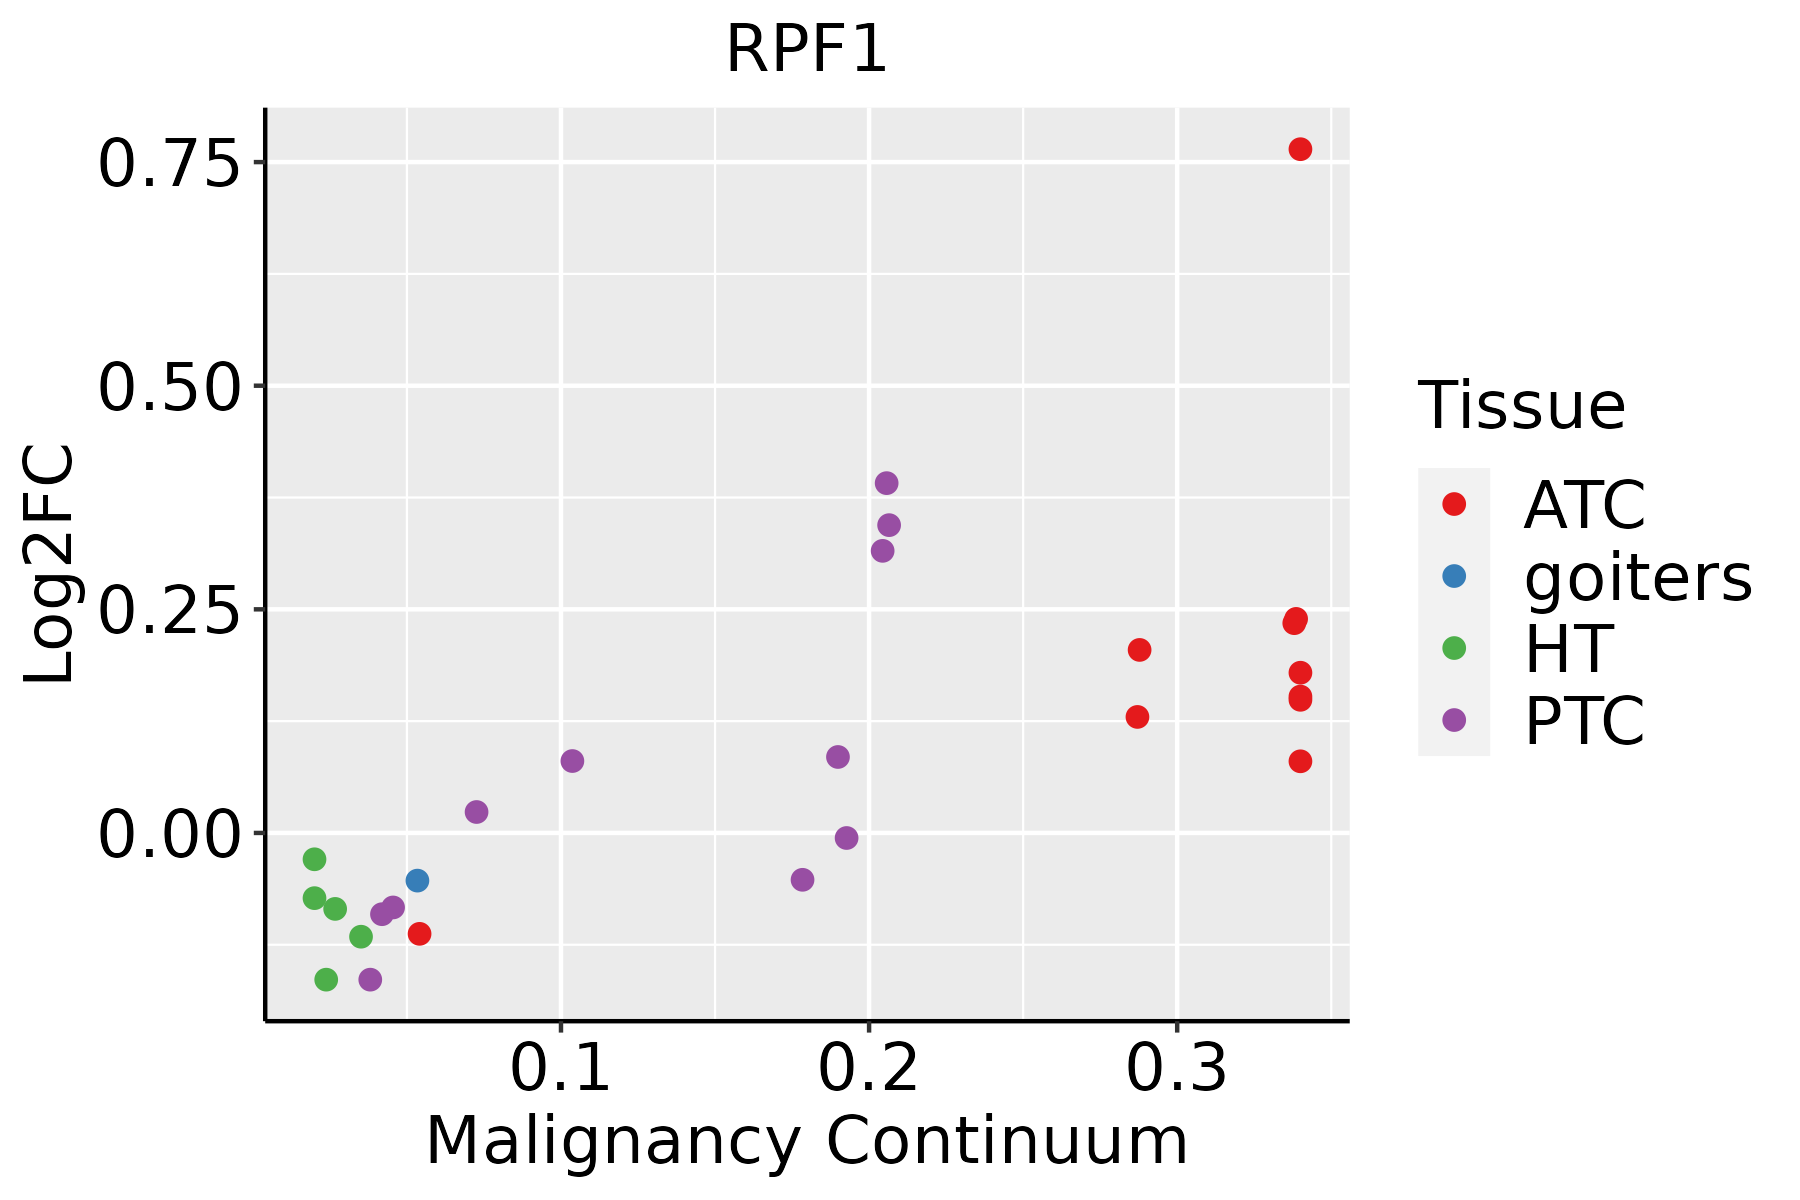 | ATC: Anaplastic thyroid cancer |
| HT: Hashimoto's thyroiditis | ||
| PTC: Papillary thyroid cancer |
| ∗log2FC in expression of this searched gene in stem-like cells from each diseased tissue sample relative to stem-like cells in normal samples in each tissue plotted against the malignancy continuum. Samples are colored based on if they are from different disease stage. |
Top |
Malignant transformation related pathway analysis |
| Find out the enriched GO biological processes and KEGG pathways involved in transition from healthy to precancer to cancer |
| Tissue | Disease Stage | Enriched GO biological Processes |
| Colorectum | AD |  |
| Colorectum | SER |  |
| Colorectum | MSS |  |
| Colorectum | MSI-H |  |
| Colorectum | FAP |  |
| ∗Top 15 enriched GO BP terms are showed in the bar plot of each disease state in each tissue. Each row represents a significant GO biological process which is colored according to the -log10(p.adjust). |
| Page: 1 2 3 4 5 6 7 8 9 |
| GO ID | Tissue | Disease Stage | Description | Gene Ratio | Bg Ratio | pvalue | p.adjust | Count |
| GO:0008380 | Colorectum | AD | RNA splicing | 169/3918 | 434/18723 | 3.59e-18 | 2.04e-15 | 169 |
| GO:0000377 | Colorectum | AD | RNA splicing, via transesterification reactions with bulged adenosine as nucleophile | 130/3918 | 320/18723 | 5.88e-16 | 2.16e-13 | 130 |
| GO:0000398 | Colorectum | AD | mRNA splicing, via spliceosome | 130/3918 | 320/18723 | 5.88e-16 | 2.16e-13 | 130 |
| GO:0000375 | Colorectum | AD | RNA splicing, via transesterification reactions | 131/3918 | 324/18723 | 7.11e-16 | 2.22e-13 | 131 |
| GO:1903311 | Colorectum | AD | regulation of mRNA metabolic process | 117/3918 | 288/18723 | 1.69e-14 | 4.23e-12 | 117 |
| GO:0010498 | Colorectum | AD | proteasomal protein catabolic process | 174/3918 | 490/18723 | 3.18e-14 | 7.66e-12 | 174 |
| GO:0043484 | Colorectum | AD | regulation of RNA splicing | 70/3918 | 148/18723 | 6.47e-13 | 1.16e-10 | 70 |
| GO:0022618 | Colorectum | AD | ribonucleoprotein complex assembly | 92/3918 | 220/18723 | 1.49e-12 | 2.60e-10 | 92 |
| GO:0071826 | Colorectum | AD | ribonucleoprotein complex subunit organization | 94/3918 | 227/18723 | 1.70e-12 | 2.87e-10 | 94 |
| GO:0048024 | Colorectum | AD | regulation of mRNA splicing, via spliceosome | 50/3918 | 101/18723 | 1.62e-10 | 1.56e-08 | 50 |
| GO:0050684 | Colorectum | AD | regulation of mRNA processing | 61/3918 | 137/18723 | 4.23e-10 | 3.58e-08 | 61 |
| GO:0022613 | Colorectum | AD | ribonucleoprotein complex biogenesis | 151/3918 | 463/18723 | 1.96e-09 | 1.39e-07 | 151 |
| GO:0000209 | Colorectum | AD | protein polyubiquitination | 78/3918 | 236/18723 | 8.71e-06 | 2.06e-04 | 78 |
| GO:0000245 | Colorectum | AD | spliceosomal complex assembly | 33/3918 | 79/18723 | 2.15e-05 | 4.33e-04 | 33 |
| GO:1903313 | Colorectum | AD | positive regulation of mRNA metabolic process | 44/3918 | 118/18723 | 3.20e-05 | 5.87e-04 | 44 |
| GO:0033120 | Colorectum | AD | positive regulation of RNA splicing | 19/3918 | 37/18723 | 4.08e-05 | 7.26e-04 | 19 |
| GO:0010720 | Colorectum | AD | positive regulation of cell development | 87/3918 | 298/18723 | 4.17e-04 | 4.71e-03 | 87 |
| GO:0048026 | Colorectum | AD | positive regulation of mRNA splicing, via spliceosome | 12/3918 | 22/18723 | 5.38e-04 | 5.74e-03 | 12 |
| GO:0050767 | Colorectum | AD | regulation of neurogenesis | 99/3918 | 364/18723 | 2.35e-03 | 1.82e-02 | 99 |
| GO:0070534 | Colorectum | AD | protein K63-linked ubiquitination | 20/3918 | 56/18723 | 7.57e-03 | 4.58e-02 | 20 |
| Page: 1 2 3 4 5 6 7 8 9 10 11 12 13 14 15 16 17 18 19 20 21 22 23 24 25 |
| Pathway ID | Tissue | Disease Stage | Description | Gene Ratio | Bg Ratio | pvalue | p.adjust | qvalue | Count |
| Page: 1 |
Top |
Cell-cell communication analysis |
| Identification of potential cell-cell interactions between two cell types and their ligand-receptor pairs for different disease states |
| Ligand | Receptor | LRpair | Pathway | Tissue | Disease Stage |
| Page: 1 |
Top |
Single-cell gene regulatory network inference analysis |
| Find out the significant the regulons (TFs) and the target genes of each regulon across cell types for different disease states |
| TF | Cell Type | Tissue | Disease Stage | Target Gene | RSS | Regulon Activity |
| ∗The dot plots of a searched regulon are shown for all cell subpopulations in each disease state of each tissue based on the regulon specific score inferred using pySCENIC and by calculating the average expression. |
| Page: 1 |
Top |
Somatic mutation of malignant transformation related genes |
| Annotation of somatic variants for genes involved in malignant transformation |
| Hugo Symbol | Variant Class | Variant Classification | dbSNP RS | HGVSc | HGVSp | HGVSp Short | SWISSPROT | BIOTYPE | SIFT | PolyPhen | Tumor Sample Barcode | Tissue | Histology | Sex | Age | Stage | Therapy Types | Drugs | Outcome |
| RPF1 | insertion | In_Frame_Ins | novel | c.225_226insGAAGAA | p.Arg75_Lys76insGluGlu | p.R75_K76insEE | Q9H9Y2 | protein_coding | TCGA-A7-A0CE-01 | Breast | breast invasive carcinoma | Female | <65 | I/II | Chemotherapy | adriamycin | SD | ||
| RPF1 | SNV | Missense_Mutation | novel | c.953C>A | p.Ser318Tyr | p.S318Y | Q9H9Y2 | protein_coding | deleterious(0.02) | possibly_damaging(0.838) | TCGA-2W-A8YY-01 | Cervix | cervical & endocervical cancer | Female | <65 | I/II | Chemotherapy | cisplatin | CR |
| RPF1 | SNV | Missense_Mutation | novel | c.326G>A | p.Arg109Gln | p.R109Q | Q9H9Y2 | protein_coding | deleterious(0) | probably_damaging(0.999) | TCGA-AA-3949-01 | Colorectum | colon adenocarcinoma | Female | >=65 | III/IV | Unknown | Unknown | SD |
| RPF1 | SNV | Missense_Mutation | c.238G>A | p.Ala80Thr | p.A80T | Q9H9Y2 | protein_coding | tolerated(0.22) | benign(0.079) | TCGA-AZ-4615-01 | Colorectum | colon adenocarcinoma | Male | >=65 | III/IV | Chemotherapy | xeloda | PD | |
| RPF1 | SNV | Missense_Mutation | rs763702720 | c.782G>A | p.Arg261His | p.R261H | Q9H9Y2 | protein_coding | deleterious(0) | probably_damaging(1) | TCGA-AG-3892-01 | Colorectum | rectum adenocarcinoma | Female | <65 | I/II | Unknown | Unknown | SD |
| RPF1 | SNV | Missense_Mutation | c.49A>C | p.Lys17Gln | p.K17Q | Q9H9Y2 | protein_coding | deleterious_low_confidence(0.05) | benign(0.04) | TCGA-AG-A002-01 | Colorectum | rectum adenocarcinoma | Male | <65 | I/II | Unknown | Unknown | SD | |
| RPF1 | SNV | Missense_Mutation | rs530459635 | c.685C>T | p.Arg229Cys | p.R229C | Q9H9Y2 | protein_coding | tolerated(0.08) | benign(0.055) | TCGA-AG-A002-01 | Colorectum | rectum adenocarcinoma | Male | <65 | I/II | Unknown | Unknown | SD |
| RPF1 | insertion | Nonsense_Mutation | novel | c.799_800insAGAAAAATAATGAAAAA | p.Phe267Ter | p.F267* | Q9H9Y2 | protein_coding | TCGA-AM-5820-01 | Colorectum | colon adenocarcinoma | Female | <65 | I/II | Unknown | Unknown | SD | ||
| RPF1 | insertion | Frame_Shift_Ins | novel | c.428dupA | p.Ile144AspfsTer8 | p.I144Dfs*8 | Q9H9Y2 | protein_coding | TCGA-F4-6856-01 | Colorectum | colon adenocarcinoma | Male | <65 | I/II | Ancillary | leucovorin | CR | ||
| RPF1 | SNV | Missense_Mutation | novel | c.826N>G | p.Arg276Gly | p.R276G | Q9H9Y2 | protein_coding | deleterious(0) | probably_damaging(0.992) | TCGA-A5-A0G2-01 | Endometrium | uterine corpus endometrioid carcinoma | Female | <65 | III/IV | Unknown | Unknown | SD |
| Page: 1 2 3 |
Top |
Related drugs of malignant transformation related genes |
| Identification of chemicals and drugs interact with genes involved in malignant transfromation |
| (DGIdb 4.0) |
| Entrez ID | Symbol | Category | Interaction Types | Drug Claim Name | Drug Name | PMIDs |
| Page: 1 |

Copyright 2023-Present -The University of Texas Health Science Center at Houston |