
|
|||||
|
 | |
| |
| |
| |
| |
| |
|
Gene: RPE |
Gene summary for RPE |
| Gene information | Species | Human | Gene symbol | RPE | Gene ID | 6120 |
| Gene name | ribulose-5-phosphate-3-epimerase | |
| Gene Alias | RPE2-1 | |
| Cytomap | 2q34 | |
| Gene Type | protein-coding | GO ID | GO:0005975 | UniProtAcc | Q96AT9 |
Top |
Malignant transformation analysis |
| Identification of the aberrant gene expression in precancerous and cancerous lesions by comparing the gene expression of stem-like cells in diseased tissues with normal stem cells |
| Entrez ID | Symbol | Replicates | Species | Organ | Tissue | Adj P-value | Log2FC | Malignancy |
| 6120 | RPE | LZE4T | Human | Esophagus | ESCC | 2.80e-09 | 2.07e-01 | 0.0811 |
| 6120 | RPE | LZE7T | Human | Esophagus | ESCC | 2.20e-04 | 3.76e-01 | 0.0667 |
| 6120 | RPE | LZE8T | Human | Esophagus | ESCC | 1.05e-02 | 1.24e-01 | 0.067 |
| 6120 | RPE | LZE20T | Human | Esophagus | ESCC | 1.22e-02 | 9.88e-02 | 0.0662 |
| 6120 | RPE | LZE24T | Human | Esophagus | ESCC | 1.00e-08 | 2.24e-01 | 0.0596 |
| 6120 | RPE | LZE6T | Human | Esophagus | ESCC | 2.60e-08 | 2.42e-01 | 0.0845 |
| 6120 | RPE | P2T-E | Human | Esophagus | ESCC | 1.89e-14 | 2.44e-01 | 0.1177 |
| 6120 | RPE | P4T-E | Human | Esophagus | ESCC | 1.07e-29 | 6.60e-01 | 0.1323 |
| 6120 | RPE | P5T-E | Human | Esophagus | ESCC | 2.99e-12 | 2.07e-01 | 0.1327 |
| 6120 | RPE | P8T-E | Human | Esophagus | ESCC | 5.06e-18 | 2.65e-01 | 0.0889 |
| 6120 | RPE | P9T-E | Human | Esophagus | ESCC | 1.04e-11 | 2.42e-01 | 0.1131 |
| 6120 | RPE | P10T-E | Human | Esophagus | ESCC | 1.98e-18 | 4.26e-01 | 0.116 |
| 6120 | RPE | P11T-E | Human | Esophagus | ESCC | 7.81e-06 | 3.86e-01 | 0.1426 |
| 6120 | RPE | P12T-E | Human | Esophagus | ESCC | 2.96e-28 | 5.94e-01 | 0.1122 |
| 6120 | RPE | P15T-E | Human | Esophagus | ESCC | 6.94e-47 | 8.97e-01 | 0.1149 |
| 6120 | RPE | P16T-E | Human | Esophagus | ESCC | 2.08e-22 | 4.48e-01 | 0.1153 |
| 6120 | RPE | P17T-E | Human | Esophagus | ESCC | 2.36e-06 | 4.02e-01 | 0.1278 |
| 6120 | RPE | P19T-E | Human | Esophagus | ESCC | 1.12e-06 | 3.51e-01 | 0.1662 |
| 6120 | RPE | P20T-E | Human | Esophagus | ESCC | 6.69e-17 | 3.94e-01 | 0.1124 |
| 6120 | RPE | P21T-E | Human | Esophagus | ESCC | 1.91e-21 | 5.41e-01 | 0.1617 |
| Page: 1 2 3 4 5 |
| Tissue | Expression Dynamics | Abbreviation |
| Esophagus | 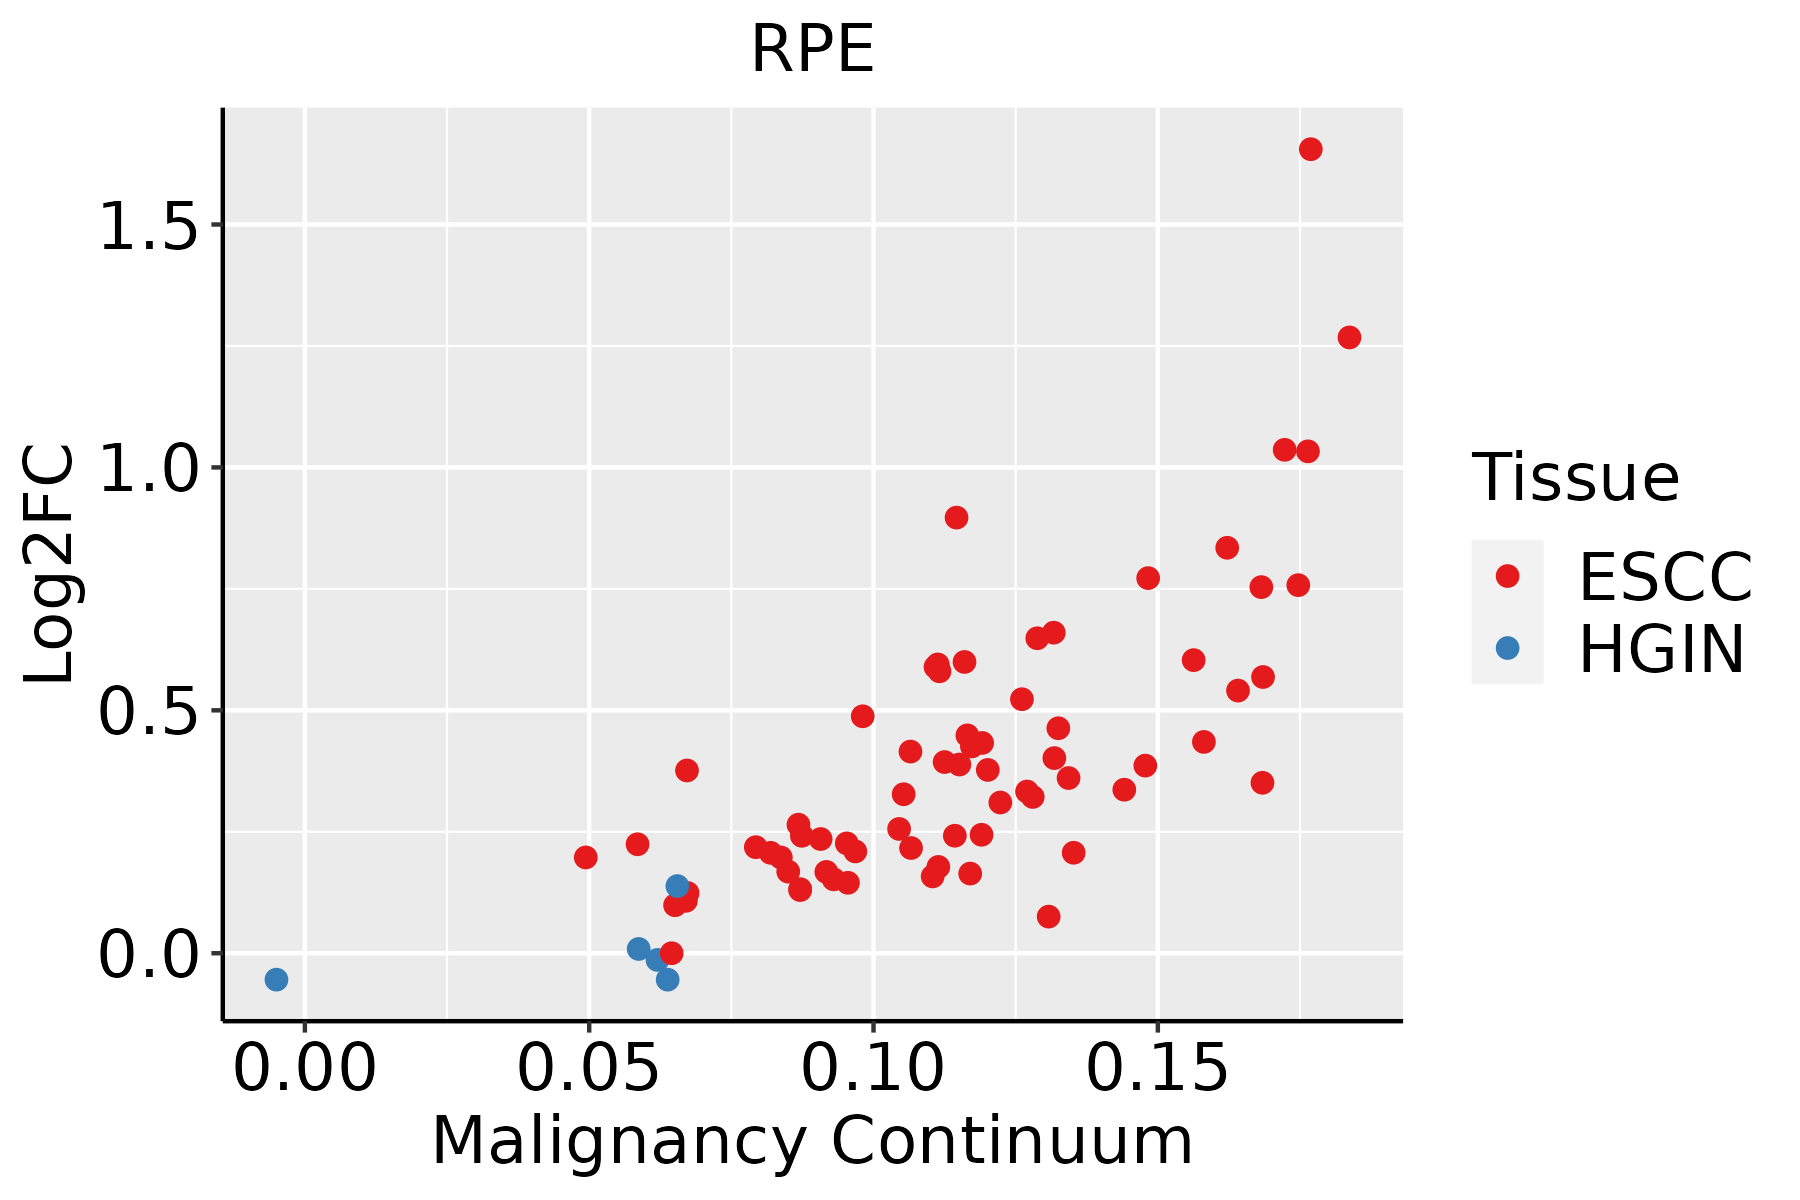 | ESCC: Esophageal squamous cell carcinoma |
| HGIN: High-grade intraepithelial neoplasias | ||
| LGIN: Low-grade intraepithelial neoplasias | ||
| Liver | 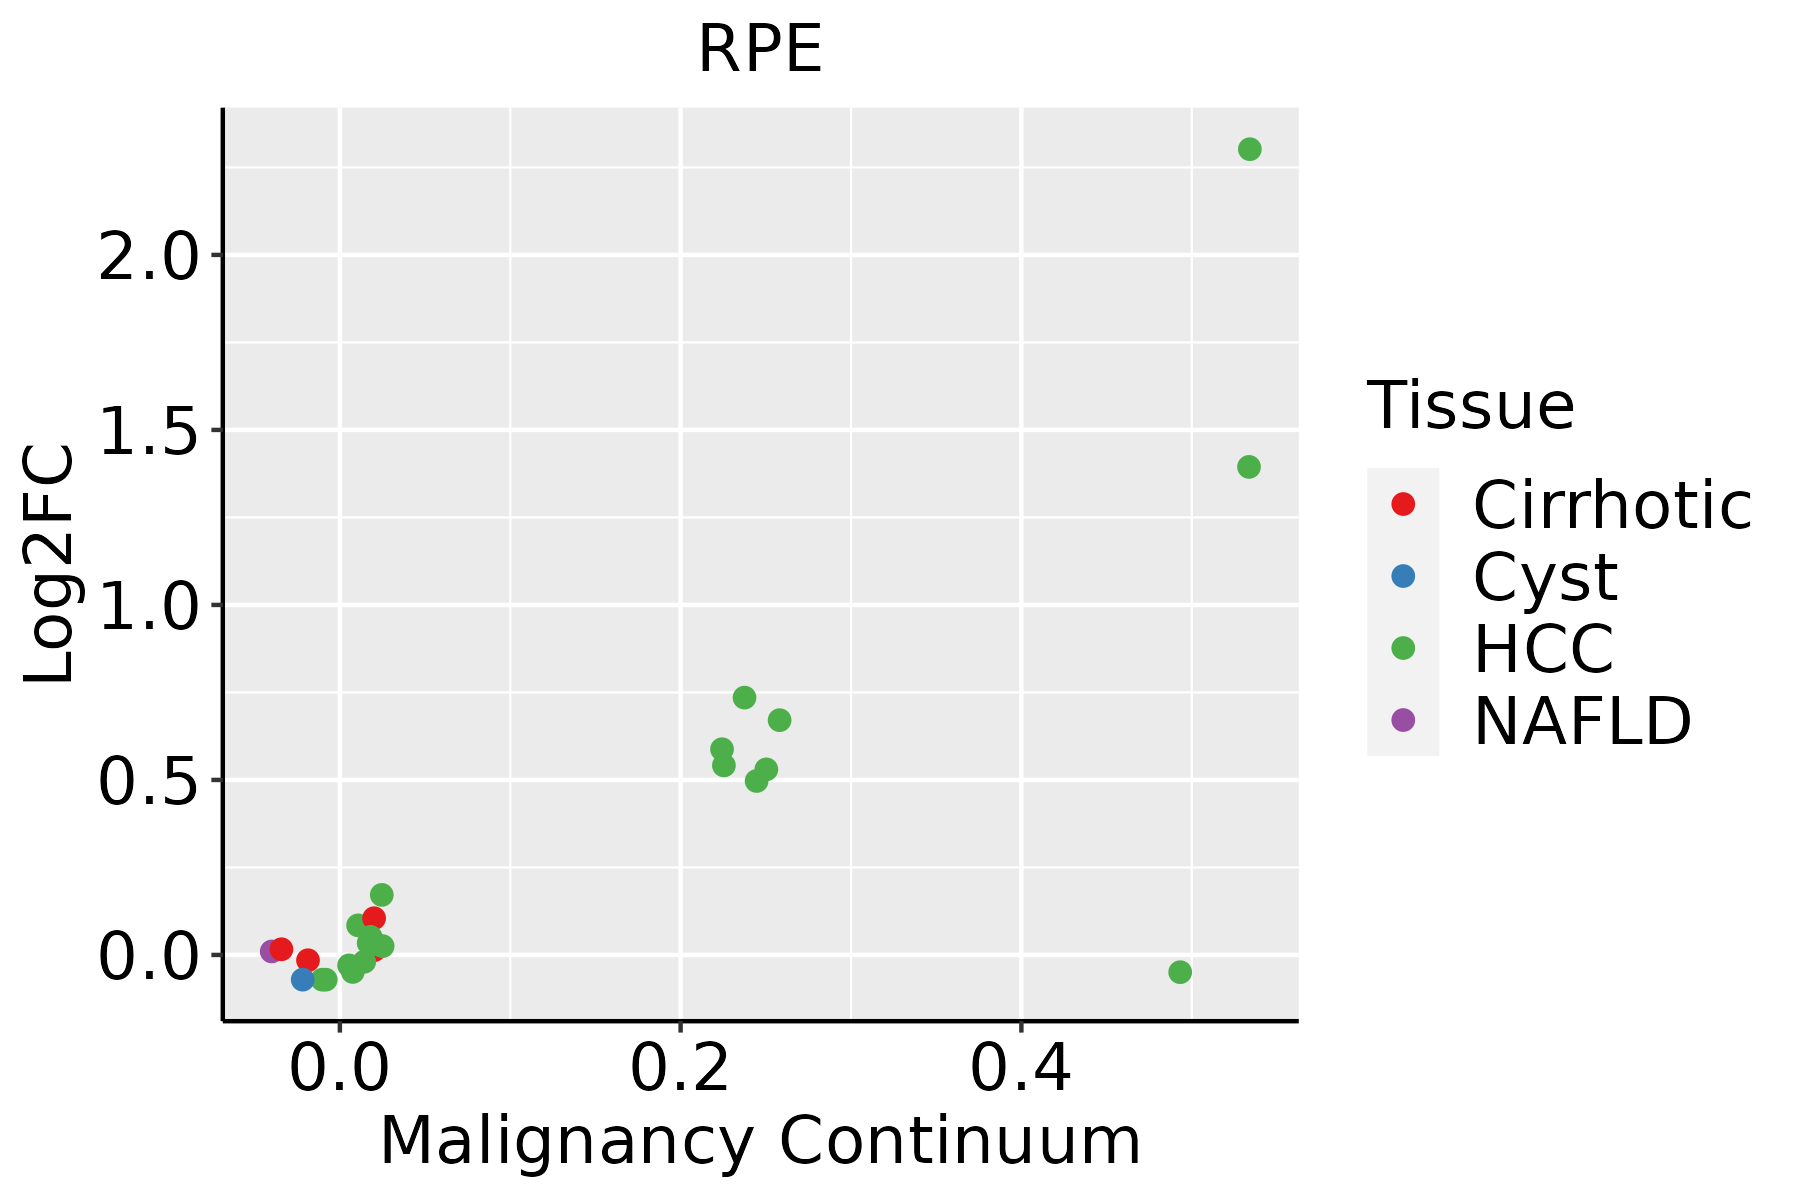 | HCC: Hepatocellular carcinoma |
| NAFLD: Non-alcoholic fatty liver disease | ||
| Oral Cavity | 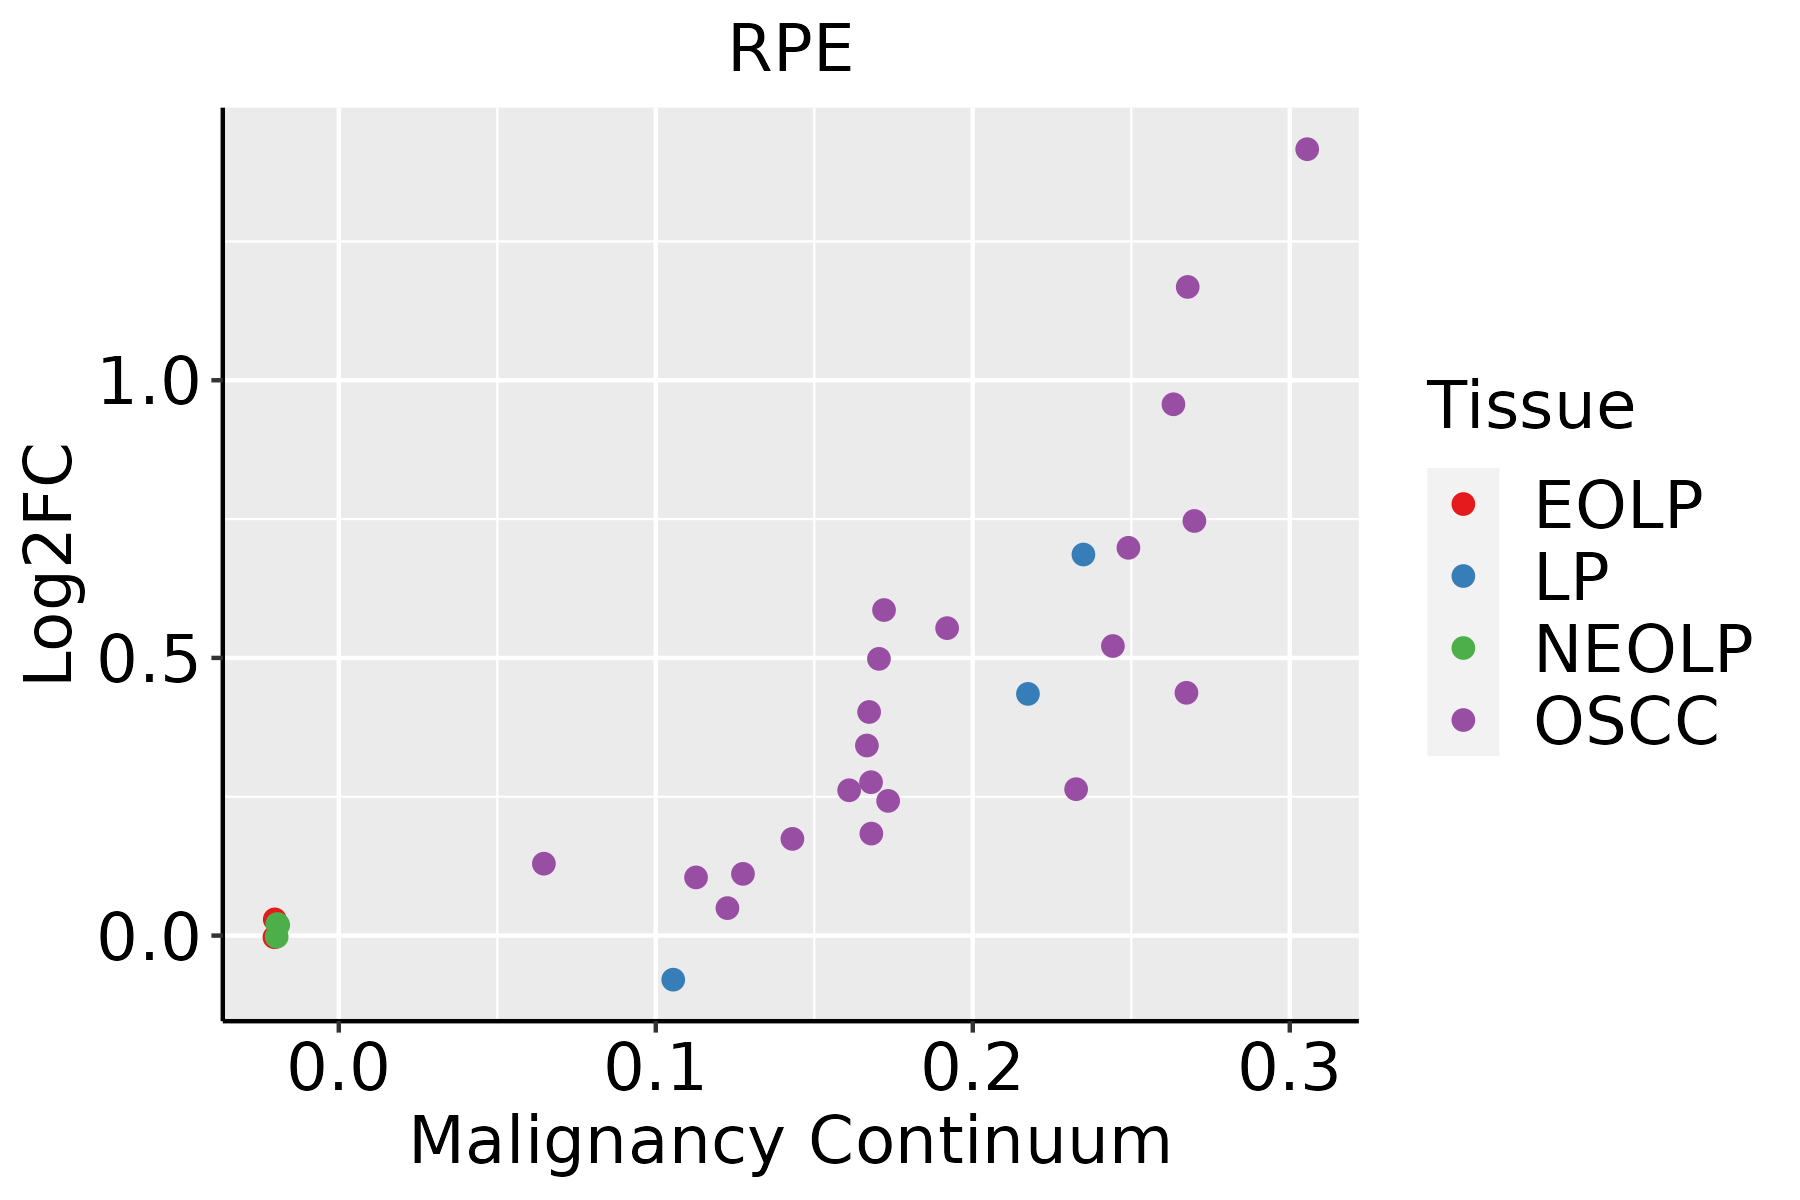 | EOLP: Erosive Oral lichen planus |
| LP: leukoplakia | ||
| NEOLP: Non-erosive oral lichen planus | ||
| OSCC: Oral squamous cell carcinoma | ||
| Skin | 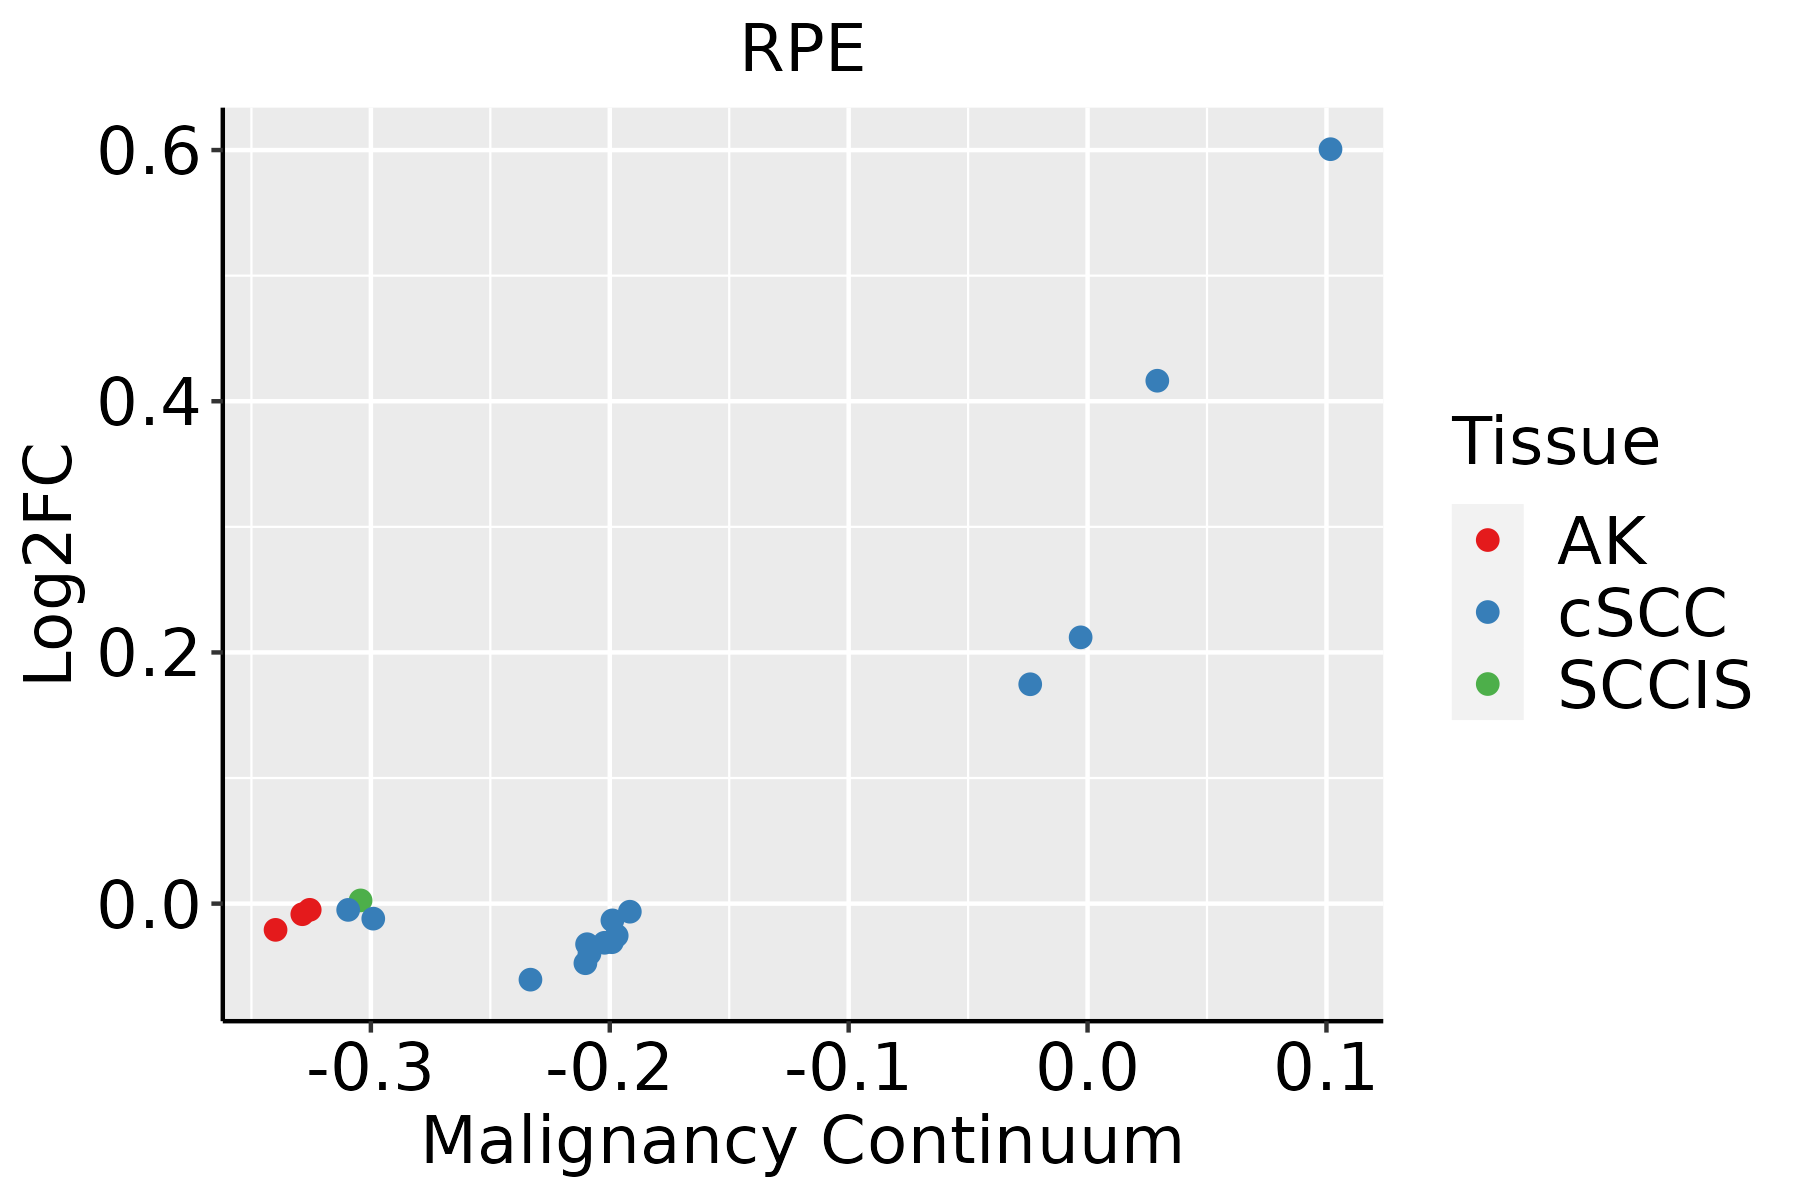 | AK: Actinic keratosis |
| cSCC: Cutaneous squamous cell carcinoma | ||
| SCCIS:squamous cell carcinoma in situ |
| ∗log2FC in expression of this searched gene in stem-like cells from each diseased tissue sample relative to stem-like cells in normal samples in each tissue plotted against the malignancy continuum. Samples are colored based on if they are from different disease stage. |
Top |
Malignant transformation related pathway analysis |
| Find out the enriched GO biological processes and KEGG pathways involved in transition from healthy to precancer to cancer |
| Tissue | Disease Stage | Enriched GO biological Processes |
| Colorectum | AD |  |
| Colorectum | SER |  |
| Colorectum | MSS |  |
| Colorectum | MSI-H |  |
| Colorectum | FAP |  |
| ∗Top 15 enriched GO BP terms are showed in the bar plot of each disease state in each tissue. Each row represents a significant GO biological process which is colored according to the -log10(p.adjust). |
| Page: 1 2 3 4 5 6 7 8 9 |
| GO ID | Tissue | Disease Stage | Description | Gene Ratio | Bg Ratio | pvalue | p.adjust | Count |
| GO:00226139 | Breast | Precancer | ribonucleoprotein complex biogenesis | 79/1080 | 463/18723 | 2.11e-18 | 1.03e-15 | 79 |
| GO:00718269 | Breast | Precancer | ribonucleoprotein complex subunit organization | 48/1080 | 227/18723 | 2.68e-15 | 8.45e-13 | 48 |
| GO:00226189 | Breast | Precancer | ribonucleoprotein complex assembly | 47/1080 | 220/18723 | 3.47e-15 | 1.03e-12 | 47 |
| GO:00083809 | Breast | Precancer | RNA splicing | 65/1080 | 434/18723 | 1.27e-12 | 2.53e-10 | 65 |
| GO:00003759 | Breast | Precancer | RNA splicing, via transesterification reactions | 52/1080 | 324/18723 | 1.74e-11 | 2.22e-09 | 52 |
| GO:00003779 | Breast | Precancer | RNA splicing, via transesterification reactions with bulged adenosine as nucleophile | 51/1080 | 320/18723 | 3.55e-11 | 4.04e-09 | 51 |
| GO:00003989 | Breast | Precancer | mRNA splicing, via spliceosome | 51/1080 | 320/18723 | 3.55e-11 | 4.04e-09 | 51 |
| GO:00003873 | Breast | Precancer | spliceosomal snRNP assembly | 10/1080 | 50/18723 | 4.86e-04 | 6.35e-03 | 10 |
| GO:002261314 | Breast | IDC | ribonucleoprotein complex biogenesis | 83/1434 | 463/18723 | 2.01e-13 | 5.20e-11 | 83 |
| GO:007182614 | Breast | IDC | ribonucleoprotein complex subunit organization | 52/1434 | 227/18723 | 5.18e-13 | 1.21e-10 | 52 |
| GO:002261814 | Breast | IDC | ribonucleoprotein complex assembly | 51/1434 | 220/18723 | 5.32e-13 | 1.21e-10 | 51 |
| GO:000838014 | Breast | IDC | RNA splicing | 73/1434 | 434/18723 | 1.27e-10 | 1.57e-08 | 73 |
| GO:000037514 | Breast | IDC | RNA splicing, via transesterification reactions | 58/1434 | 324/18723 | 9.44e-10 | 9.58e-08 | 58 |
| GO:000037714 | Breast | IDC | RNA splicing, via transesterification reactions with bulged adenosine as nucleophile | 57/1434 | 320/18723 | 1.60e-09 | 1.49e-07 | 57 |
| GO:000039814 | Breast | IDC | mRNA splicing, via spliceosome | 57/1434 | 320/18723 | 1.60e-09 | 1.49e-07 | 57 |
| GO:000038711 | Breast | IDC | spliceosomal snRNP assembly | 11/1434 | 50/18723 | 1.18e-03 | 1.28e-02 | 11 |
| GO:002261324 | Breast | DCIS | ribonucleoprotein complex biogenesis | 83/1390 | 463/18723 | 3.65e-14 | 1.09e-11 | 83 |
| GO:007182624 | Breast | DCIS | ribonucleoprotein complex subunit organization | 52/1390 | 227/18723 | 1.54e-13 | 3.95e-11 | 52 |
| GO:002261824 | Breast | DCIS | ribonucleoprotein complex assembly | 51/1390 | 220/18723 | 1.60e-13 | 3.95e-11 | 51 |
| GO:000838024 | Breast | DCIS | RNA splicing | 73/1390 | 434/18723 | 3.05e-11 | 5.08e-09 | 73 |
| Page: 1 2 3 4 5 6 7 8 9 10 11 12 13 14 15 16 17 18 19 |
| Pathway ID | Tissue | Disease Stage | Description | Gene Ratio | Bg Ratio | pvalue | p.adjust | qvalue | Count |
| hsa0120023 | Esophagus | ESCC | Carbon metabolism | 79/4205 | 115/8465 | 2.50e-05 | 1.21e-04 | 6.22e-05 | 79 |
| hsa0123023 | Esophagus | ESCC | Biosynthesis of amino acids | 49/4205 | 75/8465 | 4.35e-03 | 1.12e-02 | 5.74e-03 | 49 |
| hsa0120033 | Esophagus | ESCC | Carbon metabolism | 79/4205 | 115/8465 | 2.50e-05 | 1.21e-04 | 6.22e-05 | 79 |
| hsa0123033 | Esophagus | ESCC | Biosynthesis of amino acids | 49/4205 | 75/8465 | 4.35e-03 | 1.12e-02 | 5.74e-03 | 49 |
| hsa0120041 | Liver | HCC | Carbon metabolism | 89/4020 | 115/8465 | 3.92e-11 | 6.56e-10 | 3.65e-10 | 89 |
| hsa0123021 | Liver | HCC | Biosynthesis of amino acids | 53/4020 | 75/8465 | 3.79e-05 | 2.11e-04 | 1.18e-04 | 53 |
| hsa000302 | Liver | HCC | Pentose phosphate pathway | 21/4020 | 30/8465 | 1.06e-02 | 2.71e-02 | 1.51e-02 | 21 |
| hsa0120051 | Liver | HCC | Carbon metabolism | 89/4020 | 115/8465 | 3.92e-11 | 6.56e-10 | 3.65e-10 | 89 |
| hsa0123031 | Liver | HCC | Biosynthesis of amino acids | 53/4020 | 75/8465 | 3.79e-05 | 2.11e-04 | 1.18e-04 | 53 |
| hsa000303 | Liver | HCC | Pentose phosphate pathway | 21/4020 | 30/8465 | 1.06e-02 | 2.71e-02 | 1.51e-02 | 21 |
| hsa0120014 | Oral cavity | OSCC | Carbon metabolism | 74/3704 | 115/8465 | 6.10e-06 | 3.05e-05 | 1.55e-05 | 74 |
| hsa012305 | Oral cavity | OSCC | Biosynthesis of amino acids | 45/3704 | 75/8465 | 3.27e-03 | 8.23e-03 | 4.19e-03 | 45 |
| hsa0120015 | Oral cavity | OSCC | Carbon metabolism | 74/3704 | 115/8465 | 6.10e-06 | 3.05e-05 | 1.55e-05 | 74 |
| hsa0123012 | Oral cavity | OSCC | Biosynthesis of amino acids | 45/3704 | 75/8465 | 3.27e-03 | 8.23e-03 | 4.19e-03 | 45 |
| hsa0120022 | Oral cavity | LP | Carbon metabolism | 62/2418 | 115/8465 | 8.38e-09 | 1.39e-07 | 8.99e-08 | 62 |
| hsa0120032 | Oral cavity | LP | Carbon metabolism | 62/2418 | 115/8465 | 8.38e-09 | 1.39e-07 | 8.99e-08 | 62 |
| Page: 1 |
Top |
Cell-cell communication analysis |
| Identification of potential cell-cell interactions between two cell types and their ligand-receptor pairs for different disease states |
| Ligand | Receptor | LRpair | Pathway | Tissue | Disease Stage |
| Page: 1 |
Top |
Single-cell gene regulatory network inference analysis |
| Find out the significant the regulons (TFs) and the target genes of each regulon across cell types for different disease states |
| TF | Cell Type | Tissue | Disease Stage | Target Gene | RSS | Regulon Activity |
| ∗The dot plots of a searched regulon are shown for all cell subpopulations in each disease state of each tissue based on the regulon specific score inferred using pySCENIC and by calculating the average expression. |
| Page: 1 |
Top |
Somatic mutation of malignant transformation related genes |
| Annotation of somatic variants for genes involved in malignant transformation |
| Hugo Symbol | Variant Class | Variant Classification | dbSNP RS | HGVSc | HGVSp | HGVSp Short | SWISSPROT | BIOTYPE | SIFT | PolyPhen | Tumor Sample Barcode | Tissue | Histology | Sex | Age | Stage | Therapy Types | Drugs | Outcome |
| RPE | insertion | Nonsense_Mutation | novel | c.393_394insTTTTTTTTTTGAGATGGAGTCTCGCTCTGTCGCCCA | p.Trp131_Ala132insPhePhePheTerAspGlyValSerLeuCysArgPro | p.W131_A132insFFF*DGVSLCRP | Q96AT9 | protein_coding | TCGA-BH-A0AY-01 | Breast | breast invasive carcinoma | Female | <65 | I/II | Chemotherapy | SD | |||
| RPE | SNV | Missense_Mutation | rs535548466 | c.326N>A | p.Arg109Gln | p.R109Q | Q96AT9 | protein_coding | tolerated(0.17) | benign(0.096) | TCGA-VS-A9UM-01 | Cervix | cervical & endocervical cancer | Female | <65 | I/II | Chemotherapy | cisplatin | CR |
| RPE | SNV | Missense_Mutation | rs138496299 | c.325C>T | p.Arg109Trp | p.R109W | Q96AT9 | protein_coding | deleterious(0.01) | benign(0.291) | TCGA-AA-A00N-01 | Colorectum | colon adenocarcinoma | Male | >=65 | I/II | Unknown | Unknown | PD |
| RPE | SNV | Missense_Mutation | c.559N>A | p.Ala187Thr | p.A187T | Q96AT9 | protein_coding | deleterious(0.02) | probably_damaging(0.954) | TCGA-AA-A02Y-01 | Colorectum | colon adenocarcinoma | Male | >=65 | I/II | Unknown | Unknown | SD | |
| RPE | SNV | Missense_Mutation | novel | c.173N>A | p.Arg58Gln | p.R58Q | Q96AT9 | protein_coding | deleterious(0.02) | possibly_damaging(0.882) | TCGA-CA-6717-01 | Colorectum | colon adenocarcinoma | Male | <65 | I/II | Chemotherapy | oxaliplatin | CR |
| RPE | SNV | Missense_Mutation | novel | c.173N>A | p.Arg58Gln | p.R58Q | Q96AT9 | protein_coding | deleterious(0.02) | possibly_damaging(0.882) | TCGA-A5-A0G1-01 | Endometrium | uterine corpus endometrioid carcinoma | Female | >=65 | I/II | Unknown | Unknown | SD |
| RPE | SNV | Missense_Mutation | novel | c.647N>C | p.Val216Ala | p.V216A | Q96AT9 | protein_coding | tolerated(1) | benign(0.001) | TCGA-A5-A0G2-01 | Endometrium | uterine corpus endometrioid carcinoma | Female | <65 | III/IV | Unknown | Unknown | SD |
| RPE | SNV | Missense_Mutation | novel | c.173N>A | p.Arg58Gln | p.R58Q | Q96AT9 | protein_coding | deleterious(0.02) | possibly_damaging(0.882) | TCGA-AJ-A3EL-01 | Endometrium | uterine corpus endometrioid carcinoma | Female | <65 | I/II | Unknown | Unknown | SD |
| RPE | SNV | Missense_Mutation | c.596N>A | p.Ala199Asp | p.A199D | Q96AT9 | protein_coding | deleterious(0) | probably_damaging(0.909) | TCGA-AP-A051-01 | Endometrium | uterine corpus endometrioid carcinoma | Female | >=65 | I/II | Unknown | Unknown | SD | |
| RPE | SNV | Missense_Mutation | novel | c.215T>C | p.Met72Thr | p.M72T | Q96AT9 | protein_coding | deleterious(0) | probably_damaging(1) | TCGA-AP-A054-01 | Endometrium | uterine corpus endometrioid carcinoma | Female | <65 | III/IV | Chemotherapy | carboplatin | PD |
| Page: 1 2 3 4 |
Top |
Related drugs of malignant transformation related genes |
| Identification of chemicals and drugs interact with genes involved in malignant transfromation |
| (DGIdb 4.0) |
| Entrez ID | Symbol | Category | Interaction Types | Drug Claim Name | Drug Name | PMIDs |
| Page: 1 |

Copyright 2023-Present -The University of Texas Health Science Center at Houston |