
|
|||||
|
 | |
| |
| |
| |
| |
| |
|
Gene: RPAP3 |
Gene summary for RPAP3 |
| Gene information | Species | Human | Gene symbol | RPAP3 | Gene ID | 79657 |
| Gene name | RNA polymerase II associated protein 3 | |
| Gene Alias | Tah1 | |
| Cytomap | 12q13.11 | |
| Gene Type | protein-coding | GO ID | GO:0005575 | UniProtAcc | Q9H6T3 |
Top |
Malignant transformation analysis |
| Identification of the aberrant gene expression in precancerous and cancerous lesions by comparing the gene expression of stem-like cells in diseased tissues with normal stem cells |
| Entrez ID | Symbol | Replicates | Species | Organ | Tissue | Adj P-value | Log2FC | Malignancy |
| 79657 | RPAP3 | LZE4T | Human | Esophagus | ESCC | 2.54e-06 | 2.19e-01 | 0.0811 |
| 79657 | RPAP3 | LZE7T | Human | Esophagus | ESCC | 6.86e-04 | 6.19e-01 | 0.0667 |
| 79657 | RPAP3 | LZE8T | Human | Esophagus | ESCC | 8.51e-04 | 1.86e-01 | 0.067 |
| 79657 | RPAP3 | LZE20T | Human | Esophagus | ESCC | 1.02e-13 | 6.99e-01 | 0.0662 |
| 79657 | RPAP3 | LZE24T | Human | Esophagus | ESCC | 2.02e-13 | 4.16e-01 | 0.0596 |
| 79657 | RPAP3 | P1T-E | Human | Esophagus | ESCC | 1.05e-03 | 3.35e-01 | 0.0875 |
| 79657 | RPAP3 | P2T-E | Human | Esophagus | ESCC | 5.04e-29 | 5.62e-01 | 0.1177 |
| 79657 | RPAP3 | P4T-E | Human | Esophagus | ESCC | 1.84e-21 | 4.75e-01 | 0.1323 |
| 79657 | RPAP3 | P5T-E | Human | Esophagus | ESCC | 3.24e-35 | 7.33e-01 | 0.1327 |
| 79657 | RPAP3 | P8T-E | Human | Esophagus | ESCC | 1.18e-21 | 3.38e-01 | 0.0889 |
| 79657 | RPAP3 | P9T-E | Human | Esophagus | ESCC | 5.78e-14 | 2.29e-01 | 0.1131 |
| 79657 | RPAP3 | P10T-E | Human | Esophagus | ESCC | 2.67e-13 | 2.83e-01 | 0.116 |
| 79657 | RPAP3 | P11T-E | Human | Esophagus | ESCC | 1.04e-02 | 2.42e-01 | 0.1426 |
| 79657 | RPAP3 | P12T-E | Human | Esophagus | ESCC | 1.83e-16 | 3.08e-01 | 0.1122 |
| 79657 | RPAP3 | P15T-E | Human | Esophagus | ESCC | 1.53e-21 | 4.01e-01 | 0.1149 |
| 79657 | RPAP3 | P16T-E | Human | Esophagus | ESCC | 4.36e-16 | 3.18e-01 | 0.1153 |
| 79657 | RPAP3 | P17T-E | Human | Esophagus | ESCC | 3.33e-03 | 3.49e-01 | 0.1278 |
| 79657 | RPAP3 | P19T-E | Human | Esophagus | ESCC | 6.29e-07 | 6.18e-01 | 0.1662 |
| 79657 | RPAP3 | P20T-E | Human | Esophagus | ESCC | 7.30e-17 | 3.94e-01 | 0.1124 |
| 79657 | RPAP3 | P21T-E | Human | Esophagus | ESCC | 1.37e-22 | 4.48e-01 | 0.1617 |
| Page: 1 2 3 4 5 |
| Tissue | Expression Dynamics | Abbreviation |
| Esophagus | 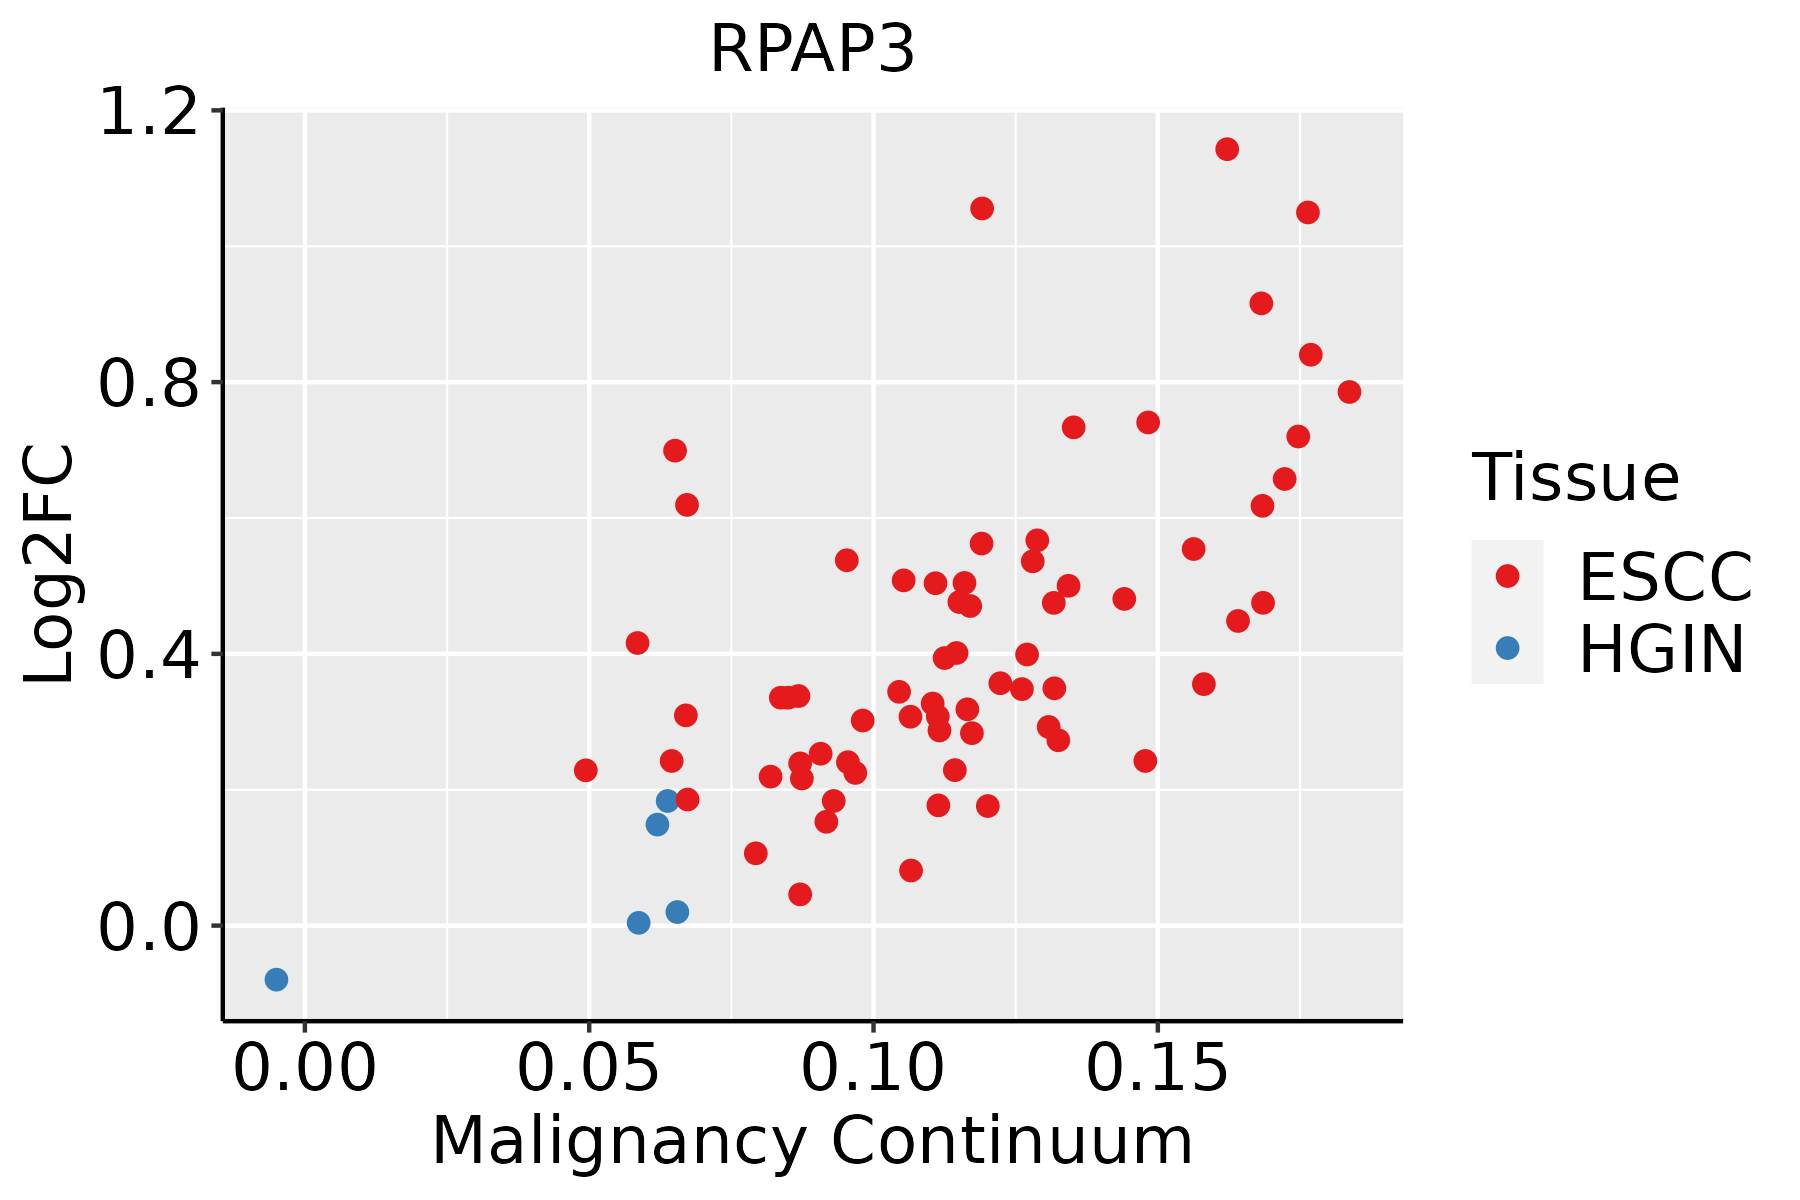 | ESCC: Esophageal squamous cell carcinoma |
| HGIN: High-grade intraepithelial neoplasias | ||
| LGIN: Low-grade intraepithelial neoplasias | ||
| Liver | 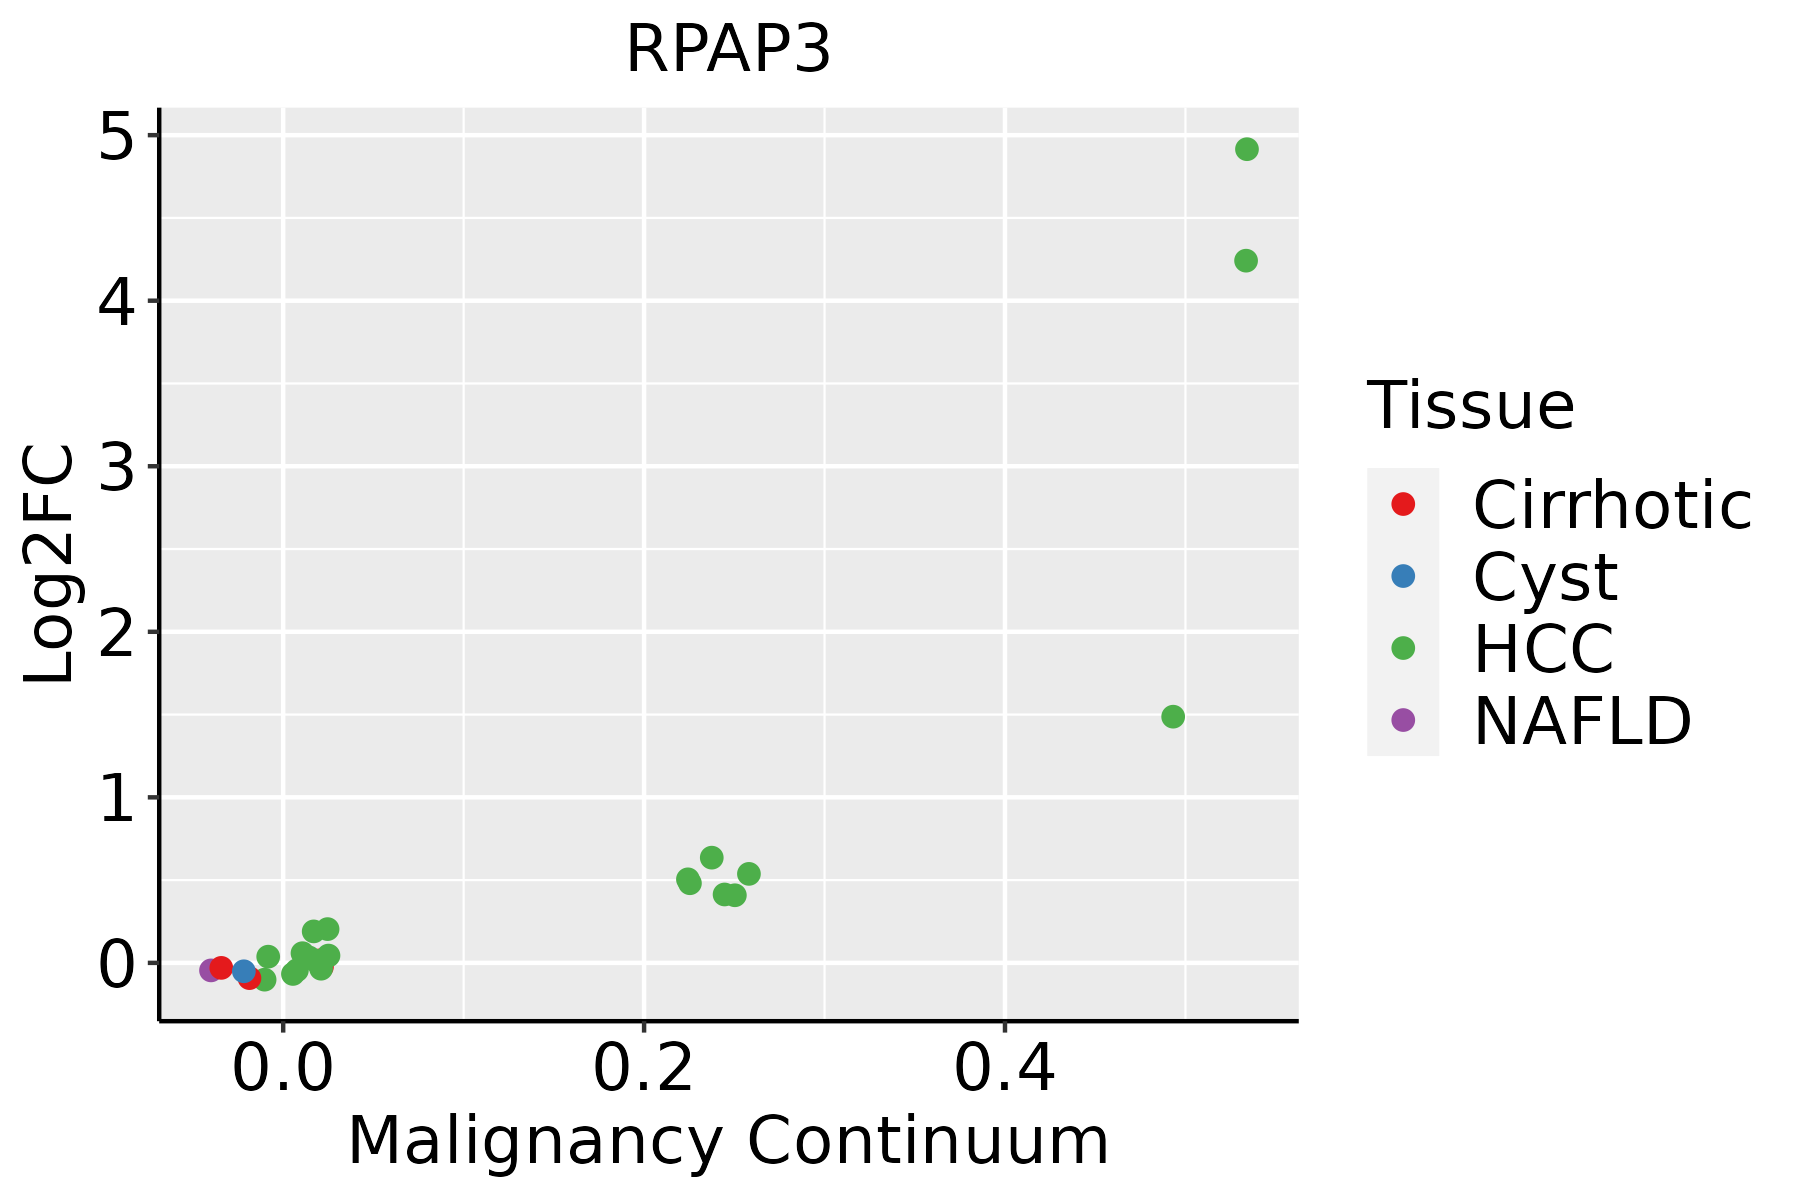 | HCC: Hepatocellular carcinoma |
| NAFLD: Non-alcoholic fatty liver disease | ||
| Oral Cavity | 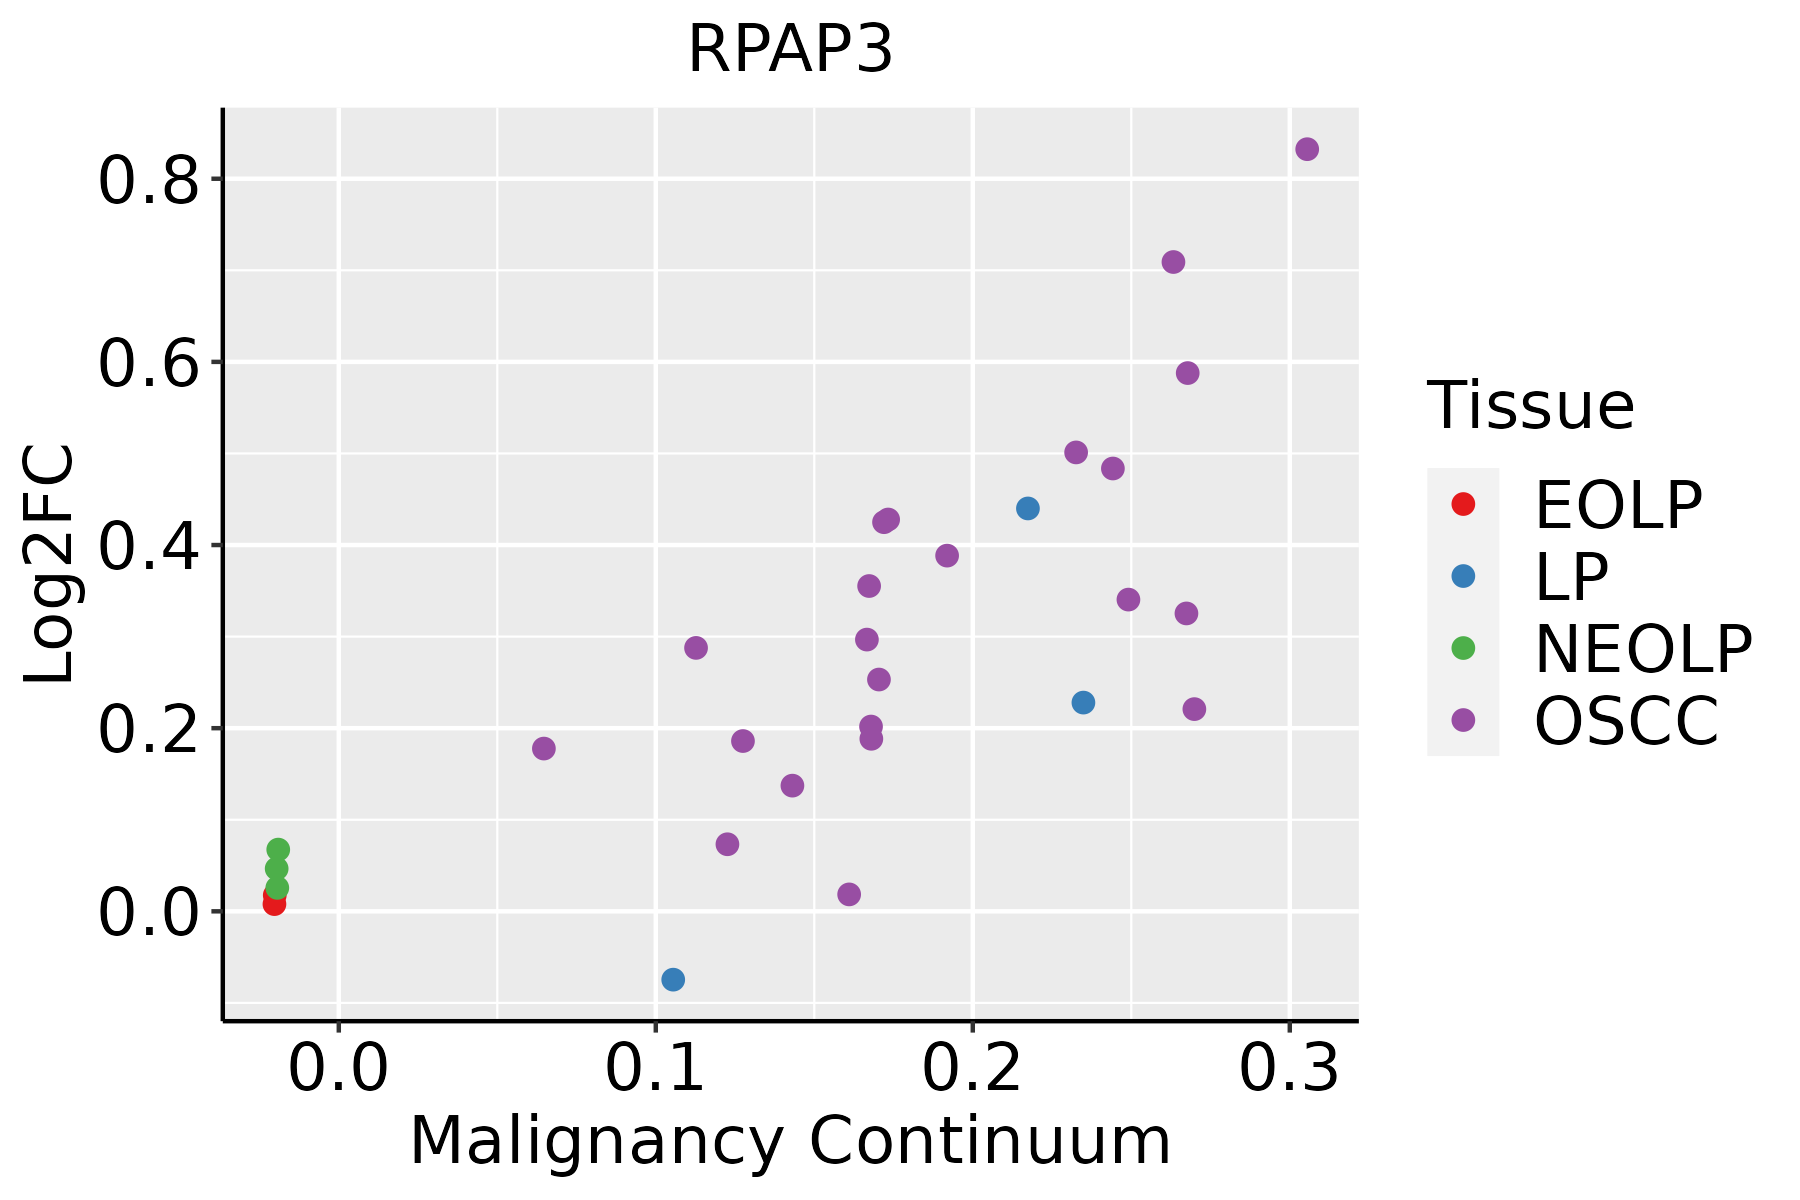 | EOLP: Erosive Oral lichen planus |
| LP: leukoplakia | ||
| NEOLP: Non-erosive oral lichen planus | ||
| OSCC: Oral squamous cell carcinoma | ||
| Skin |  | AK: Actinic keratosis |
| cSCC: Cutaneous squamous cell carcinoma | ||
| SCCIS:squamous cell carcinoma in situ | ||
| Thyroid | 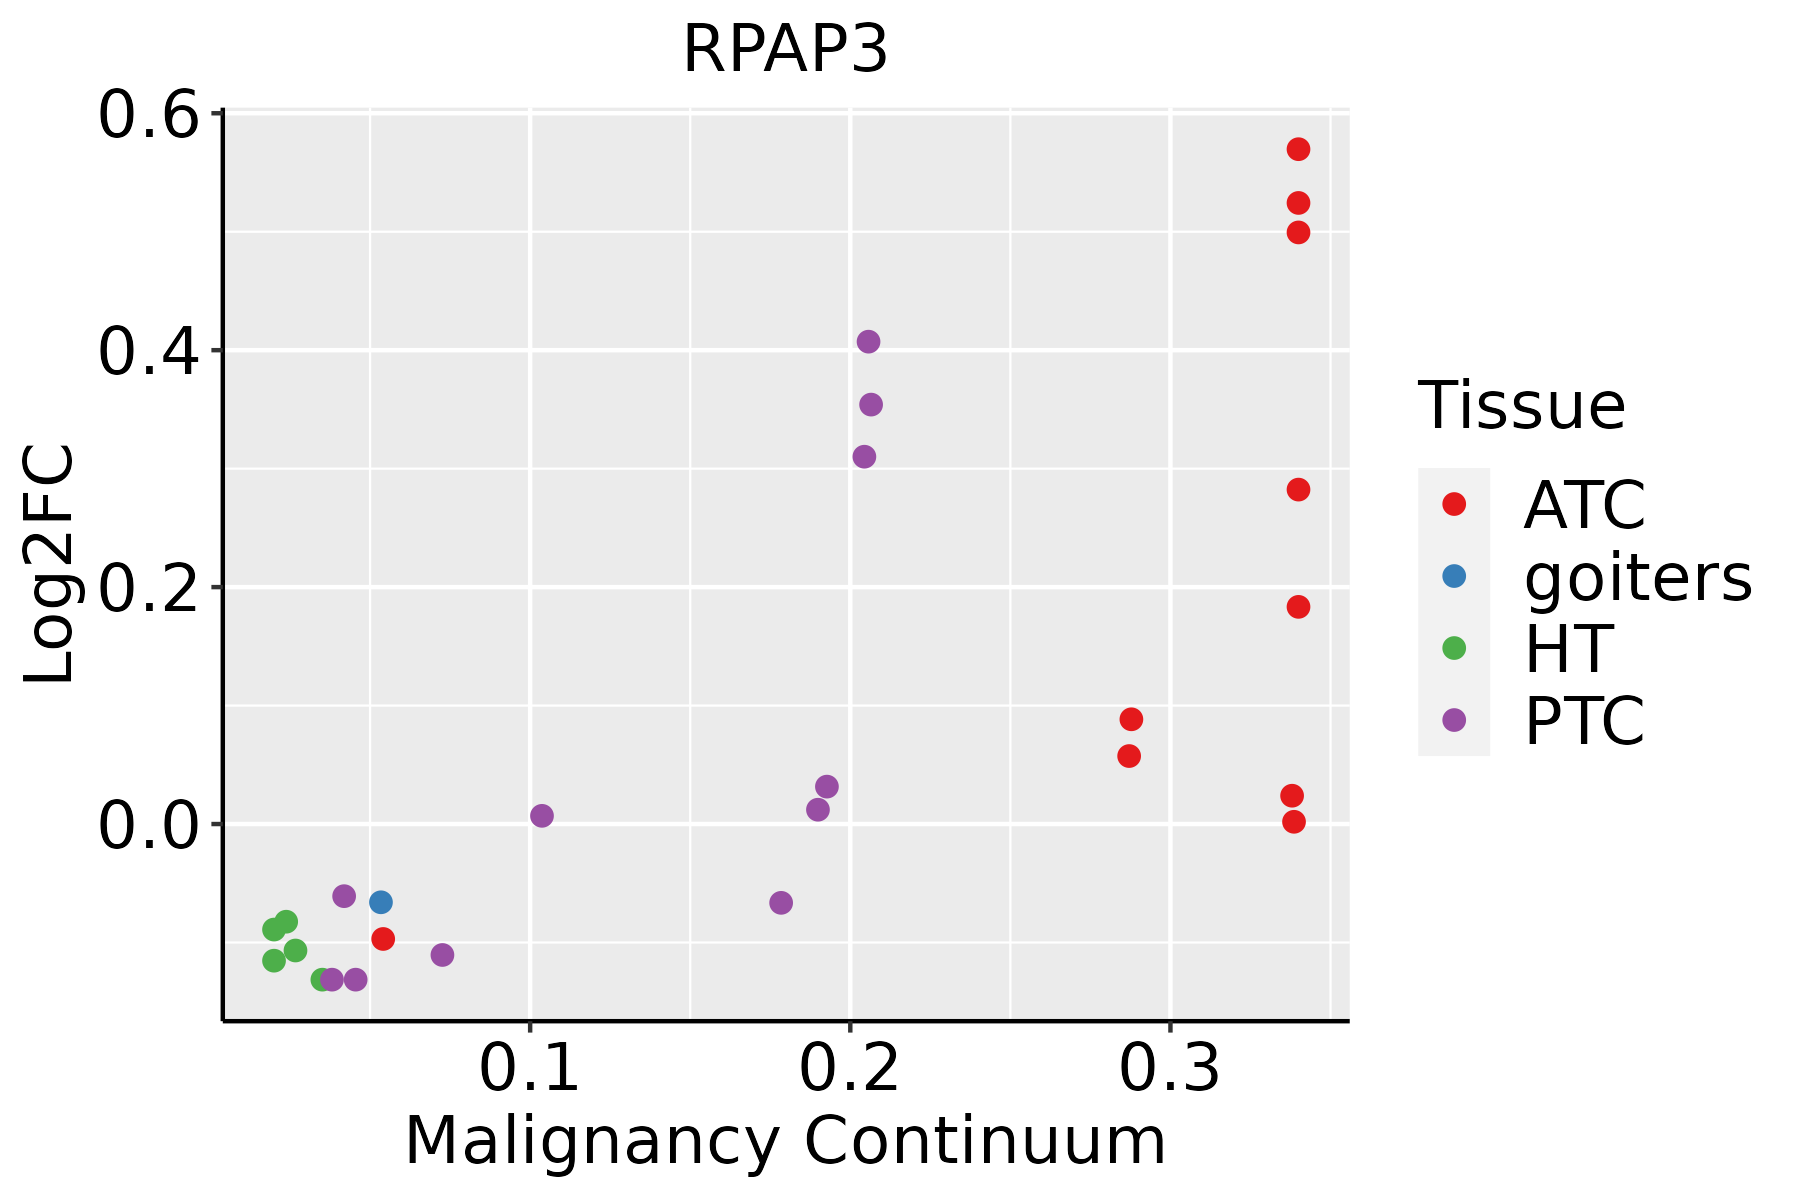 | ATC: Anaplastic thyroid cancer |
| HT: Hashimoto's thyroiditis | ||
| PTC: Papillary thyroid cancer |
| ∗log2FC in expression of this searched gene in stem-like cells from each diseased tissue sample relative to stem-like cells in normal samples in each tissue plotted against the malignancy continuum. Samples are colored based on if they are from different disease stage. |
Top |
Malignant transformation related pathway analysis |
| Find out the enriched GO biological processes and KEGG pathways involved in transition from healthy to precancer to cancer |
| Tissue | Disease Stage | Enriched GO biological Processes |
| Colorectum | AD |  |
| Colorectum | SER |  |
| Colorectum | MSS |  |
| Colorectum | MSI-H |  |
| Colorectum | FAP |  |
| ∗Top 15 enriched GO BP terms are showed in the bar plot of each disease state in each tissue. Each row represents a significant GO biological process which is colored according to the -log10(p.adjust). |
| Page: 1 2 3 4 5 6 7 8 9 |
| GO ID | Tissue | Disease Stage | Description | Gene Ratio | Bg Ratio | pvalue | p.adjust | Count |
| Page: 1 |
| Pathway ID | Tissue | Disease Stage | Description | Gene Ratio | Bg Ratio | pvalue | p.adjust | qvalue | Count |
| Page: 1 |
Top |
Cell-cell communication analysis |
| Identification of potential cell-cell interactions between two cell types and their ligand-receptor pairs for different disease states |
| Ligand | Receptor | LRpair | Pathway | Tissue | Disease Stage |
| Page: 1 |
Top |
Single-cell gene regulatory network inference analysis |
| Find out the significant the regulons (TFs) and the target genes of each regulon across cell types for different disease states |
| TF | Cell Type | Tissue | Disease Stage | Target Gene | RSS | Regulon Activity |
| ∗The dot plots of a searched regulon are shown for all cell subpopulations in each disease state of each tissue based on the regulon specific score inferred using pySCENIC and by calculating the average expression. |
| Page: 1 |
Top |
Somatic mutation of malignant transformation related genes |
| Annotation of somatic variants for genes involved in malignant transformation |
| Hugo Symbol | Variant Class | Variant Classification | dbSNP RS | HGVSc | HGVSp | HGVSp Short | SWISSPROT | BIOTYPE | SIFT | PolyPhen | Tumor Sample Barcode | Tissue | Histology | Sex | Age | Stage | Therapy Types | Drugs | Outcome |
| RPAP3 | SNV | Missense_Mutation | rs777789963 | c.1657N>A | p.Glu553Lys | p.E553K | Q9H6T3 | protein_coding | deleterious(0) | probably_damaging(1) | TCGA-AN-A046-01 | Breast | breast invasive carcinoma | Female | >=65 | I/II | Unknown | Unknown | SD |
| RPAP3 | SNV | Missense_Mutation | novel | c.170N>A | p.Arg57Gln | p.R57Q | Q9H6T3 | protein_coding | deleterious(0) | probably_damaging(0.999) | TCGA-AN-A046-01 | Breast | breast invasive carcinoma | Female | >=65 | I/II | Unknown | Unknown | SD |
| RPAP3 | SNV | Missense_Mutation | c.325N>T | p.Asp109Tyr | p.D109Y | Q9H6T3 | protein_coding | deleterious(0) | possibly_damaging(0.854) | TCGA-BH-A0DT-01 | Breast | breast invasive carcinoma | Female | <65 | I/II | Chemotherapy | taxotere | CR | |
| RPAP3 | SNV | Missense_Mutation | novel | c.1516N>C | p.Ser506Pro | p.S506P | Q9H6T3 | protein_coding | tolerated(0.38) | benign(0.001) | TCGA-PL-A8LZ-01 | Breast | breast invasive carcinoma | Female | <65 | III/IV | Chemotherapy | paclitaxel | SD |
| RPAP3 | SNV | Missense_Mutation | c.1779N>C | p.Gln593His | p.Q593H | Q9H6T3 | protein_coding | deleterious(0.01) | possibly_damaging(0.879) | TCGA-IR-A3LH-01 | Cervix | cervical & endocervical cancer | Female | <65 | I/II | Chemotherapy | cisplatin | CR | |
| RPAP3 | SNV | Missense_Mutation | rs749599471 | c.1271C>T | p.Pro424Leu | p.P424L | Q9H6T3 | protein_coding | tolerated(0.4) | benign(0) | TCGA-AA-3672-01 | Colorectum | colon adenocarcinoma | Female | >=65 | III/IV | Unknown | Unknown | SD |
| RPAP3 | SNV | Missense_Mutation | rs775098141 | c.521N>T | p.Ala174Val | p.A174V | Q9H6T3 | protein_coding | deleterious(0) | probably_damaging(0.95) | TCGA-AA-3811-01 | Colorectum | colon adenocarcinoma | Female | >=65 | III/IV | Unknown | Unknown | PD |
| RPAP3 | SNV | Missense_Mutation | novel | c.170N>A | p.Arg57Gln | p.R57Q | Q9H6T3 | protein_coding | deleterious(0) | probably_damaging(0.999) | TCGA-AA-3984-01 | Colorectum | colon adenocarcinoma | Female | <65 | I/II | Unknown | Unknown | SD |
| RPAP3 | SNV | Missense_Mutation | novel | c.1418N>T | p.Gly473Val | p.G473V | Q9H6T3 | protein_coding | tolerated(0.31) | benign(0) | TCGA-AM-5820-01 | Colorectum | colon adenocarcinoma | Female | <65 | I/II | Unknown | Unknown | SD |
| RPAP3 | SNV | Missense_Mutation | rs368272179 | c.520G>A | p.Ala174Thr | p.A174T | Q9H6T3 | protein_coding | deleterious(0) | probably_damaging(0.984) | TCGA-AZ-6598-01 | Colorectum | colon adenocarcinoma | Female | >=65 | I/II | Unknown | Unknown | SD |
| Page: 1 2 3 4 5 6 |
Top |
Related drugs of malignant transformation related genes |
| Identification of chemicals and drugs interact with genes involved in malignant transfromation |
| (DGIdb 4.0) |
| Entrez ID | Symbol | Category | Interaction Types | Drug Claim Name | Drug Name | PMIDs |
| Page: 1 |

Copyright 2023-Present -The University of Texas Health Science Center at Houston |