
|
|||||
|
 | |
| |
| |
| |
| |
| |
|
Gene: RPAP2 |
Gene summary for RPAP2 |
| Gene information | Species | Human | Gene symbol | RPAP2 | Gene ID | 79871 |
| Gene name | RNA polymerase II associated protein 2 | |
| Gene Alias | C1orf82 | |
| Cytomap | 1p22.1 | |
| Gene Type | protein-coding | GO ID | GO:0006139 | UniProtAcc | Q8IXW5 |
Top |
Malignant transformation analysis |
| Identification of the aberrant gene expression in precancerous and cancerous lesions by comparing the gene expression of stem-like cells in diseased tissues with normal stem cells |
| Entrez ID | Symbol | Replicates | Species | Organ | Tissue | Adj P-value | Log2FC | Malignancy |
| 79871 | RPAP2 | LZE2T | Human | Esophagus | ESCC | 1.30e-03 | 3.30e-01 | 0.082 |
| 79871 | RPAP2 | LZE4T | Human | Esophagus | ESCC | 2.19e-09 | 2.75e-01 | 0.0811 |
| 79871 | RPAP2 | LZE5T | Human | Esophagus | ESCC | 6.08e-03 | 1.90e-01 | 0.0514 |
| 79871 | RPAP2 | LZE7T | Human | Esophagus | ESCC | 5.20e-10 | 4.13e-01 | 0.0667 |
| 79871 | RPAP2 | LZE8T | Human | Esophagus | ESCC | 2.85e-03 | 1.34e-01 | 0.067 |
| 79871 | RPAP2 | LZE20T | Human | Esophagus | ESCC | 7.18e-06 | 1.97e-01 | 0.0662 |
| 79871 | RPAP2 | LZE24T | Human | Esophagus | ESCC | 1.82e-11 | 2.33e-01 | 0.0596 |
| 79871 | RPAP2 | LZE6T | Human | Esophagus | ESCC | 3.20e-02 | 1.55e-01 | 0.0845 |
| 79871 | RPAP2 | P1T-E | Human | Esophagus | ESCC | 1.86e-09 | 3.82e-01 | 0.0875 |
| 79871 | RPAP2 | P2T-E | Human | Esophagus | ESCC | 1.46e-33 | 6.35e-01 | 0.1177 |
| 79871 | RPAP2 | P4T-E | Human | Esophagus | ESCC | 1.91e-14 | 3.65e-01 | 0.1323 |
| 79871 | RPAP2 | P5T-E | Human | Esophagus | ESCC | 1.76e-28 | 3.21e-01 | 0.1327 |
| 79871 | RPAP2 | P8T-E | Human | Esophagus | ESCC | 1.71e-24 | 4.61e-01 | 0.0889 |
| 79871 | RPAP2 | P9T-E | Human | Esophagus | ESCC | 6.82e-14 | 2.70e-01 | 0.1131 |
| 79871 | RPAP2 | P10T-E | Human | Esophagus | ESCC | 7.47e-37 | 5.63e-01 | 0.116 |
| 79871 | RPAP2 | P11T-E | Human | Esophagus | ESCC | 2.20e-17 | 5.75e-01 | 0.1426 |
| 79871 | RPAP2 | P12T-E | Human | Esophagus | ESCC | 2.82e-97 | 1.82e+00 | 0.1122 |
| 79871 | RPAP2 | P15T-E | Human | Esophagus | ESCC | 7.14e-22 | 4.48e-01 | 0.1149 |
| 79871 | RPAP2 | P16T-E | Human | Esophagus | ESCC | 9.39e-35 | 3.87e-01 | 0.1153 |
| 79871 | RPAP2 | P17T-E | Human | Esophagus | ESCC | 7.19e-10 | 3.11e-01 | 0.1278 |
| Page: 1 2 3 4 5 |
| Tissue | Expression Dynamics | Abbreviation |
| Esophagus |  | ESCC: Esophageal squamous cell carcinoma |
| HGIN: High-grade intraepithelial neoplasias | ||
| LGIN: Low-grade intraepithelial neoplasias | ||
| Lung |  | AAH: Atypical adenomatous hyperplasia |
| AIS: Adenocarcinoma in situ | ||
| IAC: Invasive lung adenocarcinoma | ||
| MIA: Minimally invasive adenocarcinoma | ||
| Skin | 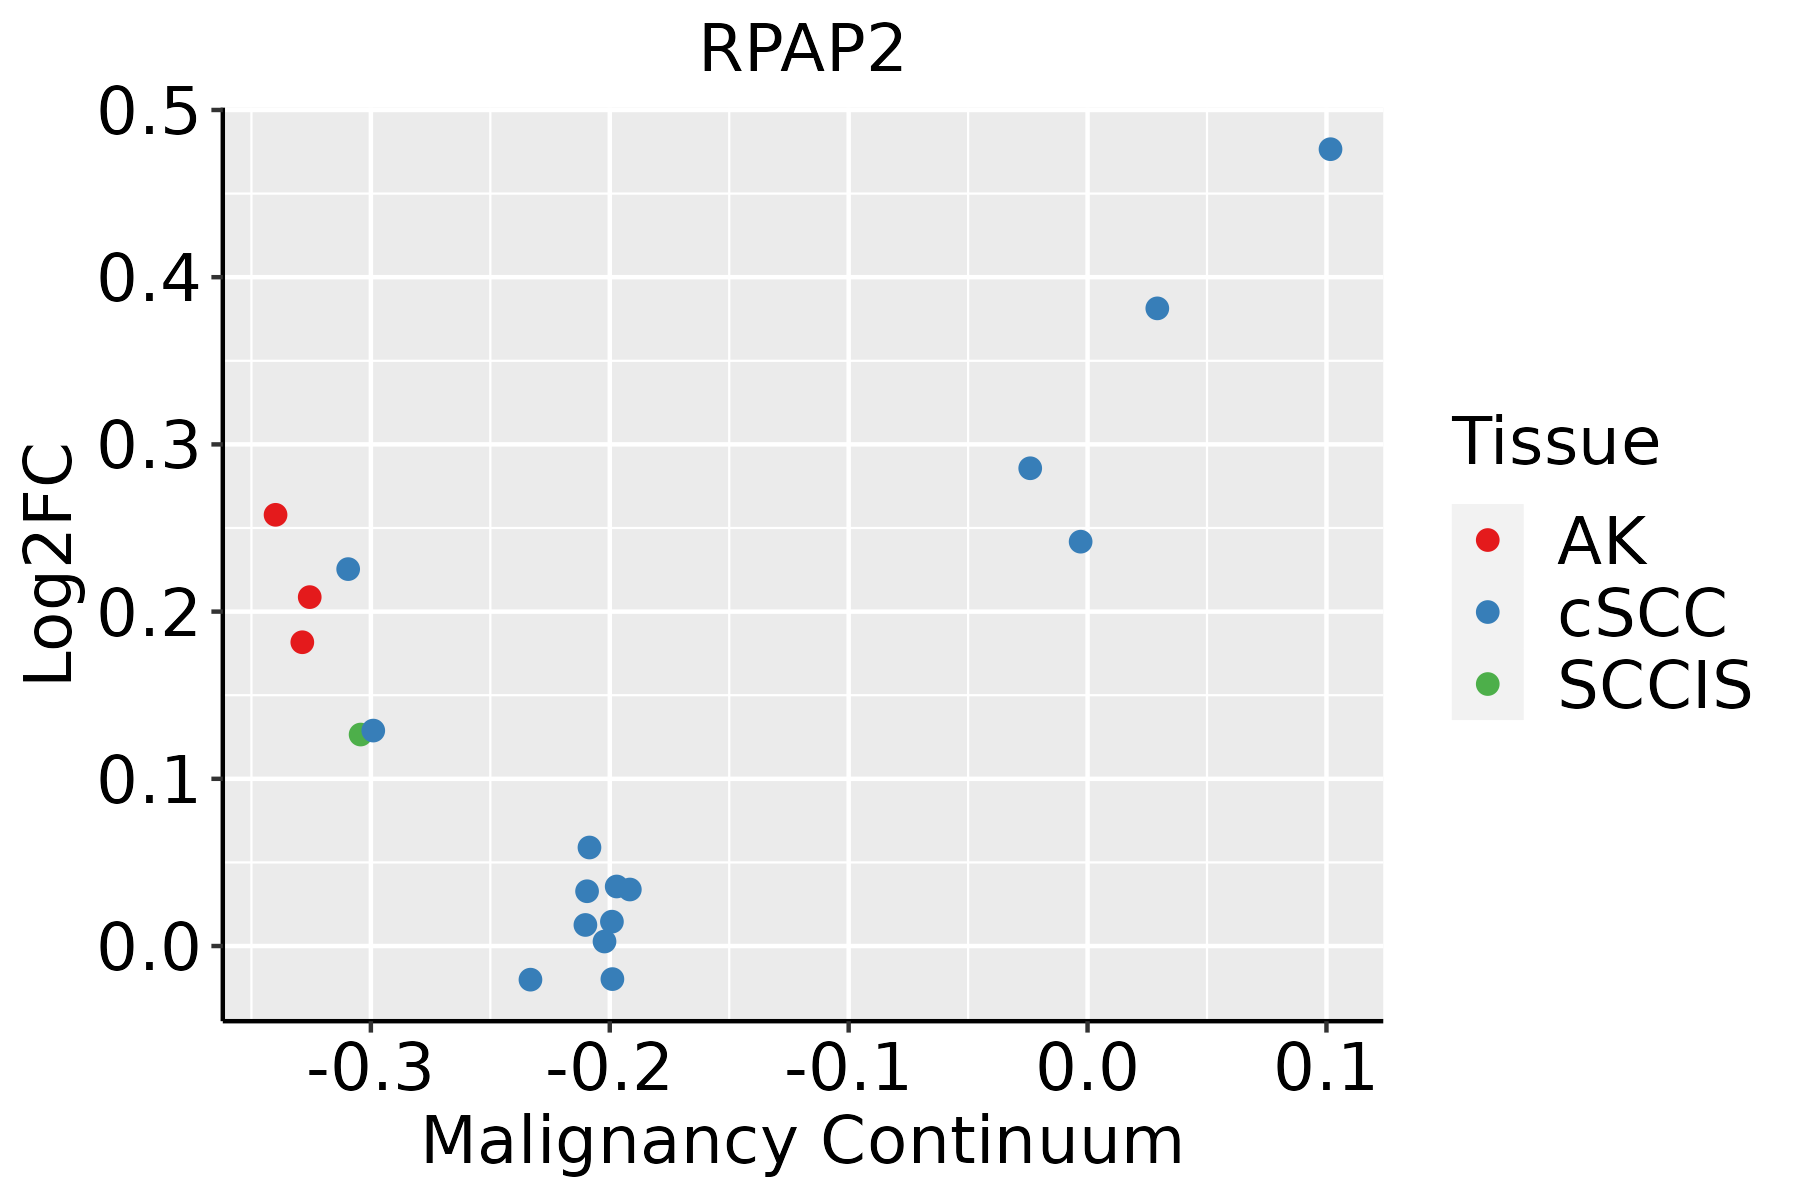 | AK: Actinic keratosis |
| cSCC: Cutaneous squamous cell carcinoma | ||
| SCCIS:squamous cell carcinoma in situ | ||
| Thyroid | 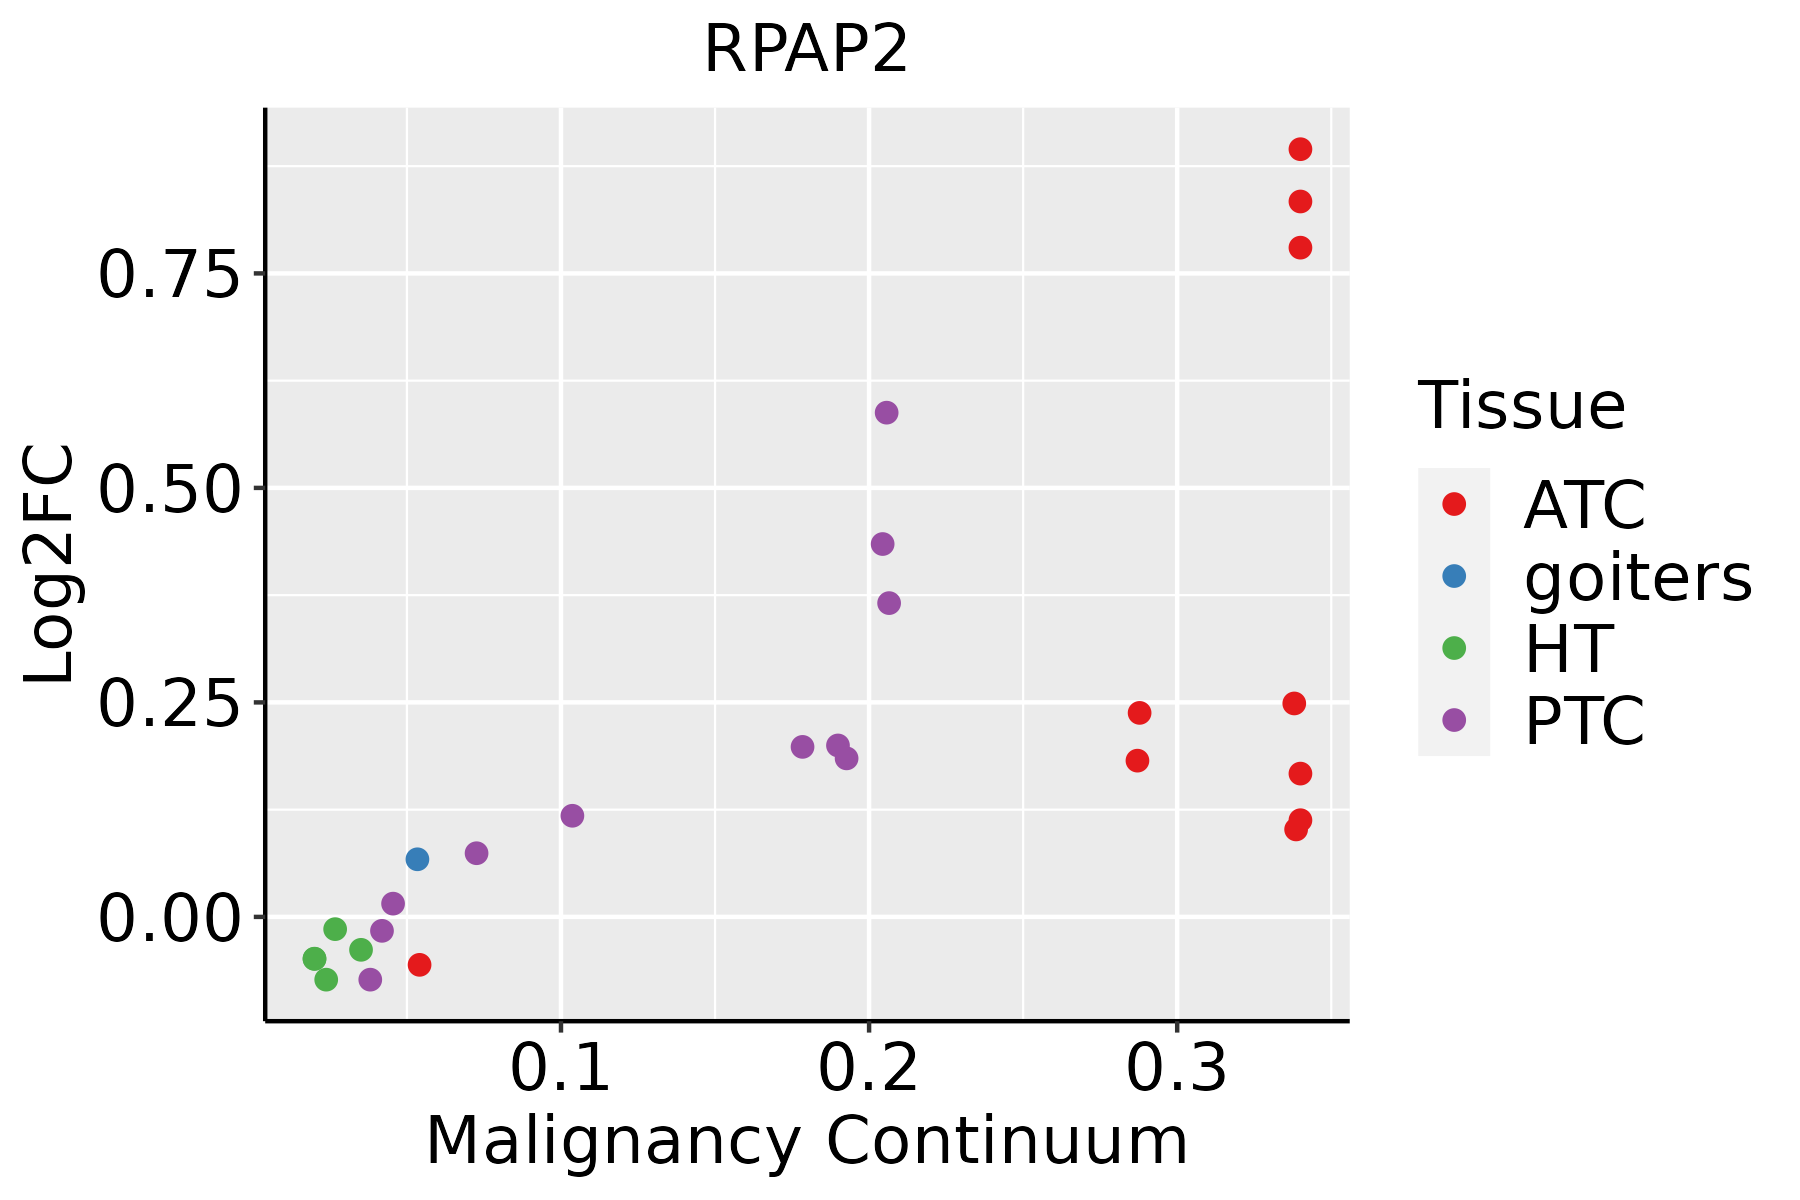 | ATC: Anaplastic thyroid cancer |
| HT: Hashimoto's thyroiditis | ||
| PTC: Papillary thyroid cancer |
| ∗log2FC in expression of this searched gene in stem-like cells from each diseased tissue sample relative to stem-like cells in normal samples in each tissue plotted against the malignancy continuum. Samples are colored based on if they are from different disease stage. |
Top |
Malignant transformation related pathway analysis |
| Find out the enriched GO biological processes and KEGG pathways involved in transition from healthy to precancer to cancer |
| Tissue | Disease Stage | Enriched GO biological Processes |
| Colorectum | AD |  |
| Colorectum | SER |  |
| Colorectum | MSS |  |
| Colorectum | MSI-H |  |
| Colorectum | FAP |  |
| ∗Top 15 enriched GO BP terms are showed in the bar plot of each disease state in each tissue. Each row represents a significant GO biological process which is colored according to the -log10(p.adjust). |
| Page: 1 2 3 4 5 6 7 8 9 |
| GO ID | Tissue | Disease Stage | Description | Gene Ratio | Bg Ratio | pvalue | p.adjust | Count |
| GO:001631110 | Esophagus | ESCC | dephosphorylation | 251/8552 | 417/18723 | 1.26e-09 | 2.99e-08 | 251 |
| GO:000647018 | Esophagus | ESCC | protein dephosphorylation | 177/8552 | 281/18723 | 3.13e-09 | 6.72e-08 | 177 |
| GO:00987812 | Esophagus | ESCC | ncRNA transcription | 45/8552 | 56/18723 | 1.05e-07 | 1.72e-06 | 45 |
| GO:00093011 | Esophagus | ESCC | snRNA transcription | 16/8552 | 19/18723 | 6.45e-04 | 3.43e-03 | 16 |
| GO:00064707 | Lung | IAC | protein dephosphorylation | 60/2061 | 281/18723 | 3.24e-07 | 2.48e-05 | 60 |
| GO:00163116 | Lung | IAC | dephosphorylation | 75/2061 | 417/18723 | 1.21e-05 | 3.64e-04 | 75 |
| GO:000647012 | Lung | AIS | protein dephosphorylation | 56/1849 | 281/18723 | 2.47e-07 | 2.24e-05 | 56 |
| GO:001631112 | Lung | AIS | dephosphorylation | 69/1849 | 417/18723 | 1.27e-05 | 4.78e-04 | 69 |
| GO:000647019 | Skin | AK | protein dephosphorylation | 49/1910 | 281/18723 | 1.30e-04 | 1.61e-03 | 49 |
| GO:000647024 | Skin | cSCC | protein dephosphorylation | 111/4864 | 281/18723 | 4.10e-07 | 7.96e-06 | 111 |
| GO:00987813 | Skin | cSCC | ncRNA transcription | 28/4864 | 56/18723 | 9.93e-05 | 9.22e-04 | 28 |
| GO:001631115 | Skin | cSCC | dephosphorylation | 134/4864 | 417/18723 | 2.65e-03 | 1.50e-02 | 134 |
| GO:001631116 | Thyroid | PTC | dephosphorylation | 174/5968 | 417/18723 | 1.20e-05 | 1.31e-04 | 174 |
| GO:000647020 | Thyroid | PTC | protein dephosphorylation | 123/5968 | 281/18723 | 1.69e-05 | 1.77e-04 | 123 |
| GO:00987814 | Thyroid | PTC | ncRNA transcription | 27/5968 | 56/18723 | 7.77e-03 | 3.29e-02 | 27 |
| GO:0006470111 | Thyroid | ATC | protein dephosphorylation | 129/6293 | 281/18723 | 1.11e-05 | 1.09e-04 | 129 |
| GO:001631117 | Thyroid | ATC | dephosphorylation | 179/6293 | 417/18723 | 3.88e-05 | 3.15e-04 | 179 |
| Page: 1 |
| Pathway ID | Tissue | Disease Stage | Description | Gene Ratio | Bg Ratio | pvalue | p.adjust | qvalue | Count |
| Page: 1 |
Top |
Cell-cell communication analysis |
| Identification of potential cell-cell interactions between two cell types and their ligand-receptor pairs for different disease states |
| Ligand | Receptor | LRpair | Pathway | Tissue | Disease Stage |
| Page: 1 |
Top |
Single-cell gene regulatory network inference analysis |
| Find out the significant the regulons (TFs) and the target genes of each regulon across cell types for different disease states |
| TF | Cell Type | Tissue | Disease Stage | Target Gene | RSS | Regulon Activity |
| ∗The dot plots of a searched regulon are shown for all cell subpopulations in each disease state of each tissue based on the regulon specific score inferred using pySCENIC and by calculating the average expression. |
| Page: 1 |
Top |
Somatic mutation of malignant transformation related genes |
| Annotation of somatic variants for genes involved in malignant transformation |
| Hugo Symbol | Variant Class | Variant Classification | dbSNP RS | HGVSc | HGVSp | HGVSp Short | SWISSPROT | BIOTYPE | SIFT | PolyPhen | Tumor Sample Barcode | Tissue | Histology | Sex | Age | Stage | Therapy Types | Drugs | Outcome |
| RPAP2 | SNV | Missense_Mutation | c.1319G>A | p.Gly440Asp | p.G440D | Q8IXW5 | protein_coding | tolerated(1) | benign(0) | TCGA-A8-A08L-01 | Breast | breast invasive carcinoma | Female | >=65 | III/IV | Unknown | Unknown | SD | |
| RPAP2 | SNV | Missense_Mutation | novel | c.1235N>G | p.Ile412Arg | p.I412R | Q8IXW5 | protein_coding | deleterious(0.04) | benign(0.293) | TCGA-S3-AA11-01 | Breast | breast invasive carcinoma | Female | >=65 | I/II | Hormone Therapy | letrozole | CR |
| RPAP2 | SNV | Missense_Mutation | c.1471N>G | p.Pro491Ala | p.P491A | Q8IXW5 | protein_coding | deleterious(0) | probably_damaging(0.998) | TCGA-C5-A1M9-01 | Cervix | cervical & endocervical cancer | Female | <65 | I/II | Chemotherapy | cisplatin | PD | |
| RPAP2 | SNV | Missense_Mutation | c.1369N>A | p.Glu457Lys | p.E457K | Q8IXW5 | protein_coding | deleterious(0.04) | possibly_damaging(0.877) | TCGA-C5-A7CJ-01 | Cervix | cervical & endocervical cancer | Female | <65 | I/II | Chemotherapy | cisplatin | SD | |
| RPAP2 | SNV | Missense_Mutation | c.1834G>C | p.Glu612Gln | p.E612Q | Q8IXW5 | protein_coding | deleterious_low_confidence(0) | benign(0) | TCGA-EK-A2PG-01 | Cervix | cervical & endocervical cancer | Female | >=65 | I/II | Unknown | Unknown | SD | |
| RPAP2 | SNV | Missense_Mutation | c.1604N>C | p.Leu535Pro | p.L535P | Q8IXW5 | protein_coding | deleterious(0) | probably_damaging(0.998) | TCGA-AA-3672-01 | Colorectum | colon adenocarcinoma | Female | >=65 | III/IV | Unknown | Unknown | SD | |
| RPAP2 | SNV | Missense_Mutation | novel | c.359N>A | p.Ser120Tyr | p.S120Y | Q8IXW5 | protein_coding | deleterious(0) | probably_damaging(1) | TCGA-AA-3984-01 | Colorectum | colon adenocarcinoma | Female | <65 | I/II | Unknown | Unknown | SD |
| RPAP2 | SNV | Missense_Mutation | c.1603N>A | p.Leu535Ile | p.L535I | Q8IXW5 | protein_coding | deleterious(0) | probably_damaging(0.994) | TCGA-AA-A010-01 | Colorectum | colon adenocarcinoma | Female | <65 | I/II | Chemotherapy | folinic | CR | |
| RPAP2 | SNV | Missense_Mutation | c.1607T>A | p.Val536Asp | p.V536D | Q8IXW5 | protein_coding | deleterious(0) | possibly_damaging(0.844) | TCGA-AG-A02N-01 | Colorectum | rectum adenocarcinoma | Male | >=65 | I/II | Chemotherapy | folinic | CR | |
| RPAP2 | SNV | Missense_Mutation | c.599N>G | p.Phe200Cys | p.F200C | Q8IXW5 | protein_coding | tolerated(0.18) | benign(0.003) | TCGA-DY-A1DD-01 | Colorectum | rectum adenocarcinoma | Female | >=65 | III/IV | Unknown | Unknown | SD |
| Page: 1 2 3 4 5 |
Top |
Related drugs of malignant transformation related genes |
| Identification of chemicals and drugs interact with genes involved in malignant transfromation |
| (DGIdb 4.0) |
| Entrez ID | Symbol | Category | Interaction Types | Drug Claim Name | Drug Name | PMIDs |
| Page: 1 |

Copyright 2023-Present -The University of Texas Health Science Center at Houston |