
|
|||||
|
 | |
| |
| |
| |
| |
| |
|
Gene: RPAIN |
Gene summary for RPAIN |
| Gene information | Species | Human | Gene symbol | RPAIN | Gene ID | 84268 |
| Gene name | RPA interacting protein | |
| Gene Alias | HRIP | |
| Cytomap | 17p13.2 | |
| Gene Type | protein-coding | GO ID | GO:0006139 | UniProtAcc | A0A0B4J1T3 |
Top |
Malignant transformation analysis |
| Identification of the aberrant gene expression in precancerous and cancerous lesions by comparing the gene expression of stem-like cells in diseased tissues with normal stem cells |
| Entrez ID | Symbol | Replicates | Species | Organ | Tissue | Adj P-value | Log2FC | Malignancy |
| 84268 | RPAIN | AEH-subject1 | Human | Endometrium | AEH | 4.89e-06 | -1.96e-01 | -0.3059 |
| 84268 | RPAIN | AEH-subject2 | Human | Endometrium | AEH | 1.23e-09 | -2.33e-01 | -0.2525 |
| 84268 | RPAIN | AEH-subject3 | Human | Endometrium | AEH | 7.55e-10 | -2.69e-01 | -0.2576 |
| 84268 | RPAIN | EEC-subject1 | Human | Endometrium | EEC | 1.76e-08 | -1.96e-01 | -0.2682 |
| 84268 | RPAIN | EEC-subject2 | Human | Endometrium | EEC | 1.09e-11 | -2.85e-01 | -0.2607 |
| 84268 | RPAIN | EEC-subject3 | Human | Endometrium | EEC | 1.90e-34 | -3.24e-01 | -0.2525 |
| 84268 | RPAIN | EEC-subject5 | Human | Endometrium | EEC | 1.34e-04 | -2.05e-01 | -0.249 |
| 84268 | RPAIN | GSM5276934 | Human | Endometrium | EEC | 5.87e-04 | -2.11e-01 | -0.0913 |
| 84268 | RPAIN | GSM6177620_NYU_UCEC1_lib1_lib1 | Human | Endometrium | EEC | 1.89e-24 | -1.64e-01 | -0.1869 |
| 84268 | RPAIN | GSM6177620_NYU_UCEC1_lib2_lib2 | Human | Endometrium | EEC | 3.00e-21 | -1.58e-01 | -0.1875 |
| 84268 | RPAIN | GSM6177620_NYU_UCEC1_lib3_lib3 | Human | Endometrium | EEC | 9.61e-30 | -1.64e-01 | -0.1883 |
| 84268 | RPAIN | GSM6177621_NYU_UCEC2_lib1_lib1 | Human | Endometrium | EEC | 9.62e-28 | -2.13e-01 | -0.1934 |
| 84268 | RPAIN | GSM6177622_NYU_UCEC3_lib1_lib1 | Human | Endometrium | EEC | 4.31e-46 | -1.51e-01 | -0.1917 |
| 84268 | RPAIN | GSM6177622_NYU_UCEC3_lib2_lib2 | Human | Endometrium | EEC | 6.90e-44 | -5.60e-02 | -0.1916 |
| 84268 | RPAIN | GSM6177623_NYU_UCEC3_Vis | Human | Endometrium | EEC | 7.31e-05 | 2.03e-02 | -0.1269 |
| 84268 | RPAIN | LZE3D | Human | Esophagus | HGIN | 4.22e-03 | 4.81e-01 | 0.0668 |
| 84268 | RPAIN | LZE4T | Human | Esophagus | ESCC | 2.31e-13 | 5.90e-01 | 0.0811 |
| 84268 | RPAIN | LZE7T | Human | Esophagus | ESCC | 2.61e-17 | 1.62e+00 | 0.0667 |
| 84268 | RPAIN | LZE8T | Human | Esophagus | ESCC | 6.04e-08 | 2.92e-01 | 0.067 |
| 84268 | RPAIN | LZE20T | Human | Esophagus | ESCC | 1.19e-04 | 6.73e-02 | 0.0662 |
| Page: 1 2 3 4 5 6 7 |
| Tissue | Expression Dynamics | Abbreviation |
| Endometrium | 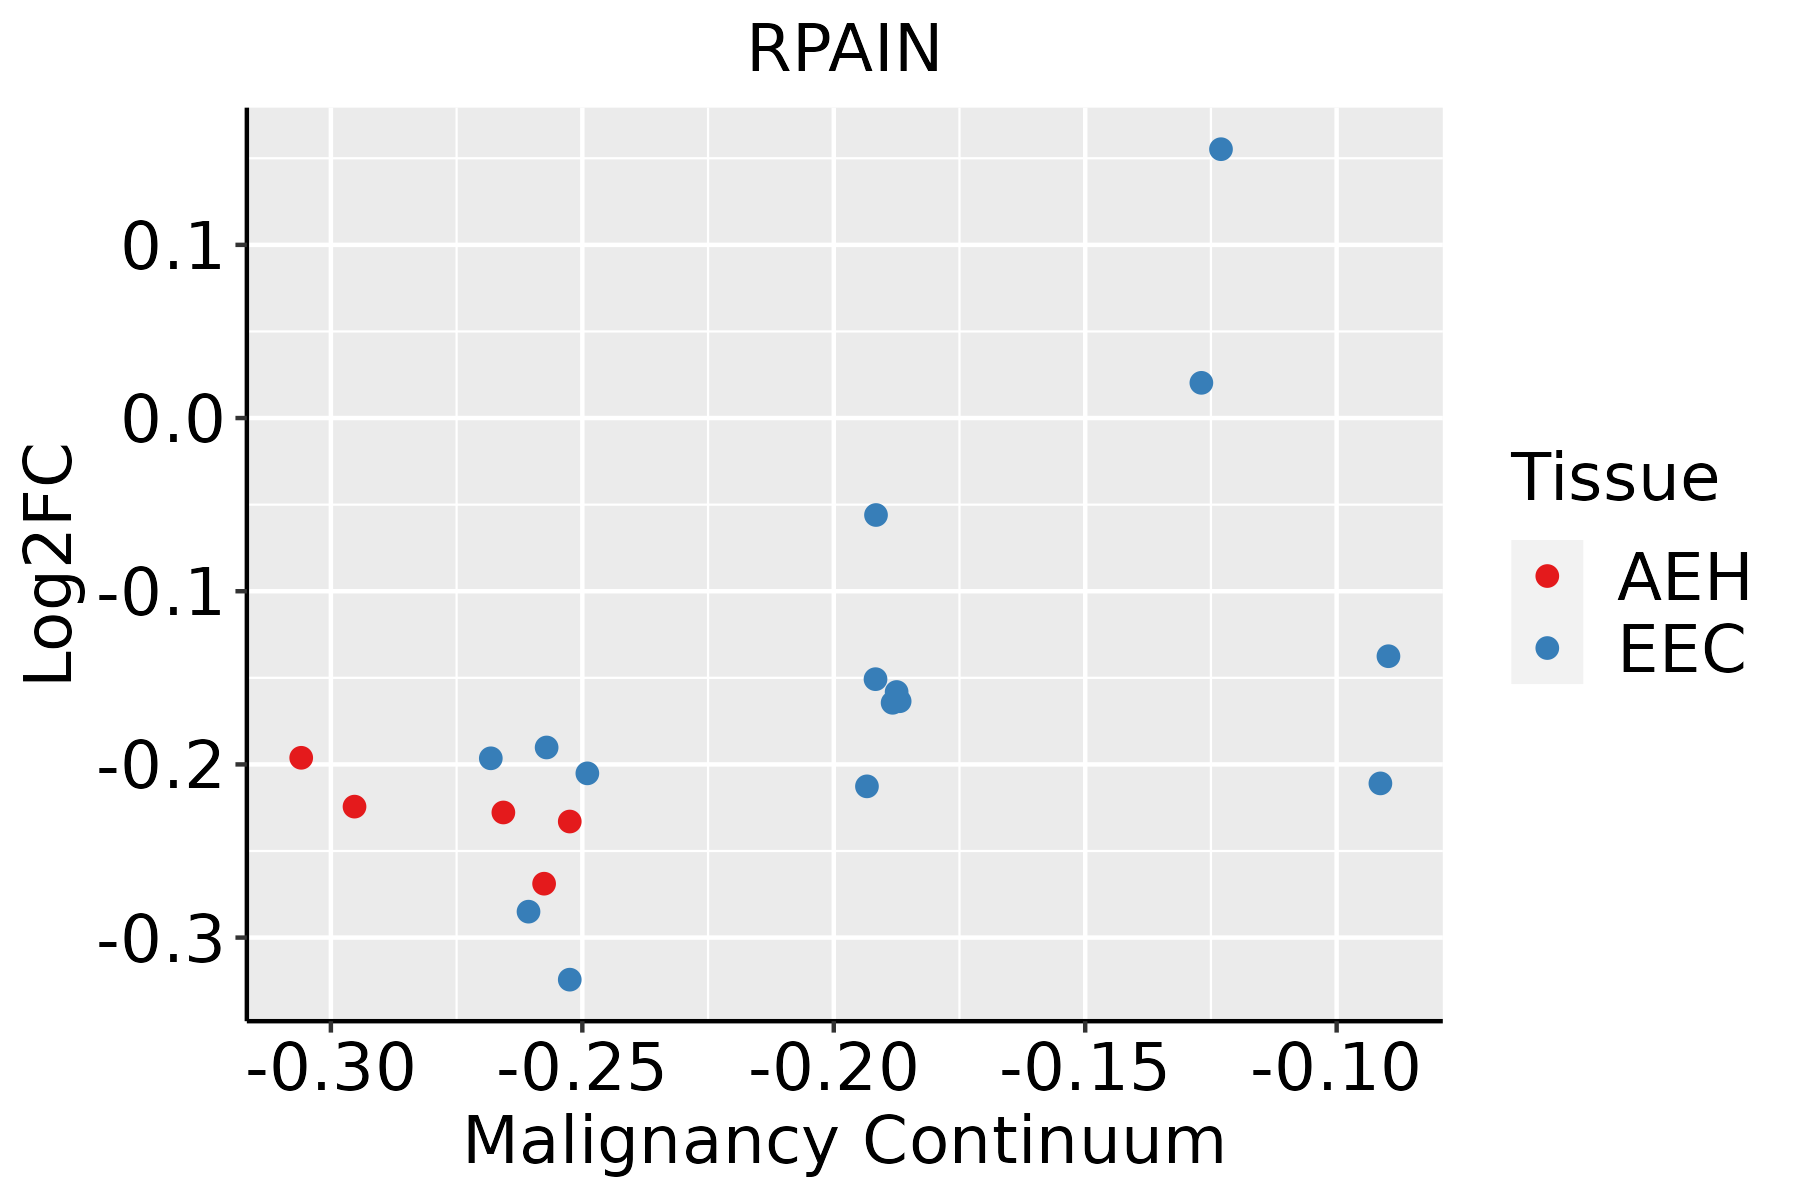 | AEH: Atypical endometrial hyperplasia |
| EEC: Endometrioid Cancer | ||
| Esophagus |  | ESCC: Esophageal squamous cell carcinoma |
| HGIN: High-grade intraepithelial neoplasias | ||
| LGIN: Low-grade intraepithelial neoplasias | ||
| Liver | 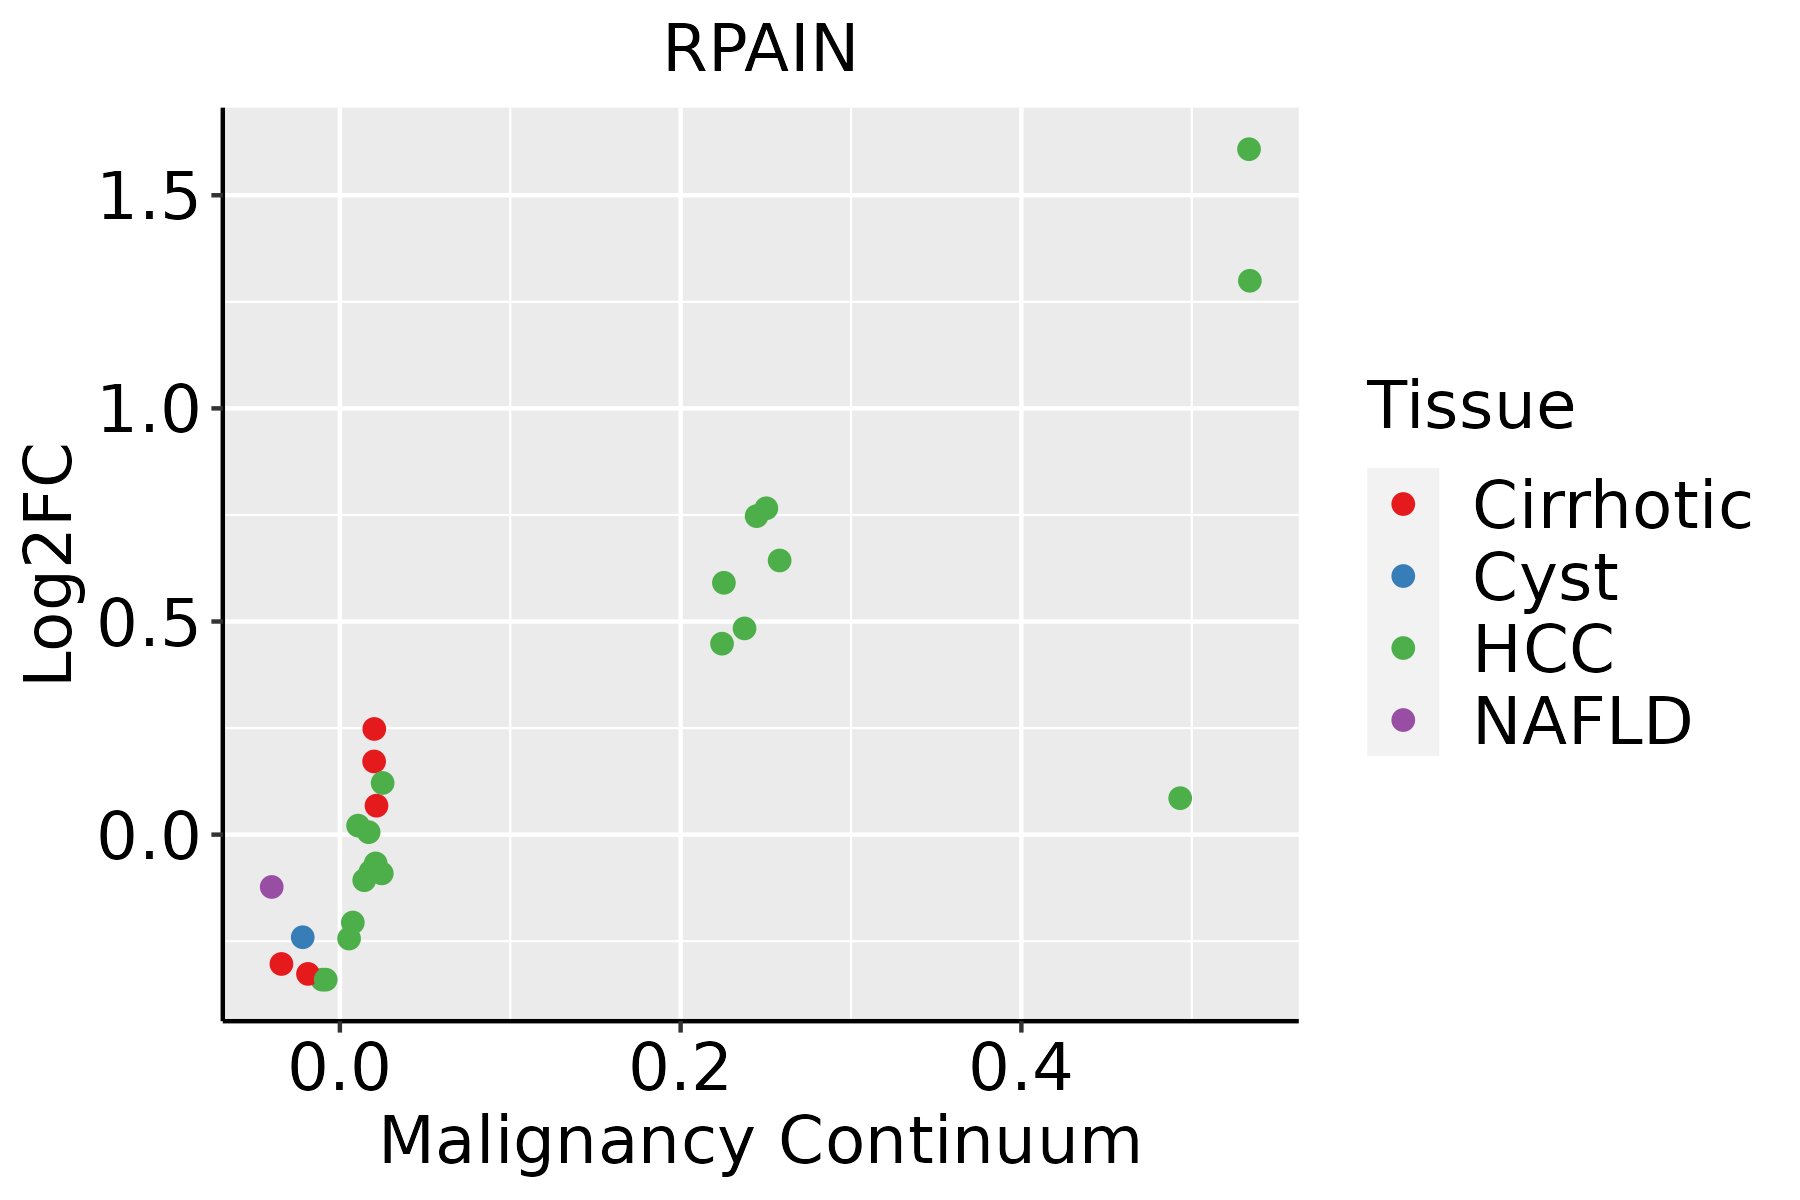 | HCC: Hepatocellular carcinoma |
| NAFLD: Non-alcoholic fatty liver disease | ||
| Oral Cavity | 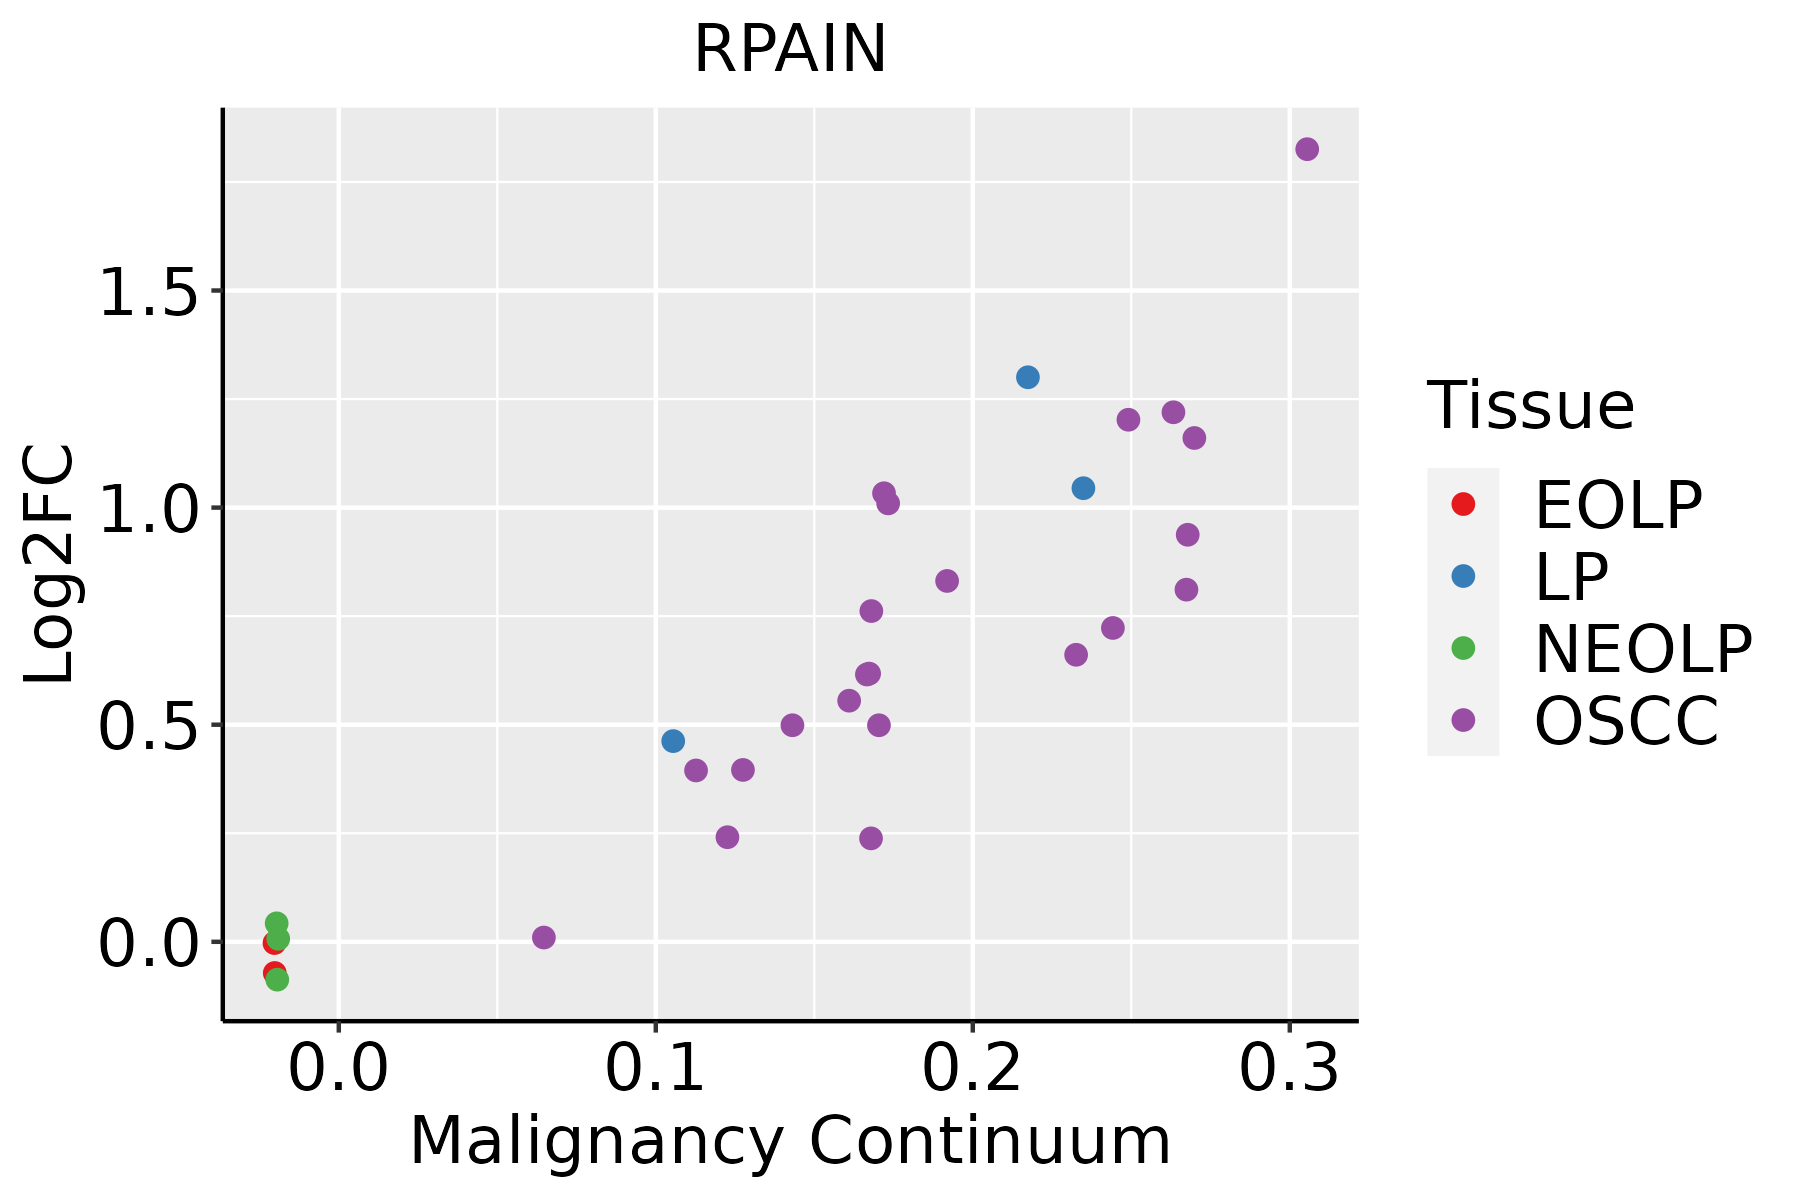 | EOLP: Erosive Oral lichen planus |
| LP: leukoplakia | ||
| NEOLP: Non-erosive oral lichen planus | ||
| OSCC: Oral squamous cell carcinoma | ||
| Prostate | 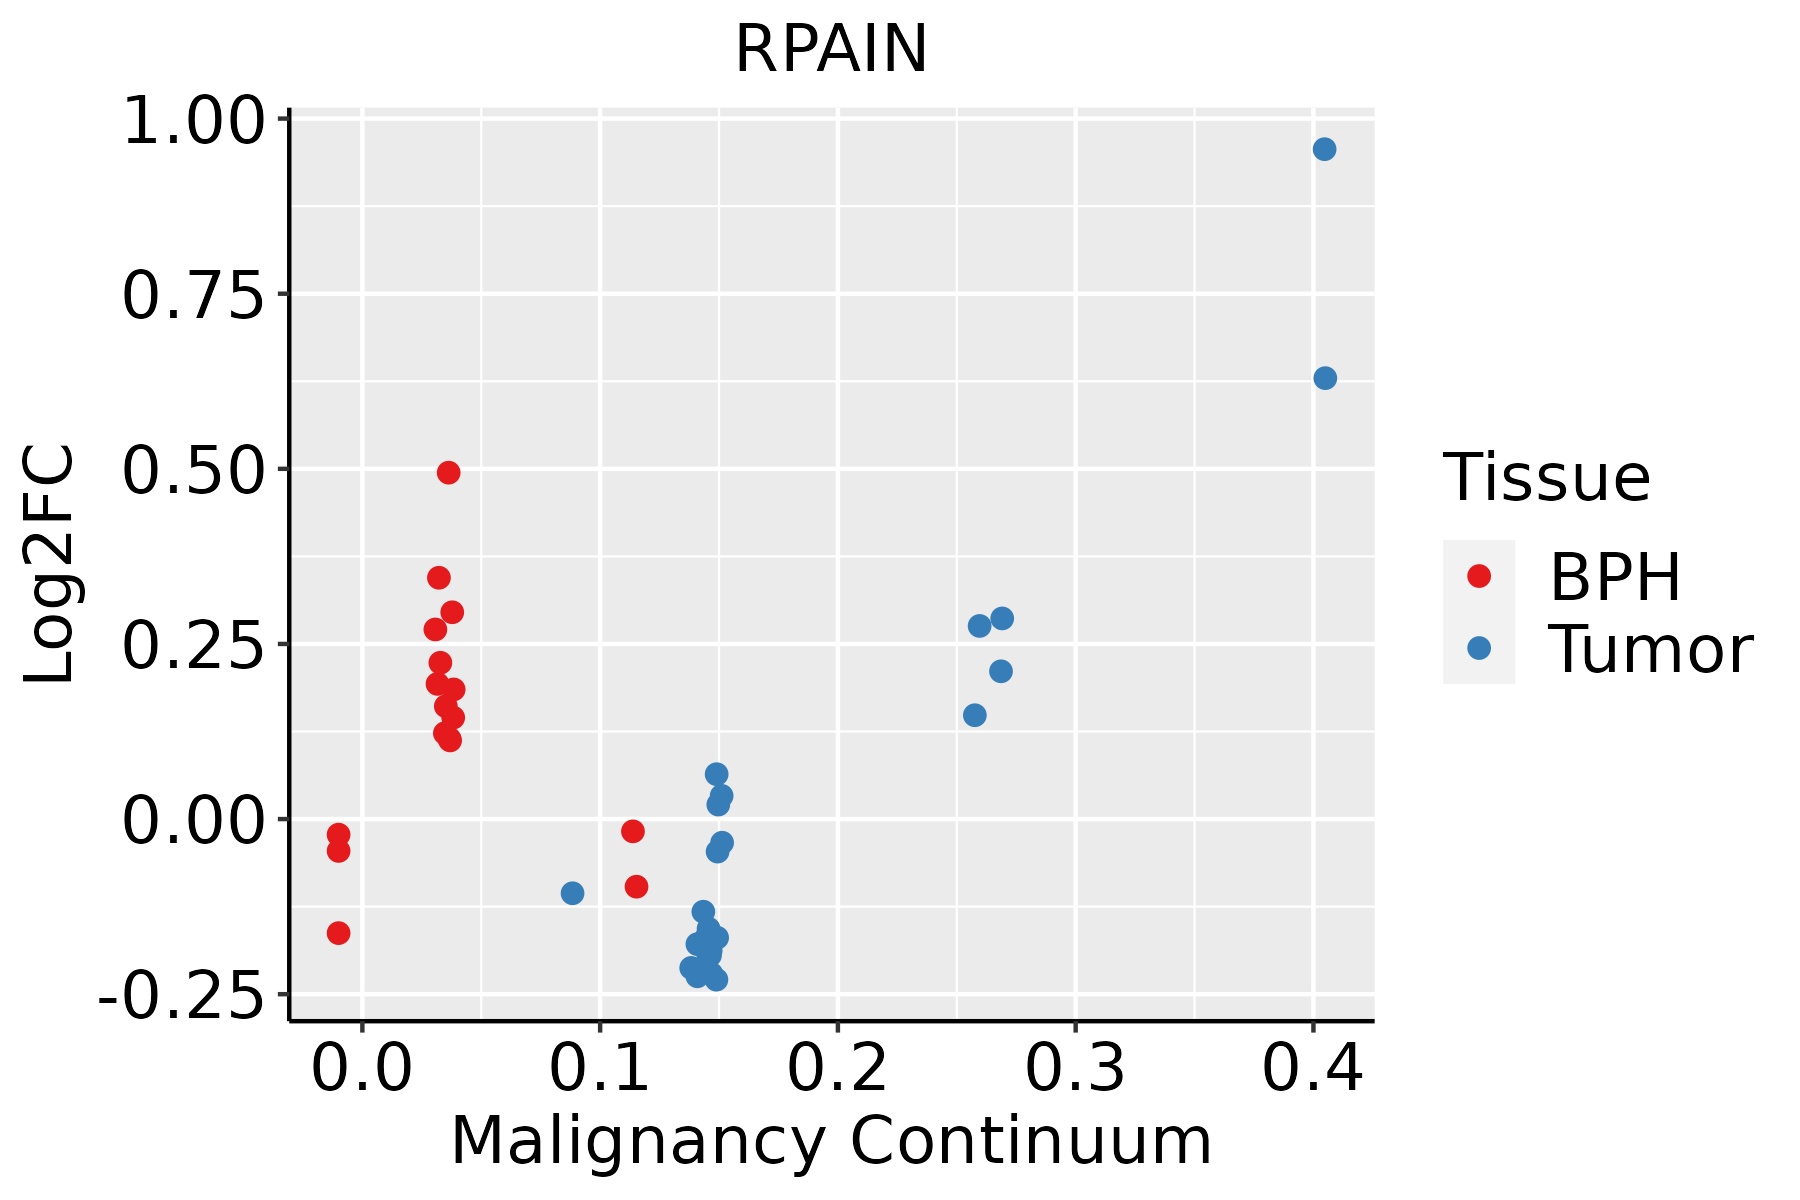 | BPH: Benign Prostatic Hyperplasia |
| Skin | 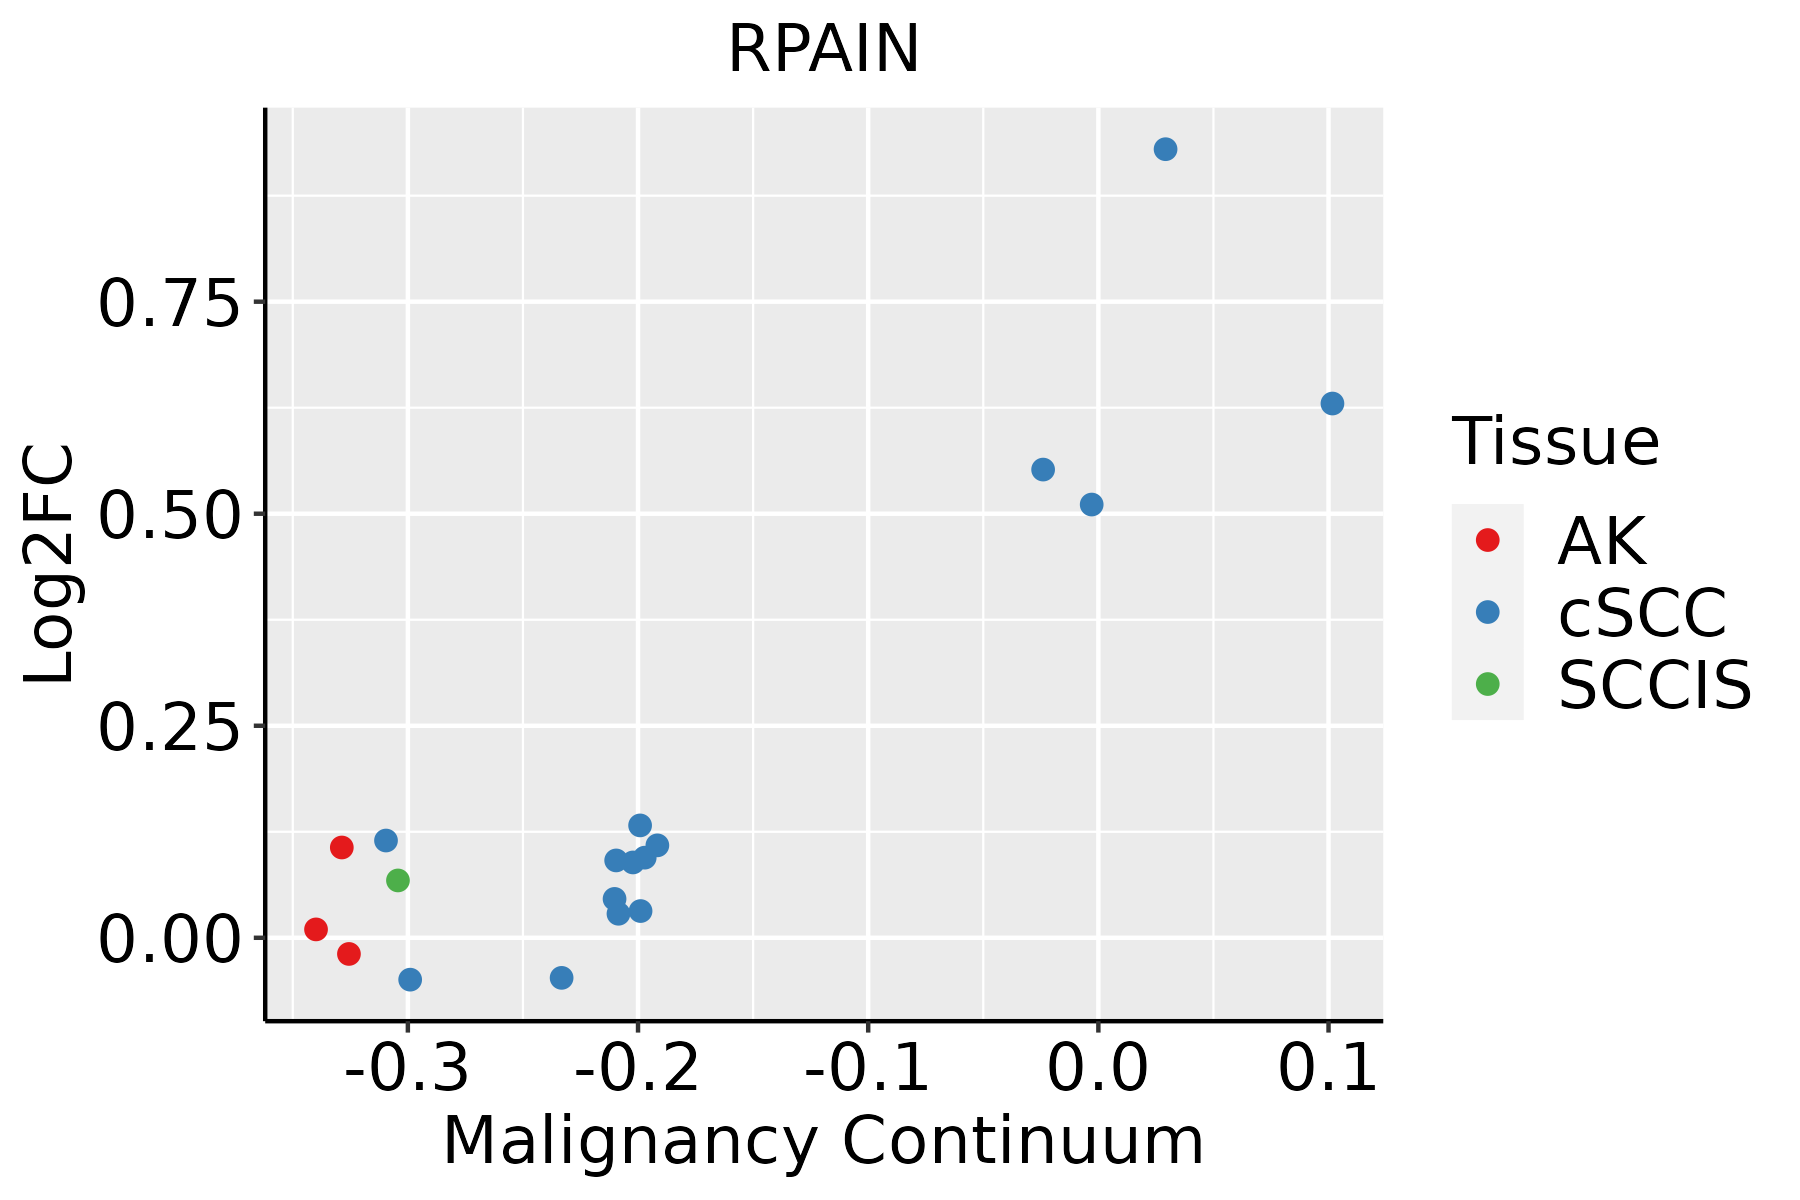 | AK: Actinic keratosis |
| cSCC: Cutaneous squamous cell carcinoma | ||
| SCCIS:squamous cell carcinoma in situ | ||
| Thyroid | 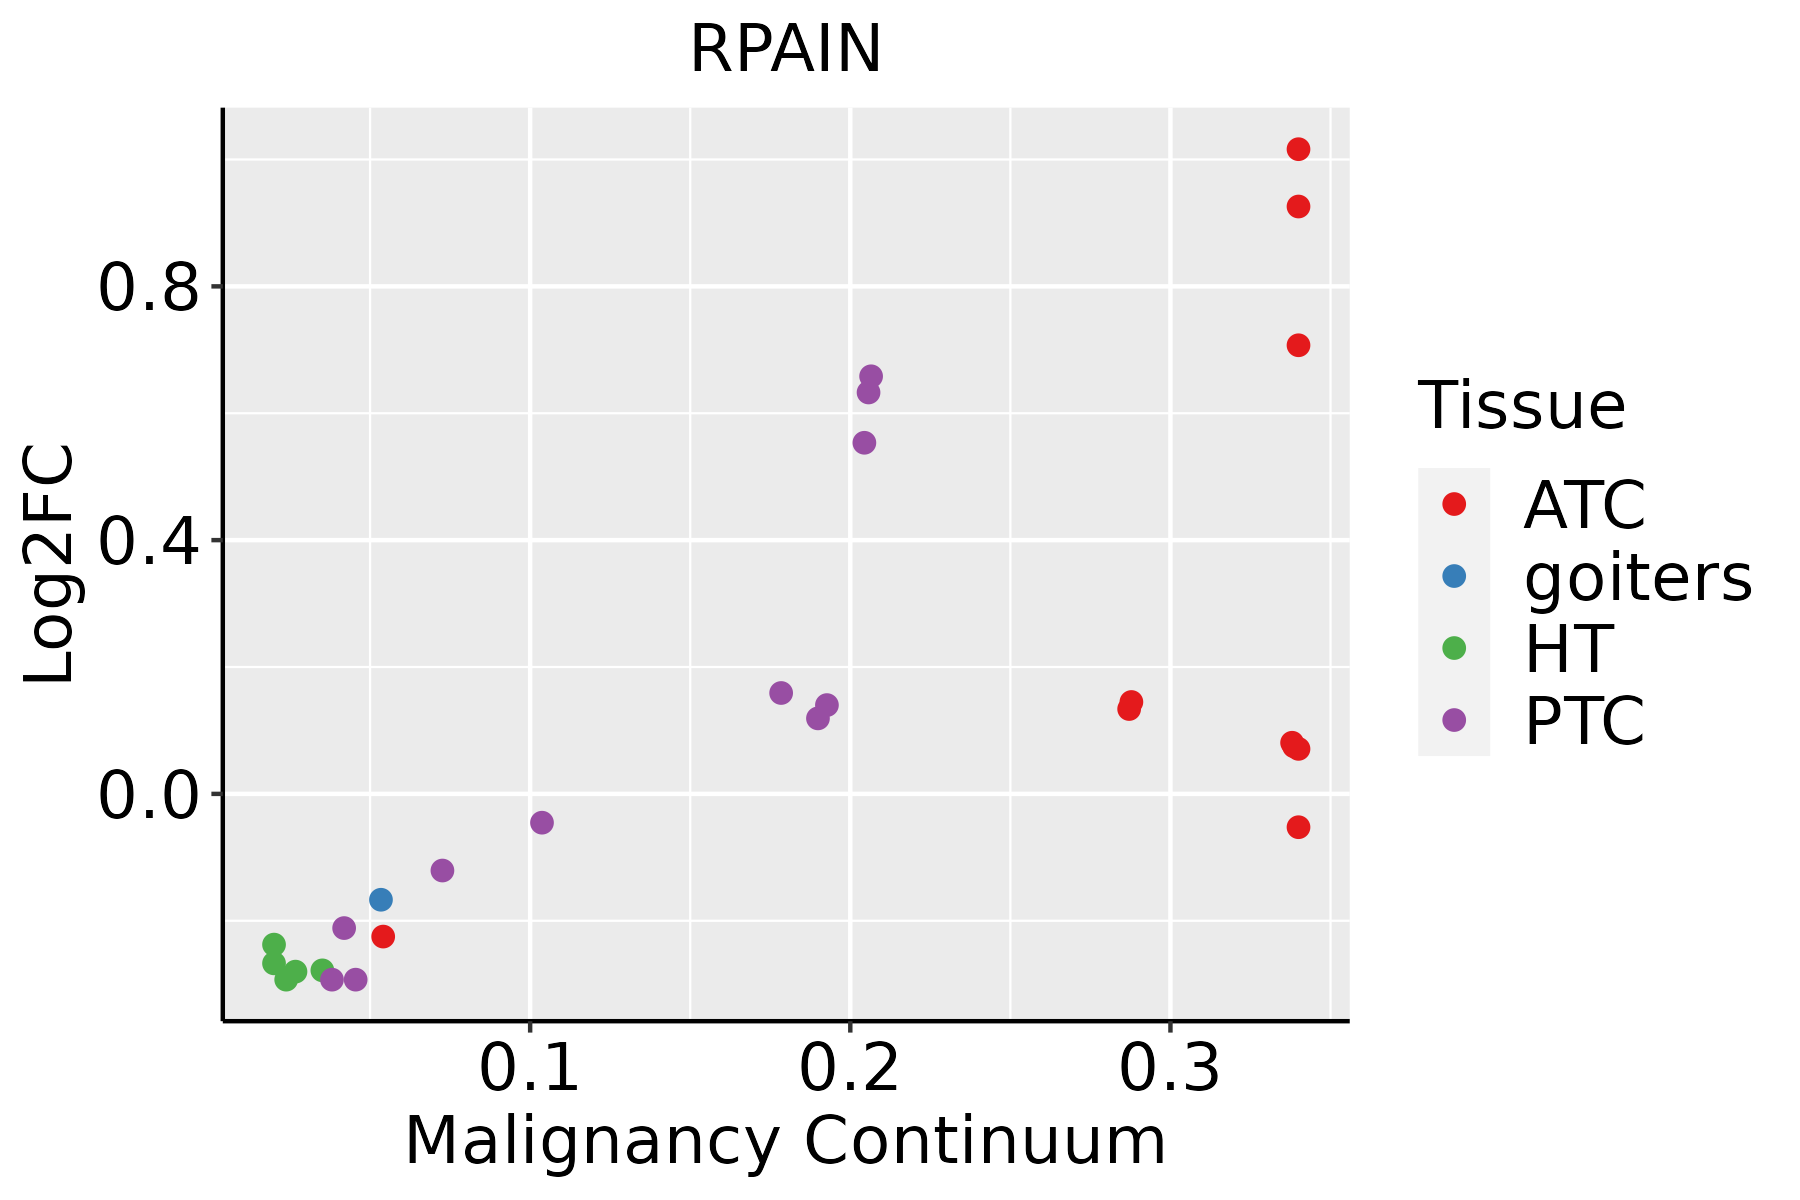 | ATC: Anaplastic thyroid cancer |
| HT: Hashimoto's thyroiditis | ||
| PTC: Papillary thyroid cancer |
| ∗log2FC in expression of this searched gene in stem-like cells from each diseased tissue sample relative to stem-like cells in normal samples in each tissue plotted against the malignancy continuum. Samples are colored based on if they are from different disease stage. |
Top |
Malignant transformation related pathway analysis |
| Find out the enriched GO biological processes and KEGG pathways involved in transition from healthy to precancer to cancer |
| Tissue | Disease Stage | Enriched GO biological Processes |
| Colorectum | AD |  |
| Colorectum | SER |  |
| Colorectum | MSS |  |
| Colorectum | MSI-H |  |
| Colorectum | FAP |  |
| ∗Top 15 enriched GO BP terms are showed in the bar plot of each disease state in each tissue. Each row represents a significant GO biological process which is colored according to the -log10(p.adjust). |
| Page: 1 2 3 4 5 6 7 8 9 |
| GO ID | Tissue | Disease Stage | Description | Gene Ratio | Bg Ratio | pvalue | p.adjust | Count |
| GO:007259410 | Endometrium | AEH | establishment of protein localization to organelle | 89/2100 | 422/18723 | 2.41e-09 | 1.90e-07 | 89 |
| GO:00345049 | Endometrium | AEH | protein localization to nucleus | 57/2100 | 290/18723 | 1.65e-05 | 3.42e-04 | 57 |
| GO:000691310 | Endometrium | AEH | nucleocytoplasmic transport | 54/2100 | 301/18723 | 3.24e-04 | 3.62e-03 | 54 |
| GO:005116910 | Endometrium | AEH | nuclear transport | 54/2100 | 301/18723 | 3.24e-04 | 3.62e-03 | 54 |
| GO:00170389 | Endometrium | AEH | protein import | 37/2100 | 206/18723 | 2.56e-03 | 1.89e-02 | 37 |
| GO:007259415 | Endometrium | EEC | establishment of protein localization to organelle | 94/2168 | 422/18723 | 2.22e-10 | 2.51e-08 | 94 |
| GO:003450413 | Endometrium | EEC | protein localization to nucleus | 60/2168 | 290/18723 | 5.09e-06 | 1.26e-04 | 60 |
| GO:000691314 | Endometrium | EEC | nucleocytoplasmic transport | 59/2168 | 301/18723 | 3.31e-05 | 5.65e-04 | 59 |
| GO:005116914 | Endometrium | EEC | nuclear transport | 59/2168 | 301/18723 | 3.31e-05 | 5.65e-04 | 59 |
| GO:001703813 | Endometrium | EEC | protein import | 40/2168 | 206/18723 | 6.94e-04 | 6.66e-03 | 40 |
| GO:007259420 | Esophagus | HGIN | establishment of protein localization to organelle | 120/2587 | 422/18723 | 1.73e-15 | 4.00e-13 | 120 |
| GO:003450417 | Esophagus | HGIN | protein localization to nucleus | 84/2587 | 290/18723 | 1.06e-11 | 1.24e-09 | 84 |
| GO:000691319 | Esophagus | HGIN | nucleocytoplasmic transport | 83/2587 | 301/18723 | 2.14e-10 | 1.97e-08 | 83 |
| GO:005116919 | Esophagus | HGIN | nuclear transport | 83/2587 | 301/18723 | 2.14e-10 | 1.97e-08 | 83 |
| GO:001703817 | Esophagus | HGIN | protein import | 51/2587 | 206/18723 | 1.79e-05 | 4.86e-04 | 51 |
| GO:005117010 | Esophagus | HGIN | import into nucleus | 41/2587 | 159/18723 | 4.24e-05 | 1.04e-03 | 41 |
| GO:000660610 | Esophagus | HGIN | protein import into nucleus | 39/2587 | 155/18723 | 1.14e-04 | 2.39e-03 | 39 |
| GO:0072594110 | Esophagus | ESCC | establishment of protein localization to organelle | 311/8552 | 422/18723 | 3.02e-32 | 2.13e-29 | 311 |
| GO:0006913110 | Esophagus | ESCC | nucleocytoplasmic transport | 230/8552 | 301/18723 | 6.04e-28 | 2.02e-25 | 230 |
| GO:0051169110 | Esophagus | ESCC | nuclear transport | 230/8552 | 301/18723 | 6.04e-28 | 2.02e-25 | 230 |
| Page: 1 2 3 4 5 6 |
| Pathway ID | Tissue | Disease Stage | Description | Gene Ratio | Bg Ratio | pvalue | p.adjust | qvalue | Count |
| Page: 1 |
Top |
Cell-cell communication analysis |
| Identification of potential cell-cell interactions between two cell types and their ligand-receptor pairs for different disease states |
| Ligand | Receptor | LRpair | Pathway | Tissue | Disease Stage |
| Page: 1 |
Top |
Single-cell gene regulatory network inference analysis |
| Find out the significant the regulons (TFs) and the target genes of each regulon across cell types for different disease states |
| TF | Cell Type | Tissue | Disease Stage | Target Gene | RSS | Regulon Activity |
| ∗The dot plots of a searched regulon are shown for all cell subpopulations in each disease state of each tissue based on the regulon specific score inferred using pySCENIC and by calculating the average expression. |
| Page: 1 |
Top |
Somatic mutation of malignant transformation related genes |
| Annotation of somatic variants for genes involved in malignant transformation |
| Hugo Symbol | Variant Class | Variant Classification | dbSNP RS | HGVSc | HGVSp | HGVSp Short | SWISSPROT | BIOTYPE | SIFT | PolyPhen | Tumor Sample Barcode | Tissue | Histology | Sex | Age | Stage | Therapy Types | Drugs | Outcome |
| RPAIN | SNV | Missense_Mutation | c.457N>C | p.Val153Leu | p.V153L | protein_coding | tolerated(0.87) | benign(0.001) | TCGA-DG-A2KK-01 | Cervix | cervical & endocervical cancer | Female | <65 | III/IV | Chemotherapy | cisplatin | SD | ||
| RPAIN | SNV | Missense_Mutation | rs572268596 | c.637N>A | p.Val213Ile | p.V213I | protein_coding | tolerated_low_confidence(0.39) | benign(0.003) | TCGA-AA-3950-01 | Colorectum | colon adenocarcinoma | Female | >=65 | I/II | Unknown | Unknown | SD | |
| RPAIN | SNV | Missense_Mutation | c.5C>T | p.Ala2Val | p.A2V | protein_coding | deleterious(0) | possibly_damaging(0.454) | TCGA-AA-A01V-01 | Colorectum | colon adenocarcinoma | Male | <65 | I/II | Unknown | Unknown | SD | ||
| RPAIN | SNV | Missense_Mutation | rs760113626 | c.131N>G | p.Tyr44Cys | p.Y44C | protein_coding | deleterious(0) | probably_damaging(0.977) | TCGA-EI-6917-01 | Colorectum | rectum adenocarcinoma | Male | <65 | III/IV | Chemotherapy | 5fluorouracil+oxaciplatina+l-folinian | SD | |
| RPAIN | SNV | Missense_Mutation | c.101N>T | p.Arg34Ile | p.R34I | protein_coding | deleterious(0) | possibly_damaging(0.885) | TCGA-AP-A056-01 | Endometrium | uterine corpus endometrioid carcinoma | Female | <65 | I/II | Unknown | Unknown | SD | ||
| RPAIN | SNV | Missense_Mutation | novel | c.562N>A | p.Pro188Thr | p.P188T | protein_coding | tolerated(0.43) | benign(0.001) | TCGA-AX-A1C4-01 | Endometrium | uterine corpus endometrioid carcinoma | Female | <65 | I/II | Unknown | Unknown | SD | |
| RPAIN | SNV | Missense_Mutation | novel | c.481N>T | p.Pro161Ser | p.P161S | protein_coding | tolerated(0.58) | benign(0.019) | TCGA-AX-A1CE-01 | Endometrium | uterine corpus endometrioid carcinoma | Female | <65 | I/II | Unspecific | Paclitaxel | SD | |
| RPAIN | SNV | Missense_Mutation | novel | c.464A>G | p.Gln155Arg | p.Q155R | protein_coding | tolerated(0.15) | possibly_damaging(0.463) | TCGA-BG-A0MK-01 | Endometrium | uterine corpus endometrioid carcinoma | Female | <65 | I/II | Unknown | Unknown | PD | |
| RPAIN | SNV | Missense_Mutation | c.239A>G | p.Glu80Gly | p.E80G | protein_coding | deleterious(0.04) | possibly_damaging(0.461) | TCGA-D1-A17Q-01 | Endometrium | uterine corpus endometrioid carcinoma | Female | <65 | I/II | Unknown | Unknown | SD | ||
| RPAIN | SNV | Missense_Mutation | novel | c.352N>C | p.Phe118Leu | p.F118L | protein_coding | deleterious(0) | benign(0.203) | TCGA-DI-A1BU-01 | Endometrium | uterine corpus endometrioid carcinoma | Female | <65 | I/II | Chemotherapy | paclitaxel | SD |
| Page: 1 2 3 |
Top |
Related drugs of malignant transformation related genes |
| Identification of chemicals and drugs interact with genes involved in malignant transfromation |
| (DGIdb 4.0) |
| Entrez ID | Symbol | Category | Interaction Types | Drug Claim Name | Drug Name | PMIDs |
| Page: 1 |

Copyright 2023-Present -The University of Texas Health Science Center at Houston |