
|
|||||
|
 | |
| |
| |
| |
| |
| |
|
Gene: RPA3 |
Gene summary for RPA3 |
| Gene information | Species | Human | Gene symbol | RPA3 | Gene ID | 6119 |
| Gene name | replication protein A3 | |
| Gene Alias | REPA3 | |
| Cytomap | 7p21.3 | |
| Gene Type | protein-coding | GO ID | GO:0000278 | UniProtAcc | A4D105 |
Top |
Malignant transformation analysis |
| Identification of the aberrant gene expression in precancerous and cancerous lesions by comparing the gene expression of stem-like cells in diseased tissues with normal stem cells |
| Entrez ID | Symbol | Replicates | Species | Organ | Tissue | Adj P-value | Log2FC | Malignancy |
| 6119 | RPA3 | GSM4909282 | Human | Breast | IDC | 5.74e-13 | 4.92e-01 | -0.0288 |
| 6119 | RPA3 | GSM4909293 | Human | Breast | IDC | 5.08e-06 | 2.61e-01 | 0.1581 |
| 6119 | RPA3 | GSM4909294 | Human | Breast | IDC | 5.61e-06 | 4.08e-01 | 0.2022 |
| 6119 | RPA3 | GSM4909296 | Human | Breast | IDC | 1.39e-02 | 2.34e-01 | 0.1524 |
| 6119 | RPA3 | GSM4909297 | Human | Breast | IDC | 6.20e-03 | 4.78e-02 | 0.1517 |
| 6119 | RPA3 | GSM4909301 | Human | Breast | IDC | 6.71e-16 | 5.12e-01 | 0.1577 |
| 6119 | RPA3 | GSM4909304 | Human | Breast | IDC | 1.75e-20 | 5.65e-01 | 0.1636 |
| 6119 | RPA3 | GSM4909307 | Human | Breast | IDC | 4.14e-02 | 2.78e-01 | 0.1569 |
| 6119 | RPA3 | GSM4909308 | Human | Breast | IDC | 2.14e-07 | 3.77e-01 | 0.158 |
| 6119 | RPA3 | GSM4909311 | Human | Breast | IDC | 1.09e-10 | -3.23e-02 | 0.1534 |
| 6119 | RPA3 | GSM4909312 | Human | Breast | IDC | 2.73e-02 | 3.27e-02 | 0.1552 |
| 6119 | RPA3 | GSM4909315 | Human | Breast | IDC | 1.79e-09 | 4.75e-01 | 0.21 |
| 6119 | RPA3 | GSM4909316 | Human | Breast | IDC | 2.02e-04 | 4.72e-01 | 0.21 |
| 6119 | RPA3 | GSM4909319 | Human | Breast | IDC | 1.77e-18 | 6.87e-02 | 0.1563 |
| 6119 | RPA3 | GSM4909321 | Human | Breast | IDC | 1.08e-06 | 1.87e-01 | 0.1559 |
| 6119 | RPA3 | brca2 | Human | Breast | Precancer | 1.67e-06 | 2.50e-01 | -0.024 |
| 6119 | RPA3 | brca3 | Human | Breast | Precancer | 4.54e-03 | 1.21e-01 | -0.0263 |
| 6119 | RPA3 | M1 | Human | Breast | IDC | 3.17e-02 | 3.14e-01 | 0.1577 |
| 6119 | RPA3 | NCCBC5 | Human | Breast | DCIS | 4.26e-15 | 4.66e-01 | 0.2046 |
| 6119 | RPA3 | P1 | Human | Breast | IDC | 4.47e-05 | 1.67e-02 | 0.1527 |
| Page: 1 2 3 4 5 6 7 8 |
| Tissue | Expression Dynamics | Abbreviation |
| Breast | 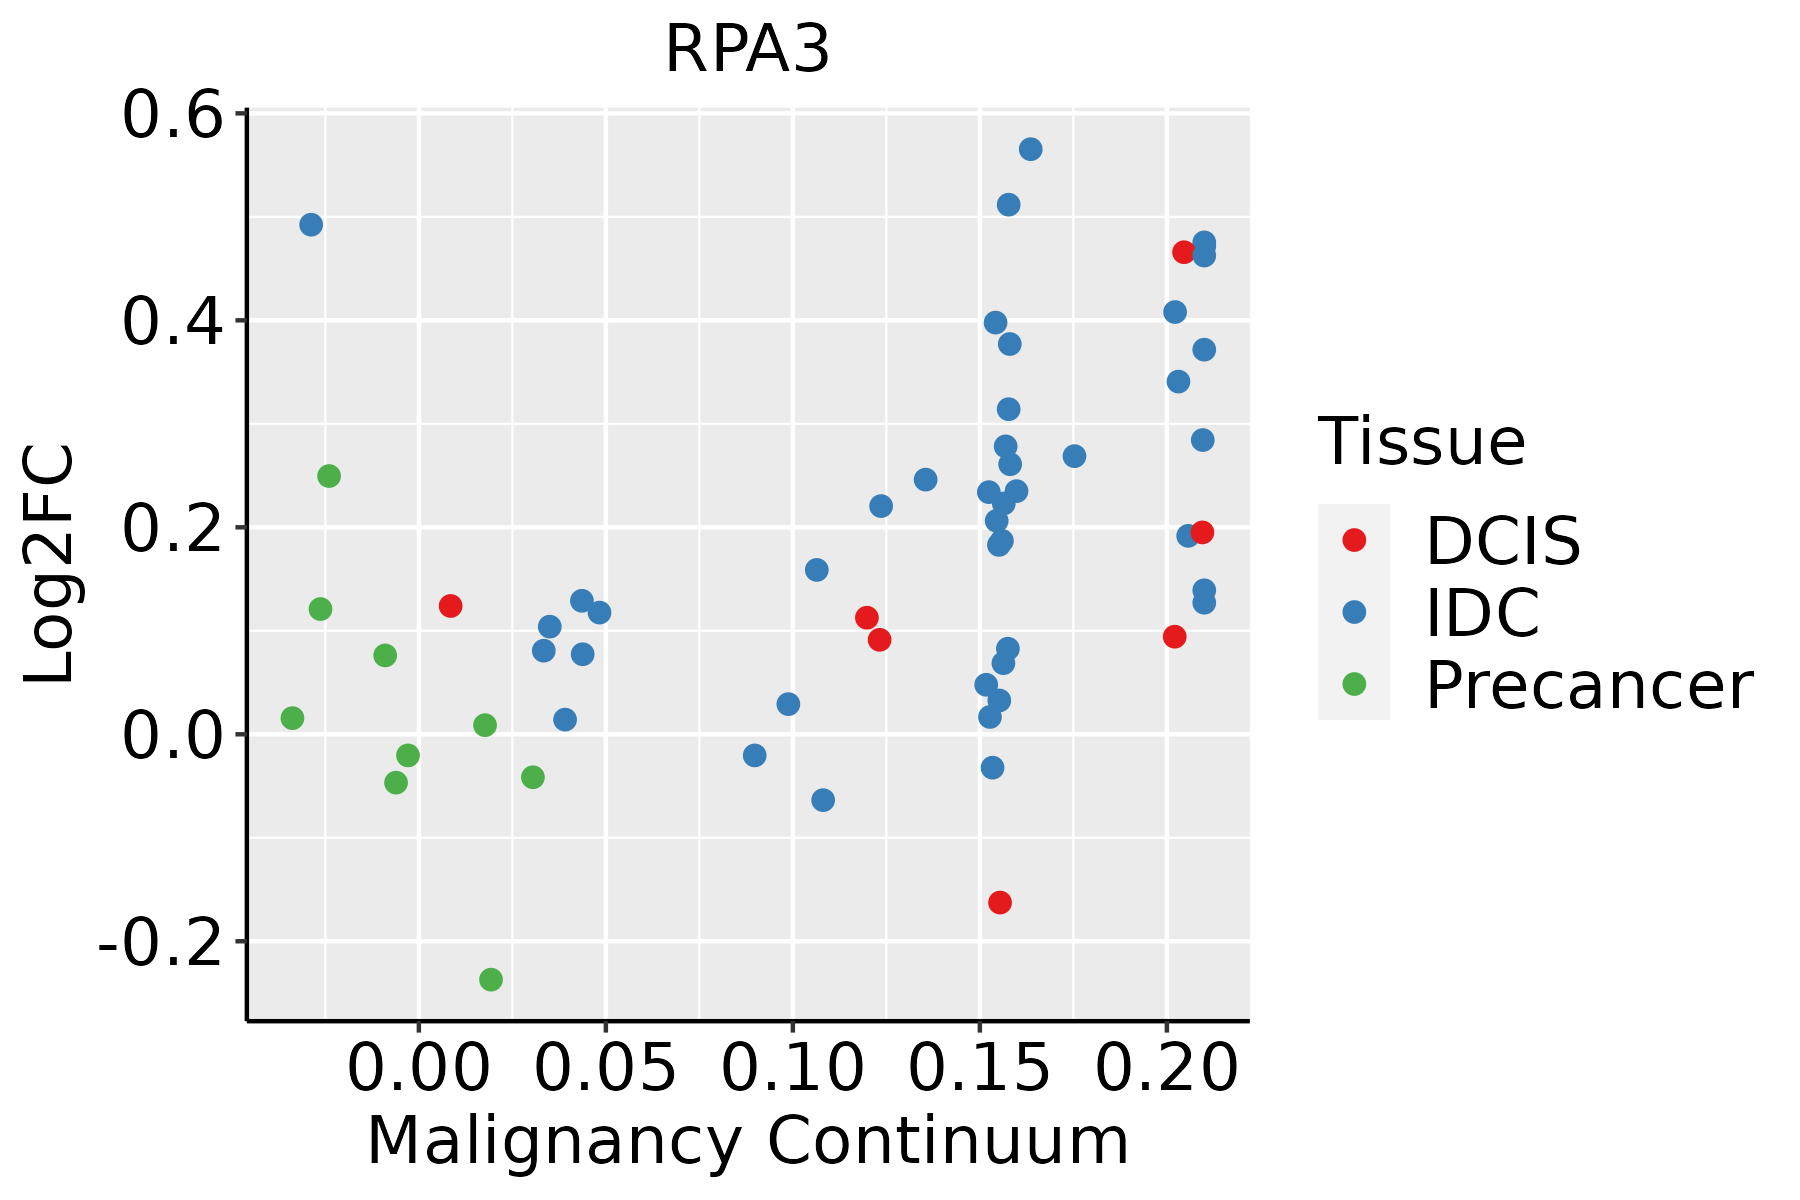 | IDC: Invasive ductal carcinoma |
| DCIS: Ductal carcinoma in situ | ||
| Precancer(BRCA1-mut): Precancerous lesion from BRCA1 mutation carriers | ||
| Cervix | 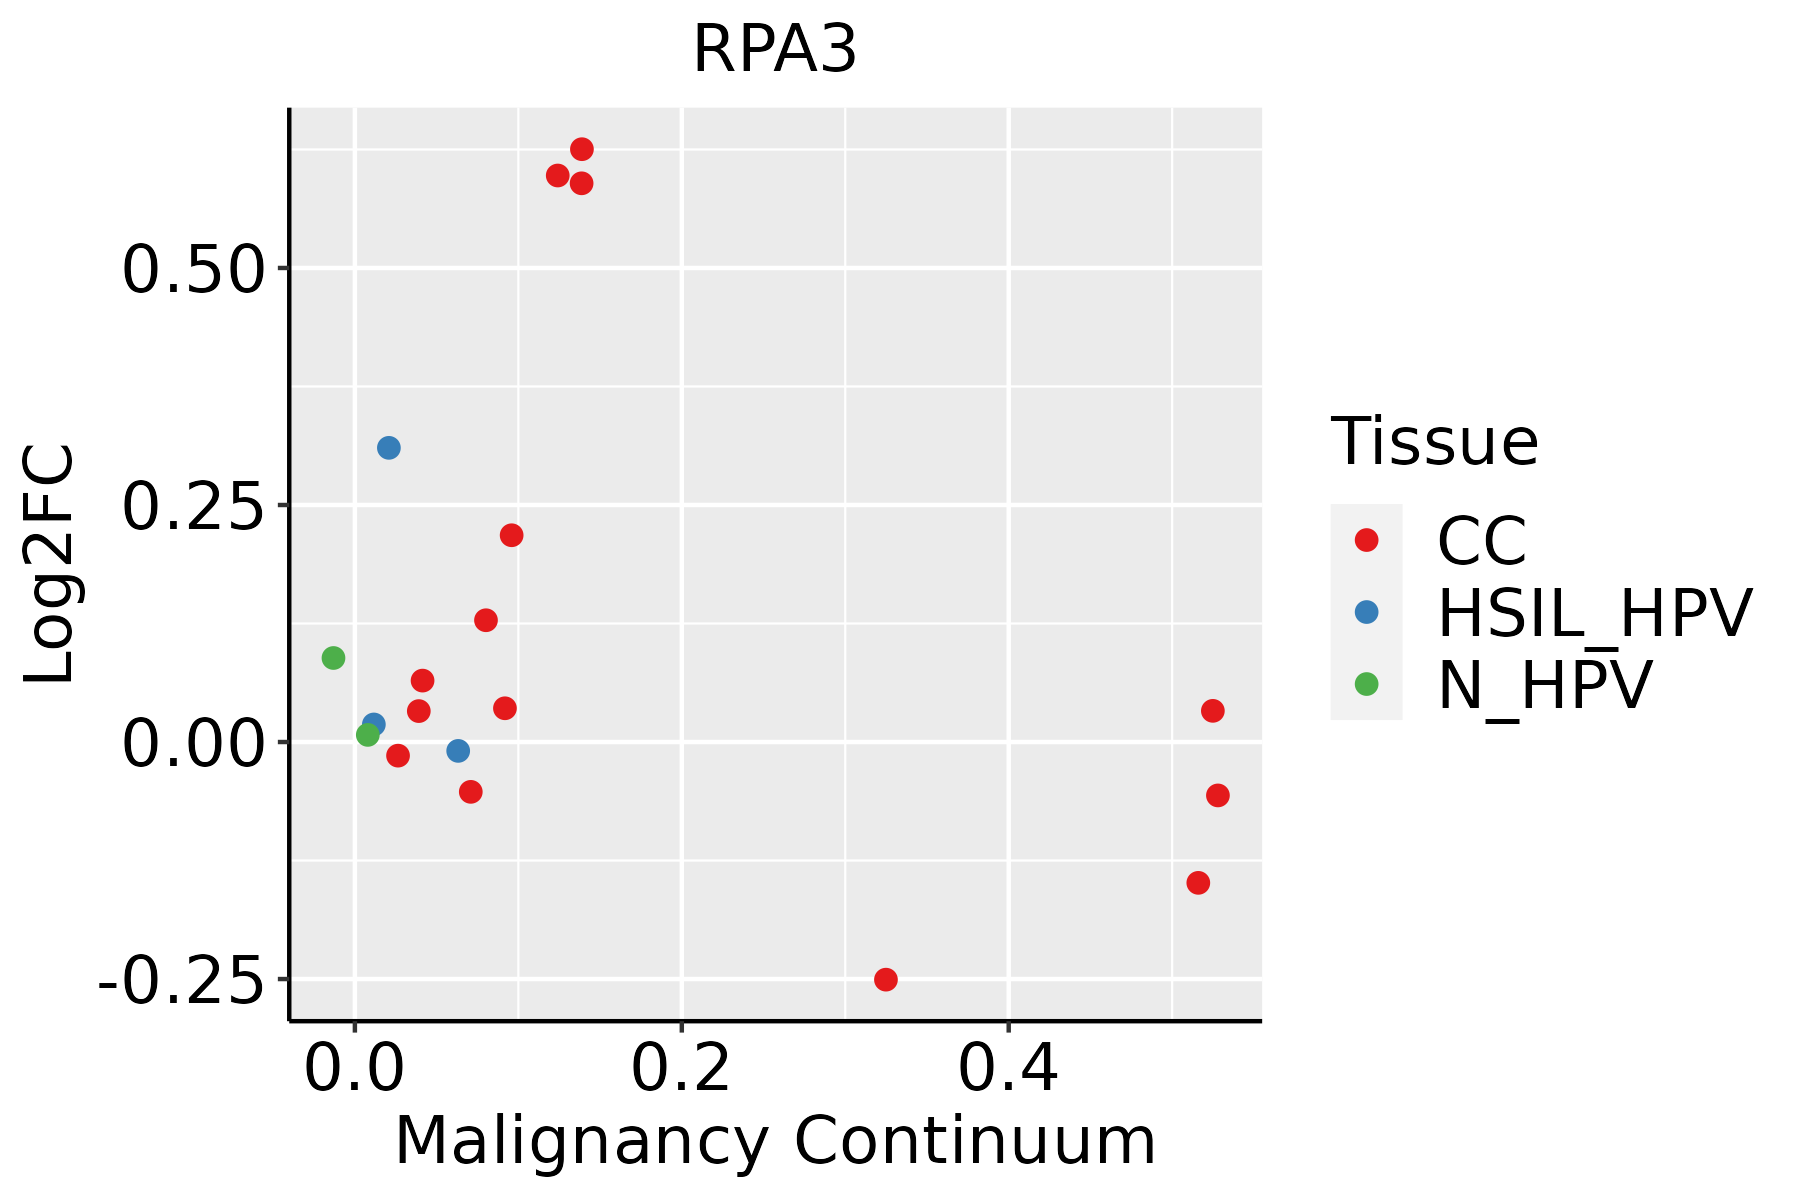 | CC: Cervix cancer |
| HSIL_HPV: HPV-infected high-grade squamous intraepithelial lesions | ||
| N_HPV: HPV-infected normal cervix | ||
| Esophagus | 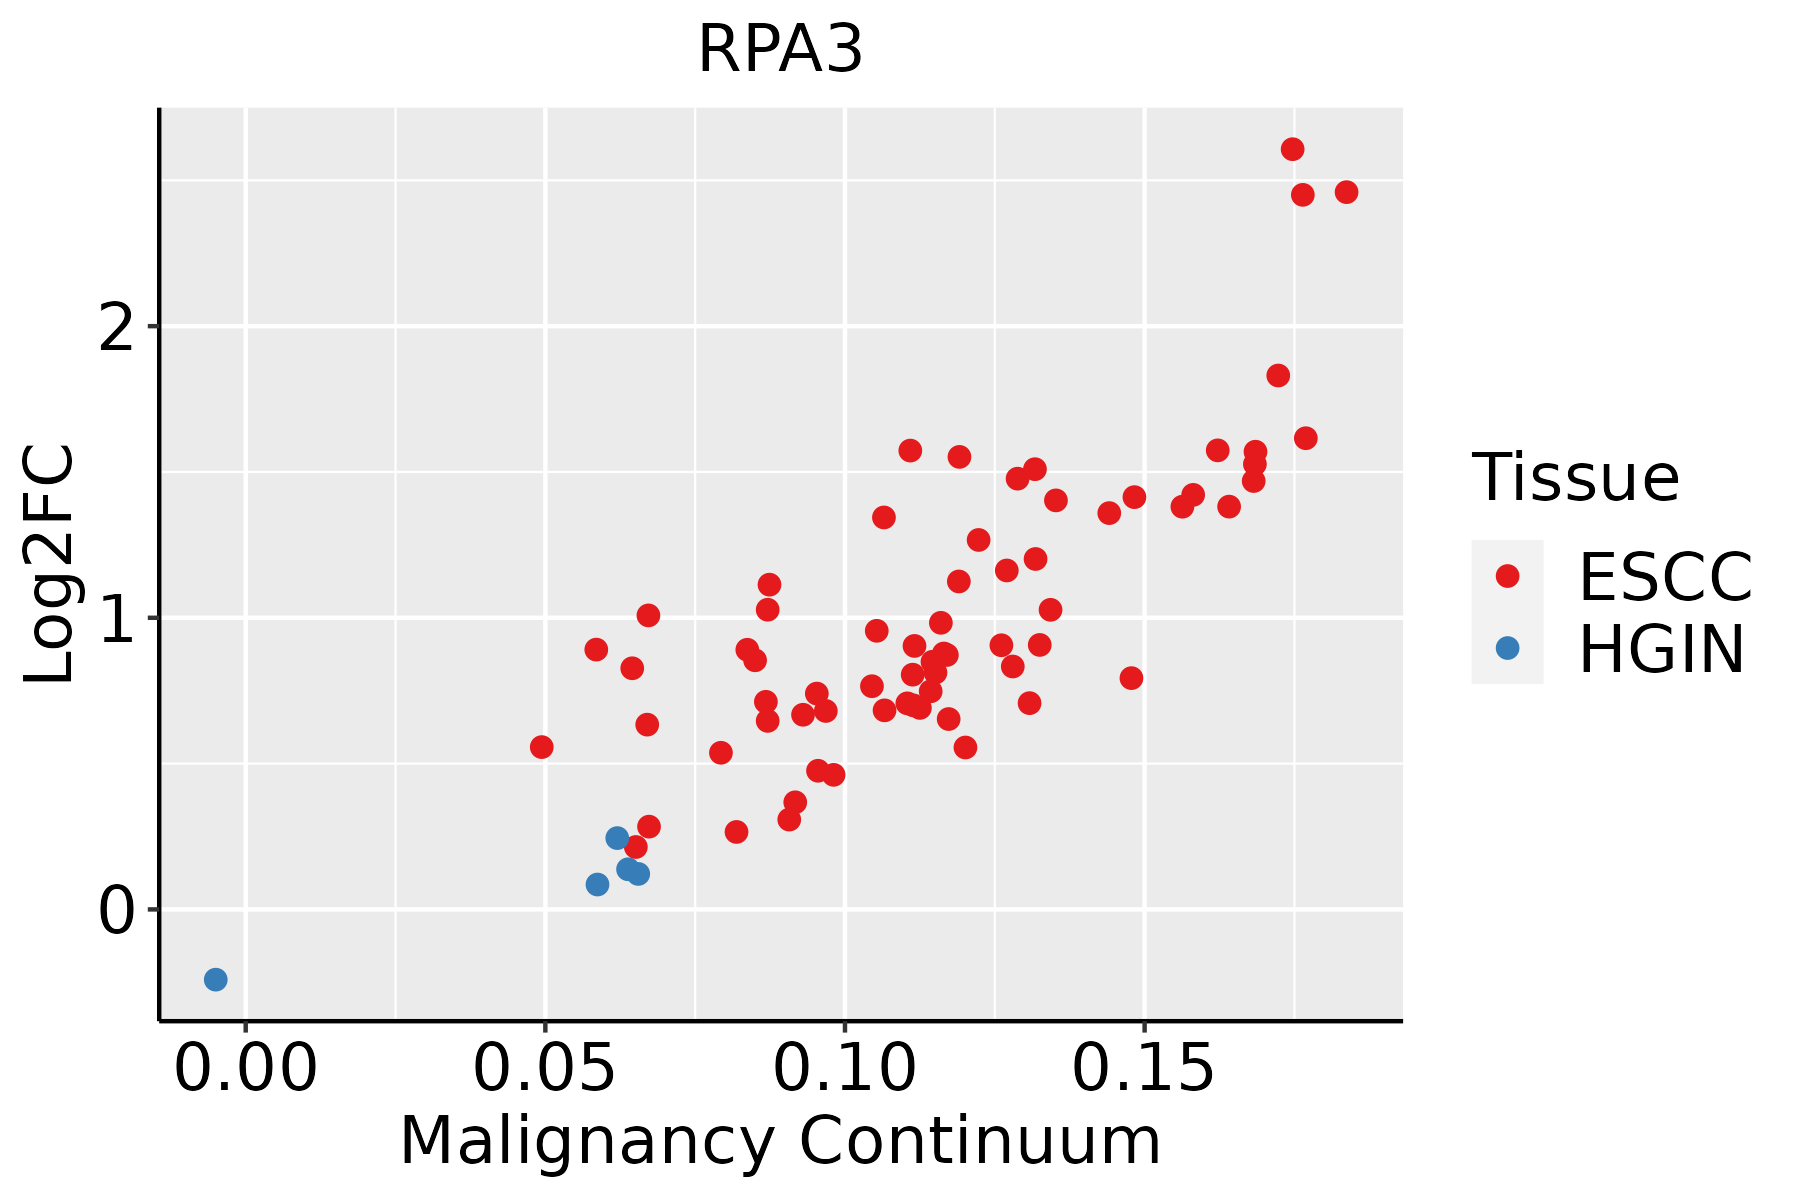 | ESCC: Esophageal squamous cell carcinoma |
| HGIN: High-grade intraepithelial neoplasias | ||
| LGIN: Low-grade intraepithelial neoplasias | ||
| Liver |  | HCC: Hepatocellular carcinoma |
| NAFLD: Non-alcoholic fatty liver disease | ||
| Oral Cavity | 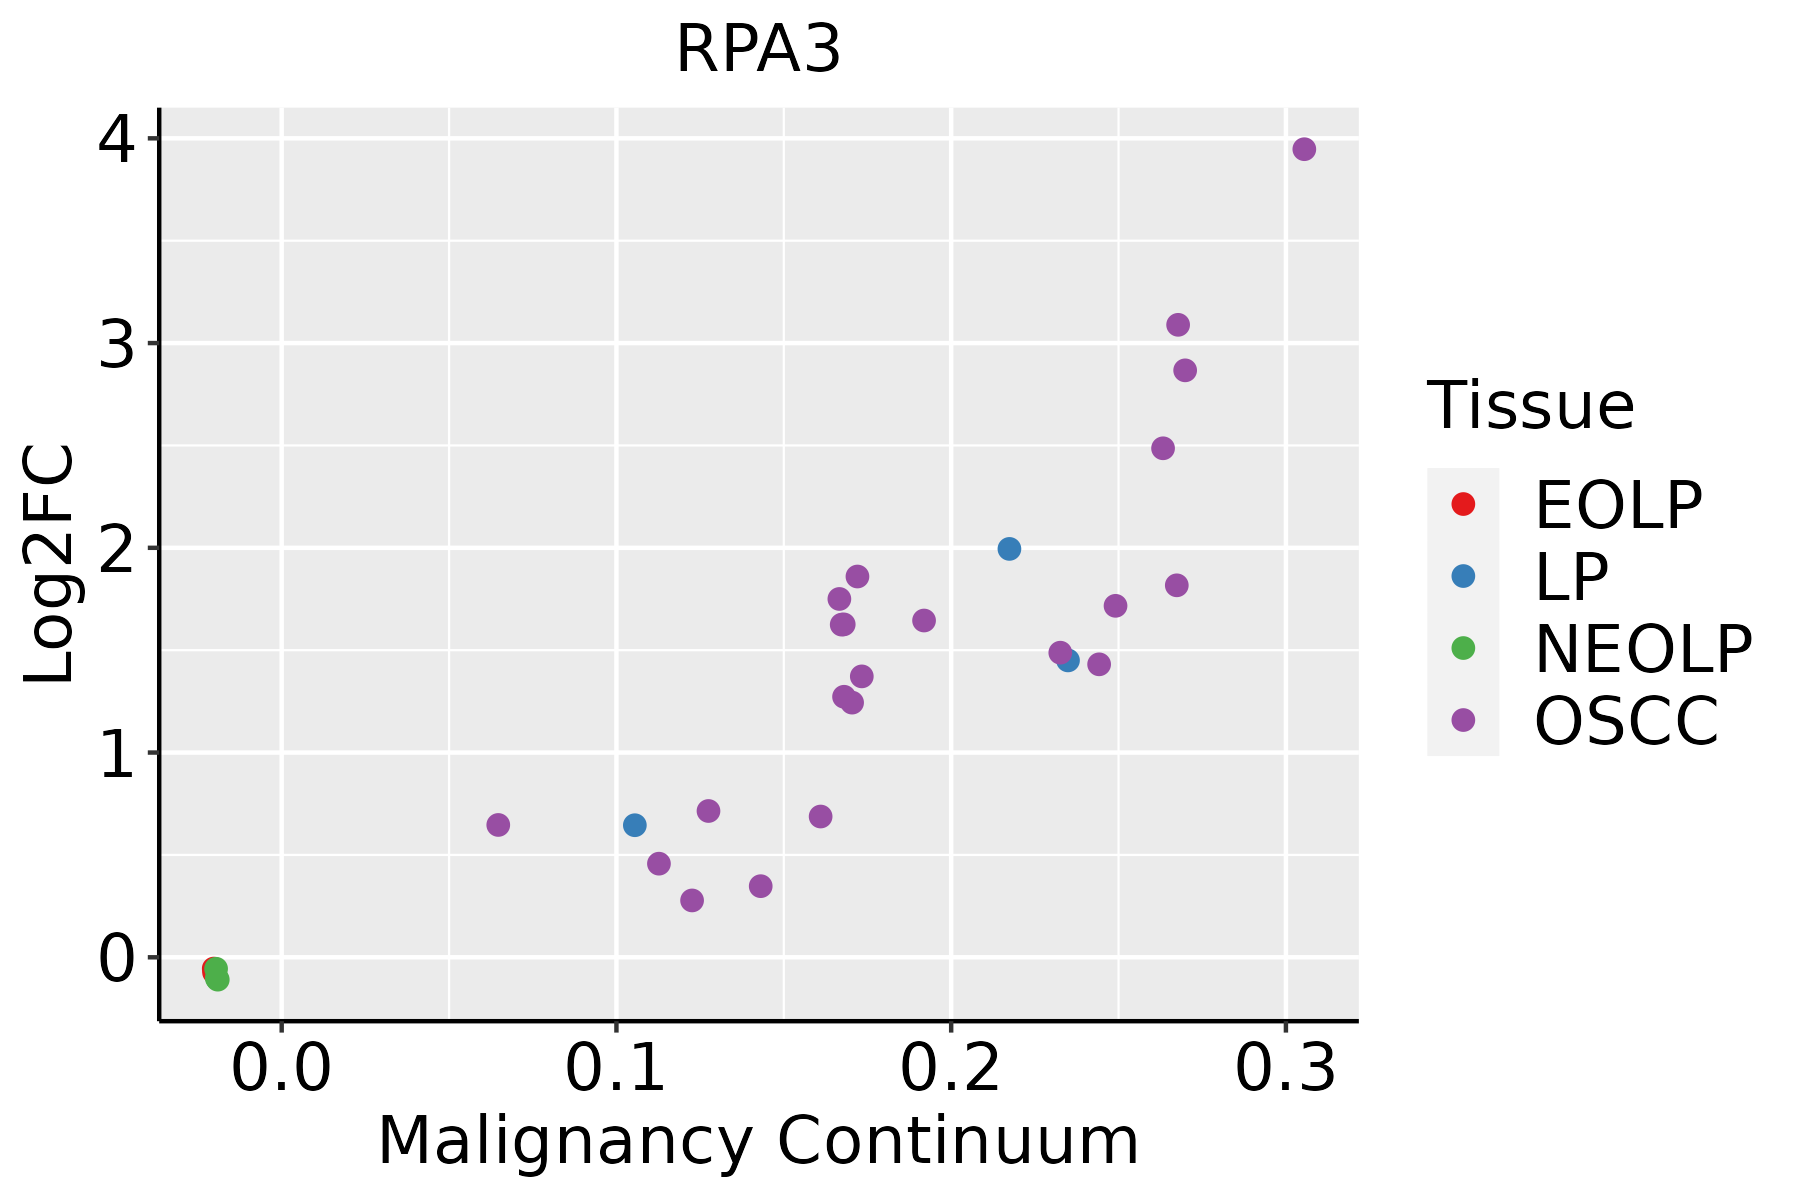 | EOLP: Erosive Oral lichen planus |
| LP: leukoplakia | ||
| NEOLP: Non-erosive oral lichen planus | ||
| OSCC: Oral squamous cell carcinoma | ||
| Skin | 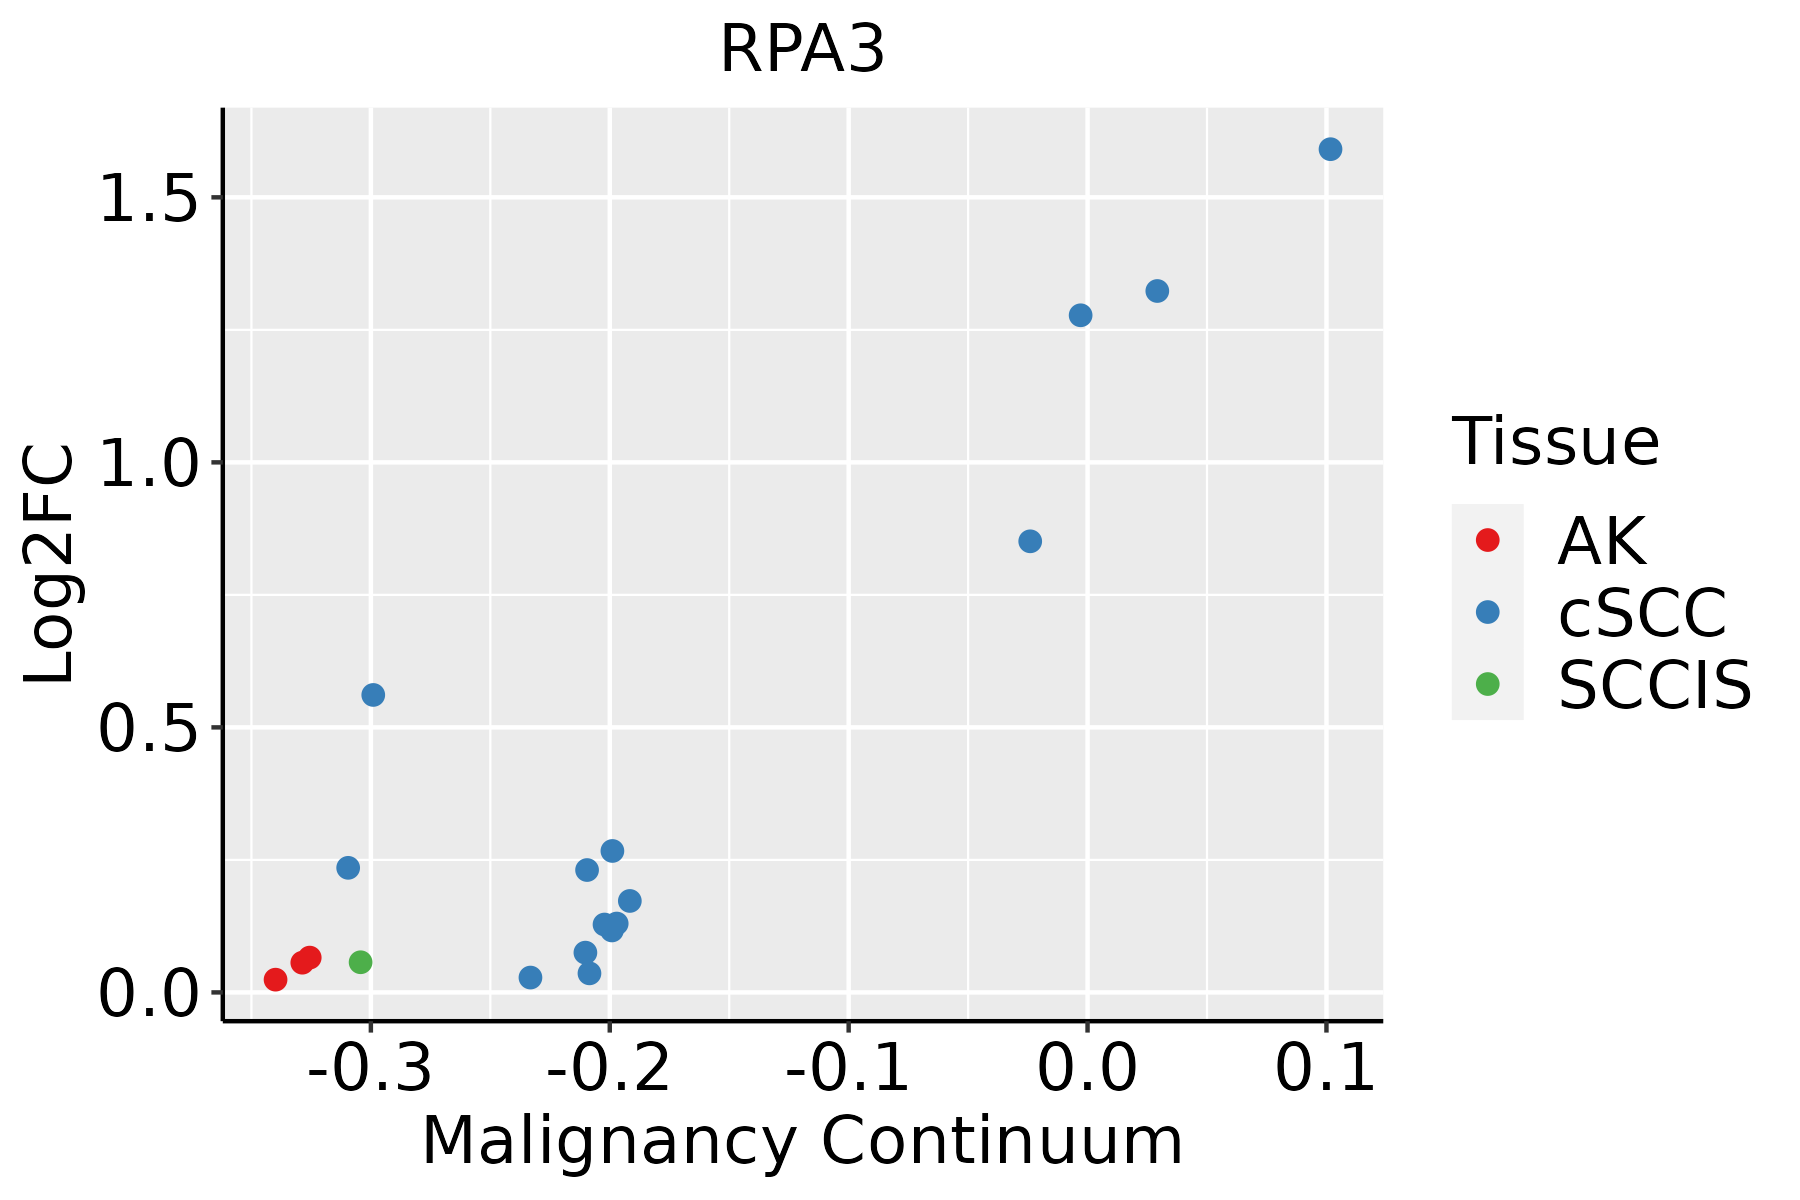 | AK: Actinic keratosis |
| cSCC: Cutaneous squamous cell carcinoma | ||
| SCCIS:squamous cell carcinoma in situ | ||
| Thyroid | 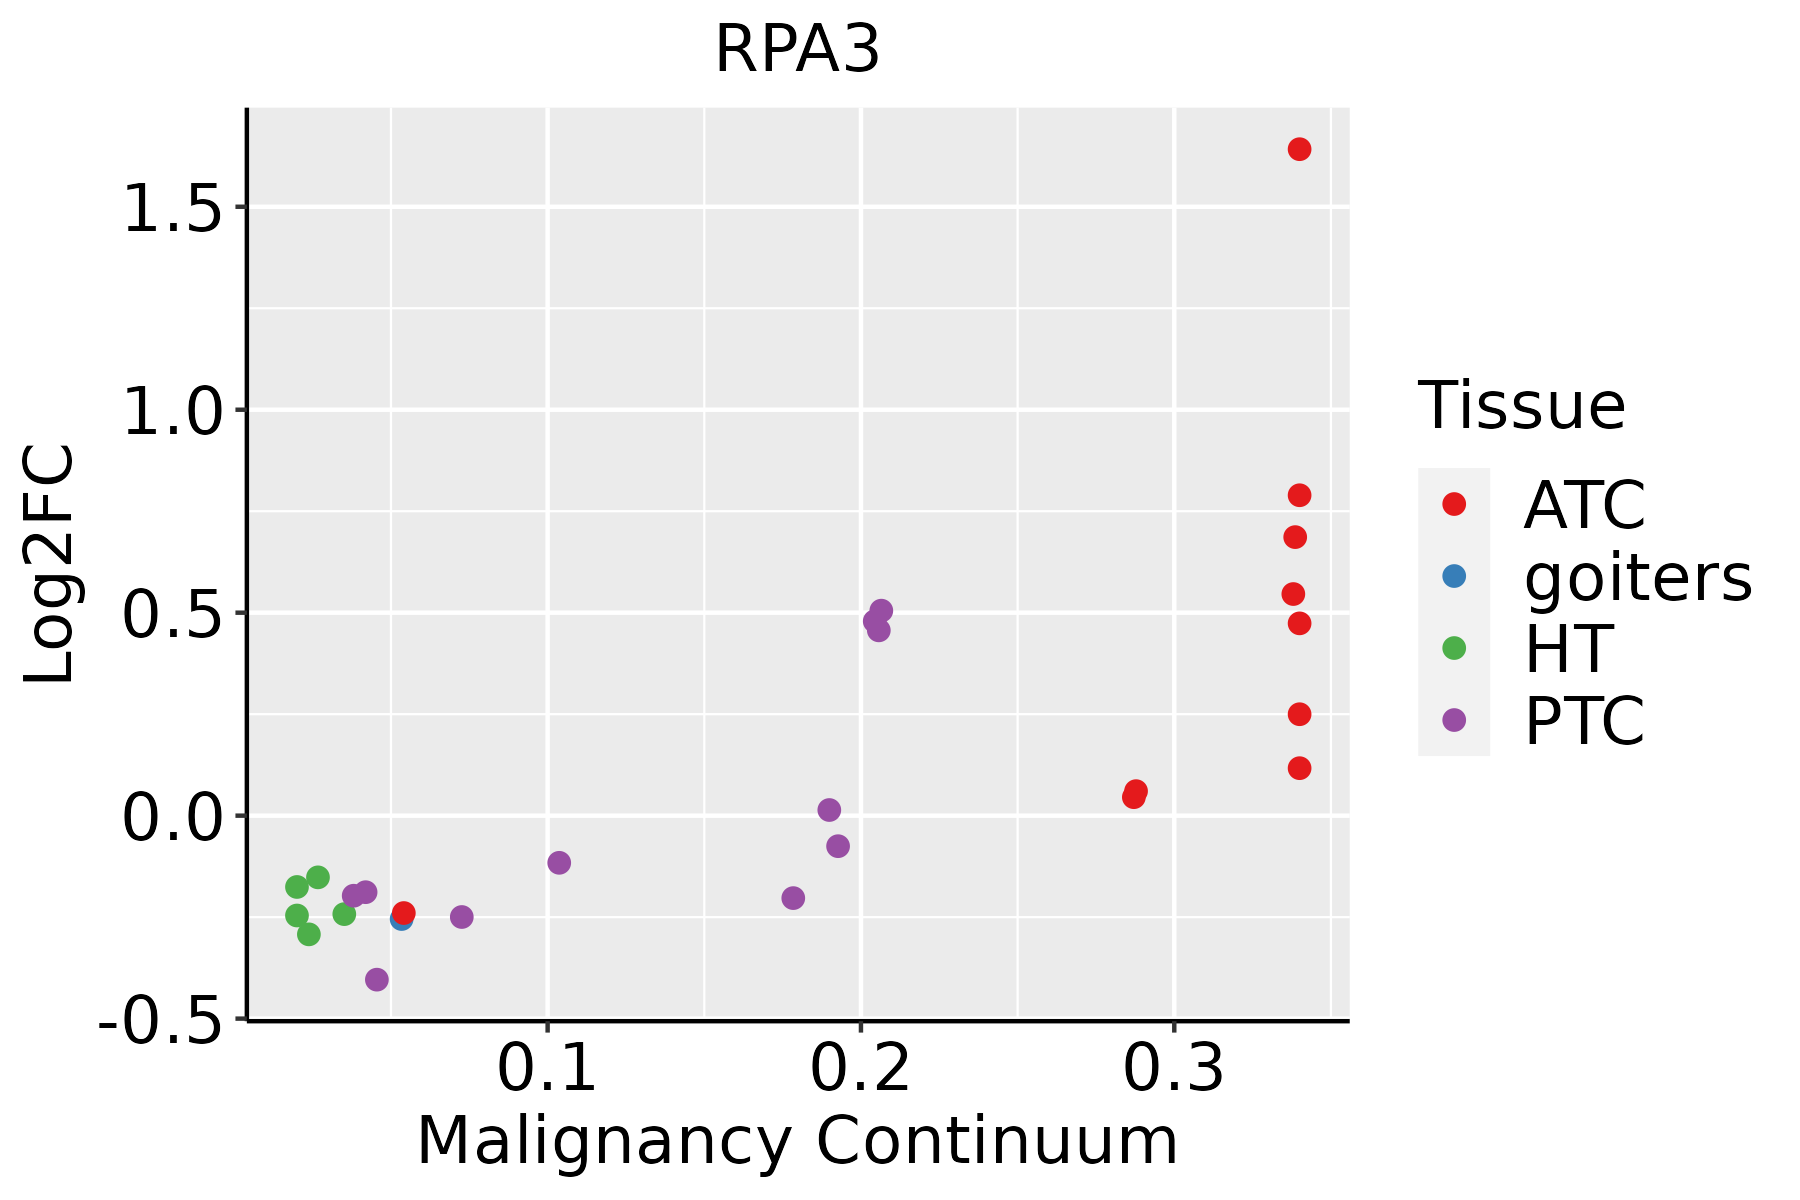 | ATC: Anaplastic thyroid cancer |
| HT: Hashimoto's thyroiditis | ||
| PTC: Papillary thyroid cancer |
| ∗log2FC in expression of this searched gene in stem-like cells from each diseased tissue sample relative to stem-like cells in normal samples in each tissue plotted against the malignancy continuum. Samples are colored based on if they are from different disease stage. |
Top |
Malignant transformation related pathway analysis |
| Find out the enriched GO biological processes and KEGG pathways involved in transition from healthy to precancer to cancer |
| Tissue | Disease Stage | Enriched GO biological Processes |
| Colorectum | AD |  |
| Colorectum | SER |  |
| Colorectum | MSS |  |
| Colorectum | MSI-H |  |
| Colorectum | FAP |  |
| ∗Top 15 enriched GO BP terms are showed in the bar plot of each disease state in each tissue. Each row represents a significant GO biological process which is colored according to the -log10(p.adjust). |
| Page: 1 2 3 4 5 6 7 8 9 |
| GO ID | Tissue | Disease Stage | Description | Gene Ratio | Bg Ratio | pvalue | p.adjust | Count |
| GO:00007238 | Breast | Precancer | telomere maintenance | 20/1080 | 131/18723 | 6.10e-05 | 1.25e-03 | 20 |
| GO:00322003 | Breast | Precancer | telomere organization | 20/1080 | 159/18723 | 8.45e-04 | 9.82e-03 | 20 |
| GO:000072312 | Breast | IDC | telomere maintenance | 21/1434 | 131/18723 | 9.62e-04 | 1.09e-02 | 21 |
| GO:00073465 | Breast | IDC | regulation of mitotic cell cycle | 51/1434 | 457/18723 | 4.30e-03 | 3.35e-02 | 51 |
| GO:000072321 | Breast | DCIS | telomere maintenance | 21/1390 | 131/18723 | 6.45e-04 | 7.96e-03 | 21 |
| GO:000734612 | Breast | DCIS | regulation of mitotic cell cycle | 52/1390 | 457/18723 | 1.38e-03 | 1.43e-02 | 52 |
| GO:003220011 | Breast | DCIS | telomere organization | 21/1390 | 159/18723 | 7.13e-03 | 4.85e-02 | 21 |
| GO:00073466 | Cervix | CC | regulation of mitotic cell cycle | 88/2311 | 457/18723 | 1.26e-05 | 2.60e-04 | 88 |
| GO:00062602 | Cervix | CC | DNA replication | 48/2311 | 260/18723 | 2.70e-03 | 1.85e-02 | 48 |
| GO:00007239 | Cervix | CC | telomere maintenance | 26/2311 | 131/18723 | 9.33e-03 | 4.66e-02 | 26 |
| GO:000072318 | Esophagus | HGIN | telomere maintenance | 38/2587 | 131/18723 | 4.38e-06 | 1.42e-04 | 38 |
| GO:000734610 | Esophagus | HGIN | regulation of mitotic cell cycle | 98/2587 | 457/18723 | 4.39e-06 | 1.42e-04 | 98 |
| GO:00322007 | Esophagus | HGIN | telomere organization | 38/2587 | 159/18723 | 4.23e-04 | 6.39e-03 | 38 |
| GO:00062892 | Esophagus | HGIN | nucleotide-excision repair | 16/2587 | 60/18723 | 6.22e-03 | 4.95e-02 | 16 |
| GO:000734615 | Esophagus | ESCC | regulation of mitotic cell cycle | 293/8552 | 457/18723 | 8.00e-16 | 5.64e-14 | 293 |
| GO:00062604 | Esophagus | ESCC | DNA replication | 181/8552 | 260/18723 | 3.55e-15 | 2.05e-13 | 181 |
| GO:000072319 | Esophagus | ESCC | telomere maintenance | 99/8552 | 131/18723 | 2.68e-12 | 1.08e-10 | 99 |
| GO:00063024 | Esophagus | ESCC | double-strand break repair | 152/8552 | 251/18723 | 1.33e-06 | 1.62e-05 | 152 |
| GO:003220014 | Esophagus | ESCC | telomere organization | 99/8552 | 159/18723 | 1.77e-05 | 1.57e-04 | 99 |
| GO:00062843 | Esophagus | ESCC | base-excision repair | 33/8552 | 43/18723 | 3.25e-05 | 2.69e-04 | 33 |
| Page: 1 2 3 4 |
| Pathway ID | Tissue | Disease Stage | Description | Gene Ratio | Bg Ratio | pvalue | p.adjust | qvalue | Count |
| hsa034205 | Esophagus | HGIN | Nucleotide excision repair | 29/1383 | 63/8465 | 2.96e-08 | 5.36e-07 | 4.26e-07 | 29 |
| hsa0342012 | Esophagus | HGIN | Nucleotide excision repair | 29/1383 | 63/8465 | 2.96e-08 | 5.36e-07 | 4.26e-07 | 29 |
| hsa0342022 | Esophagus | ESCC | Nucleotide excision repair | 54/4205 | 63/8465 | 2.01e-09 | 2.17e-08 | 1.11e-08 | 54 |
| hsa030304 | Esophagus | ESCC | DNA replication | 32/4205 | 36/8465 | 7.71e-07 | 5.06e-06 | 2.59e-06 | 32 |
| hsa034304 | Esophagus | ESCC | Mismatch repair | 21/4205 | 23/8465 | 2.85e-05 | 1.35e-04 | 6.90e-05 | 21 |
| hsa0342032 | Esophagus | ESCC | Nucleotide excision repair | 54/4205 | 63/8465 | 2.01e-09 | 2.17e-08 | 1.11e-08 | 54 |
| hsa0303011 | Esophagus | ESCC | DNA replication | 32/4205 | 36/8465 | 7.71e-07 | 5.06e-06 | 2.59e-06 | 32 |
| hsa0343011 | Esophagus | ESCC | Mismatch repair | 21/4205 | 23/8465 | 2.85e-05 | 1.35e-04 | 6.90e-05 | 21 |
| hsa03420 | Liver | Cirrhotic | Nucleotide excision repair | 29/2530 | 63/8465 | 4.81e-03 | 1.74e-02 | 1.07e-02 | 29 |
| hsa034201 | Liver | Cirrhotic | Nucleotide excision repair | 29/2530 | 63/8465 | 4.81e-03 | 1.74e-02 | 1.07e-02 | 29 |
| hsa034202 | Liver | HCC | Nucleotide excision repair | 41/4020 | 63/8465 | 3.59e-03 | 1.12e-02 | 6.22e-03 | 41 |
| hsa034203 | Liver | HCC | Nucleotide excision repair | 41/4020 | 63/8465 | 3.59e-03 | 1.12e-02 | 6.22e-03 | 41 |
| hsa034204 | Oral cavity | OSCC | Nucleotide excision repair | 49/3704 | 63/8465 | 3.48e-08 | 2.91e-07 | 1.48e-07 | 49 |
| hsa03030 | Oral cavity | OSCC | DNA replication | 31/3704 | 36/8465 | 1.70e-07 | 1.19e-06 | 6.03e-07 | 31 |
| hsa03430 | Oral cavity | OSCC | Mismatch repair | 19/3704 | 23/8465 | 1.55e-04 | 5.34e-04 | 2.72e-04 | 19 |
| hsa0342011 | Oral cavity | OSCC | Nucleotide excision repair | 49/3704 | 63/8465 | 3.48e-08 | 2.91e-07 | 1.48e-07 | 49 |
| hsa030301 | Oral cavity | OSCC | DNA replication | 31/3704 | 36/8465 | 1.70e-07 | 1.19e-06 | 6.03e-07 | 31 |
| hsa034301 | Oral cavity | OSCC | Mismatch repair | 19/3704 | 23/8465 | 1.55e-04 | 5.34e-04 | 2.72e-04 | 19 |
| hsa0342021 | Oral cavity | LP | Nucleotide excision repair | 37/2418 | 63/8465 | 5.14e-07 | 6.33e-06 | 4.08e-06 | 37 |
| hsa030302 | Oral cavity | LP | DNA replication | 23/2418 | 36/8465 | 1.08e-05 | 7.79e-05 | 5.02e-05 | 23 |
| Page: 1 2 |
Top |
Cell-cell communication analysis |
| Identification of potential cell-cell interactions between two cell types and their ligand-receptor pairs for different disease states |
| Ligand | Receptor | LRpair | Pathway | Tissue | Disease Stage |
| Page: 1 |
Top |
Single-cell gene regulatory network inference analysis |
| Find out the significant the regulons (TFs) and the target genes of each regulon across cell types for different disease states |
| TF | Cell Type | Tissue | Disease Stage | Target Gene | RSS | Regulon Activity |
| ∗The dot plots of a searched regulon are shown for all cell subpopulations in each disease state of each tissue based on the regulon specific score inferred using pySCENIC and by calculating the average expression. |
| Page: 1 |
Top |
Somatic mutation of malignant transformation related genes |
| Annotation of somatic variants for genes involved in malignant transformation |
| Hugo Symbol | Variant Class | Variant Classification | dbSNP RS | HGVSc | HGVSp | HGVSp Short | SWISSPROT | BIOTYPE | SIFT | PolyPhen | Tumor Sample Barcode | Tissue | Histology | Sex | Age | Stage | Therapy Types | Drugs | Outcome |
| RPA3 | SNV | Missense_Mutation | c.345A>T | p.Leu115Phe | p.L115F | P35244 | protein_coding | tolerated(1) | benign(0) | TCGA-AR-A256-01 | Breast | breast invasive carcinoma | Female | <65 | I/II | Chemotherapy | doxorubicin | PD | |
| RPA3 | SNV | Missense_Mutation | c.7G>A | p.Asp3Asn | p.D3N | P35244 | protein_coding | deleterious(0.04) | possibly_damaging(0.554) | TCGA-D8-A27W-01 | Breast | breast invasive carcinoma | Female | <65 | III/IV | Chemotherapy | doxorubicine+cyclophosphamide | SD | |
| RPA3 | SNV | Missense_Mutation | c.160G>A | p.Glu54Lys | p.E54K | P35244 | protein_coding | deleterious(0.02) | probably_damaging(0.992) | TCGA-G4-6309-01 | Colorectum | colon adenocarcinoma | Female | <65 | III/IV | Chemotherapy | xeloda | PD | |
| RPA3 | SNV | Missense_Mutation | novel | c.278N>A | p.Pro93His | p.P93H | P35244 | protein_coding | deleterious(0.03) | benign(0.388) | TCGA-AX-A06F-01 | Endometrium | uterine corpus endometrioid carcinoma | Female | <65 | III/IV | Chemotherapy | carboplatin | SD |
| RPA3 | SNV | Missense_Mutation | c.361G>T | p.Asp121Tyr | p.D121Y | P35244 | protein_coding | deleterious_low_confidence(0) | benign(0.365) | TCGA-B5-A11H-01 | Endometrium | uterine corpus endometrioid carcinoma | Female | >=65 | III/IV | Hormone Therapy | megace | SD | |
| RPA3 | SNV | Missense_Mutation | c.44N>C | p.Gly15Ala | p.G15A | P35244 | protein_coding | tolerated(0.19) | benign(0) | TCGA-44-7660-01 | Lung | lung adenocarcinoma | Male | >=65 | I/II | Vaccine | recprame+as15 | PD | |
| RPA3 | SNV | Missense_Mutation | novel | c.68N>T | p.Lys23Met | p.K23M | P35244 | protein_coding | deleterious(0) | benign(0.274) | TCGA-MF-A522-01 | Lung | lung squamous cell carcinoma | Male | <65 | I/II | Chemotherapy | cisplatin | PD |
| RPA3 | SNV | Missense_Mutation | rs774710098 | c.352N>A | p.Val118Met | p.V118M | P35244 | protein_coding | tolerated(0.13) | benign(0.001) | TCGA-B7-5818-01 | Stomach | stomach adenocarcinoma | Male | <65 | I/II | Unknown | Unknown | SD |
| Page: 1 |
Top |
Related drugs of malignant transformation related genes |
| Identification of chemicals and drugs interact with genes involved in malignant transfromation |
| (DGIdb 4.0) |
| Entrez ID | Symbol | Category | Interaction Types | Drug Claim Name | Drug Name | PMIDs |
| Page: 1 |

Copyright 2023-Present -The University of Texas Health Science Center at Houston |