
|
|||||
|
 | |
| |
| |
| |
| |
| |
|
Gene: RP9 |
Gene summary for RP9 |
| Gene information | Species | Human | Gene symbol | RP9 | Gene ID | 6100 |
| Gene name | RP9 pre-mRNA splicing factor | |
| Gene Alias | PAP-1 | |
| Cytomap | 7p14.3 | |
| Gene Type | protein-coding | GO ID | GO:0003008 | UniProtAcc | A0A090N8Z0 |
Top |
Malignant transformation analysis |
| Identification of the aberrant gene expression in precancerous and cancerous lesions by comparing the gene expression of stem-like cells in diseased tissues with normal stem cells |
| Entrez ID | Symbol | Replicates | Species | Organ | Tissue | Adj P-value | Log2FC | Malignancy |
| 6100 | RP9 | LZE4T | Human | Esophagus | ESCC | 1.13e-11 | 2.52e-01 | 0.0811 |
| 6100 | RP9 | LZE7T | Human | Esophagus | ESCC | 4.79e-02 | 2.87e-01 | 0.0667 |
| 6100 | RP9 | LZE22T | Human | Esophagus | ESCC | 1.20e-07 | 5.67e-01 | 0.068 |
| 6100 | RP9 | LZE24T | Human | Esophagus | ESCC | 3.43e-06 | 3.10e-01 | 0.0596 |
| 6100 | RP9 | LZE21T | Human | Esophagus | ESCC | 1.20e-02 | 7.81e-02 | 0.0655 |
| 6100 | RP9 | P1T-E | Human | Esophagus | ESCC | 3.40e-05 | 3.82e-01 | 0.0875 |
| 6100 | RP9 | P2T-E | Human | Esophagus | ESCC | 5.60e-40 | 7.46e-01 | 0.1177 |
| 6100 | RP9 | P4T-E | Human | Esophagus | ESCC | 2.24e-23 | 7.17e-01 | 0.1323 |
| 6100 | RP9 | P5T-E | Human | Esophagus | ESCC | 7.00e-03 | 1.18e-01 | 0.1327 |
| 6100 | RP9 | P8T-E | Human | Esophagus | ESCC | 1.28e-15 | 3.40e-01 | 0.0889 |
| 6100 | RP9 | P9T-E | Human | Esophagus | ESCC | 4.90e-18 | 4.03e-01 | 0.1131 |
| 6100 | RP9 | P10T-E | Human | Esophagus | ESCC | 2.22e-33 | 6.30e-01 | 0.116 |
| 6100 | RP9 | P11T-E | Human | Esophagus | ESCC | 1.57e-09 | 5.35e-01 | 0.1426 |
| 6100 | RP9 | P12T-E | Human | Esophagus | ESCC | 1.25e-33 | 6.53e-01 | 0.1122 |
| 6100 | RP9 | P15T-E | Human | Esophagus | ESCC | 1.26e-18 | 5.17e-01 | 0.1149 |
| 6100 | RP9 | P16T-E | Human | Esophagus | ESCC | 4.95e-37 | 7.67e-01 | 0.1153 |
| 6100 | RP9 | P17T-E | Human | Esophagus | ESCC | 2.77e-12 | 3.68e-01 | 0.1278 |
| 6100 | RP9 | P19T-E | Human | Esophagus | ESCC | 1.18e-05 | 6.40e-01 | 0.1662 |
| 6100 | RP9 | P20T-E | Human | Esophagus | ESCC | 1.21e-20 | 5.38e-01 | 0.1124 |
| 6100 | RP9 | P21T-E | Human | Esophagus | ESCC | 1.41e-25 | 4.83e-01 | 0.1617 |
| Page: 1 2 3 4 5 6 |
| Tissue | Expression Dynamics | Abbreviation |
| Esophagus | 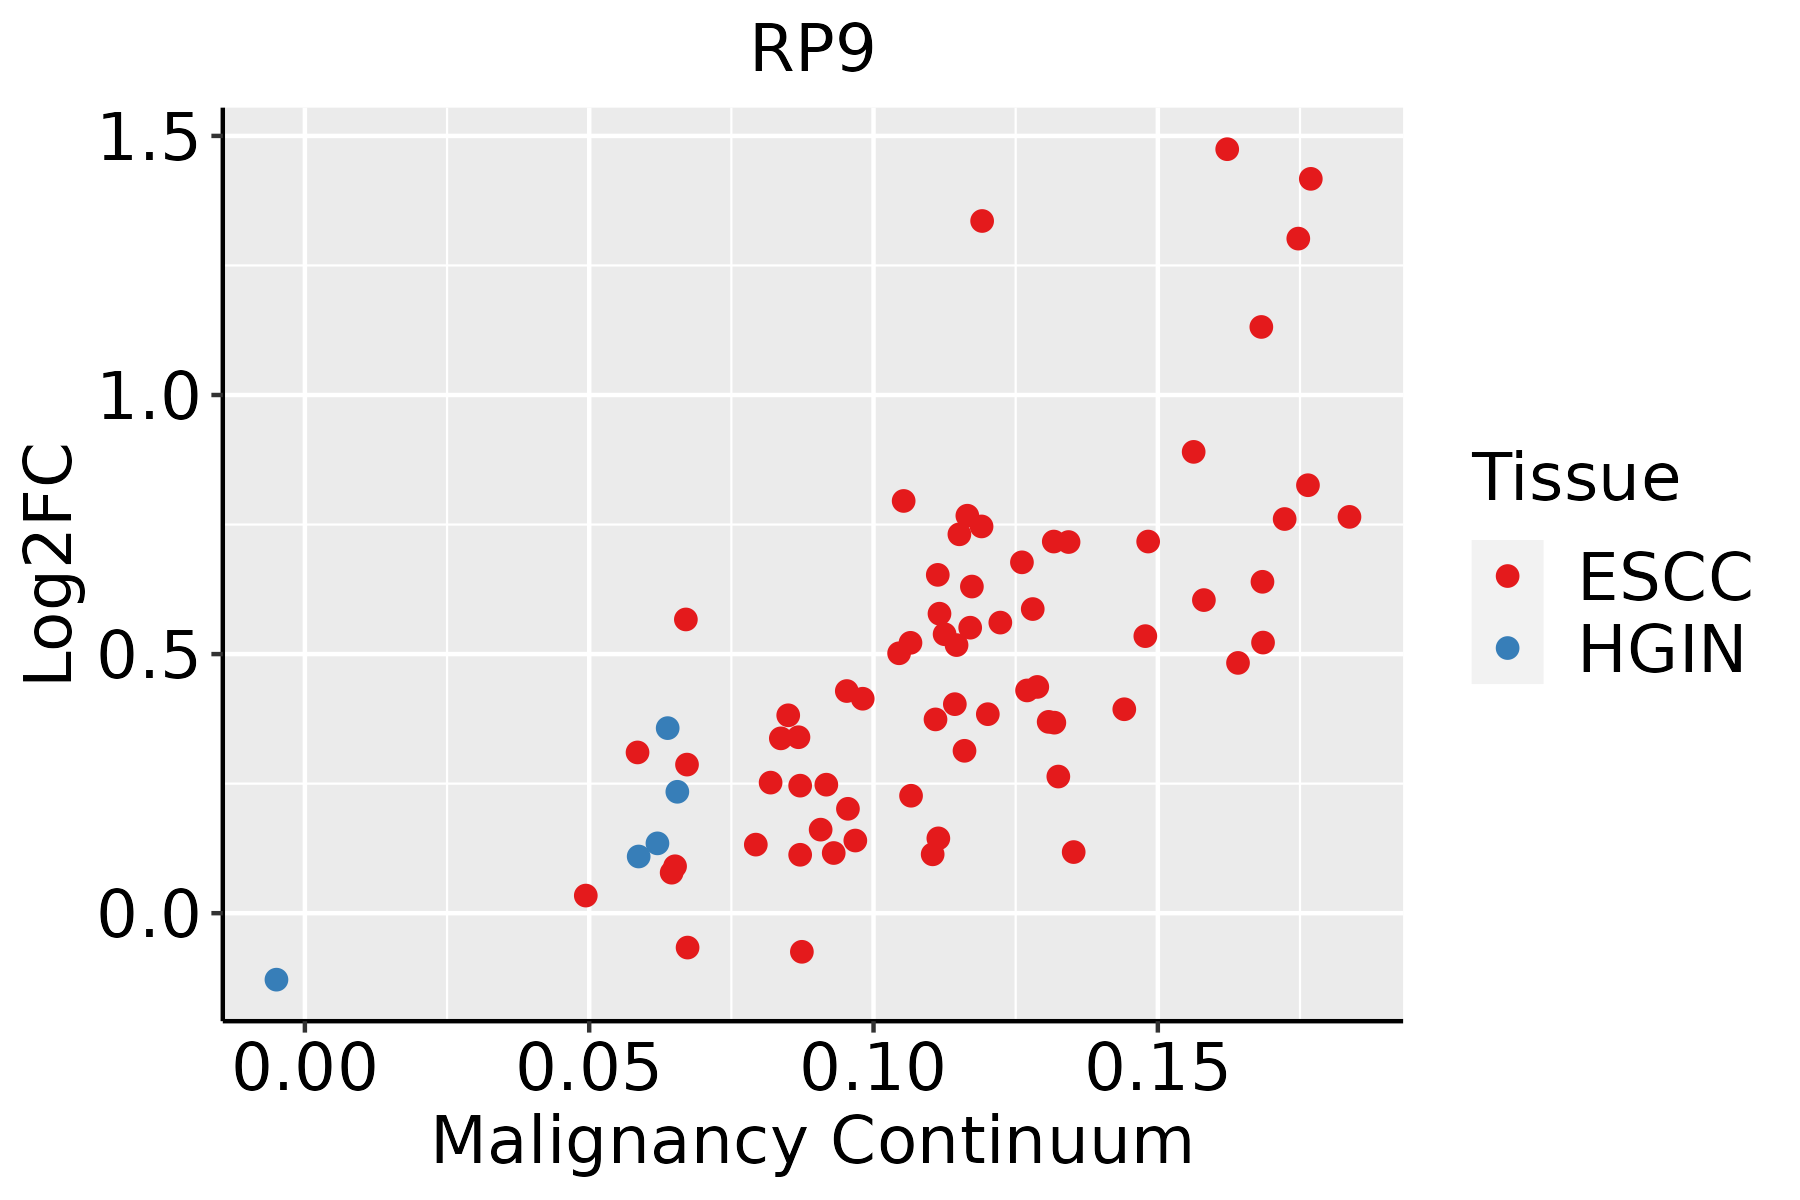 | ESCC: Esophageal squamous cell carcinoma |
| HGIN: High-grade intraepithelial neoplasias | ||
| LGIN: Low-grade intraepithelial neoplasias | ||
| Liver |  | HCC: Hepatocellular carcinoma |
| NAFLD: Non-alcoholic fatty liver disease | ||
| Oral Cavity |  | EOLP: Erosive Oral lichen planus |
| LP: leukoplakia | ||
| NEOLP: Non-erosive oral lichen planus | ||
| OSCC: Oral squamous cell carcinoma | ||
| Thyroid |  | ATC: Anaplastic thyroid cancer |
| HT: Hashimoto's thyroiditis | ||
| PTC: Papillary thyroid cancer |
| ∗log2FC in expression of this searched gene in stem-like cells from each diseased tissue sample relative to stem-like cells in normal samples in each tissue plotted against the malignancy continuum. Samples are colored based on if they are from different disease stage. |
Top |
Malignant transformation related pathway analysis |
| Find out the enriched GO biological processes and KEGG pathways involved in transition from healthy to precancer to cancer |
| Tissue | Disease Stage | Enriched GO biological Processes |
| Colorectum | AD |  |
| Colorectum | SER |  |
| Colorectum | MSS |  |
| Colorectum | MSI-H |  |
| Colorectum | FAP |  |
| ∗Top 15 enriched GO BP terms are showed in the bar plot of each disease state in each tissue. Each row represents a significant GO biological process which is colored according to the -log10(p.adjust). |
| Page: 1 2 3 4 5 6 7 8 9 |
| GO ID | Tissue | Disease Stage | Description | Gene Ratio | Bg Ratio | pvalue | p.adjust | Count |
| GO:00064179 | Breast | Precancer | regulation of translation | 67/1080 | 468/18723 | 4.71e-12 | 7.64e-10 | 67 |
| GO:00709725 | Breast | Precancer | protein localization to endoplasmic reticulum | 15/1080 | 74/18723 | 1.74e-05 | 4.17e-04 | 15 |
| GO:00066059 | Breast | Precancer | protein targeting | 33/1080 | 314/18723 | 6.50e-04 | 7.99e-03 | 33 |
| GO:00725948 | Breast | Precancer | establishment of protein localization to organelle | 41/1080 | 422/18723 | 7.75e-04 | 9.20e-03 | 41 |
| GO:00064147 | Breast | Precancer | translational elongation | 10/1080 | 55/18723 | 1.06e-03 | 1.18e-02 | 10 |
| GO:000641714 | Breast | IDC | regulation of translation | 74/1434 | 468/18723 | 1.67e-09 | 1.53e-07 | 74 |
| GO:007097213 | Breast | IDC | protein localization to endoplasmic reticulum | 18/1434 | 74/18723 | 8.58e-06 | 2.47e-04 | 18 |
| GO:000660514 | Breast | IDC | protein targeting | 43/1434 | 314/18723 | 1.44e-04 | 2.53e-03 | 43 |
| GO:007259413 | Breast | IDC | establishment of protein localization to organelle | 51/1434 | 422/18723 | 7.94e-04 | 9.55e-03 | 51 |
| GO:000641724 | Breast | DCIS | regulation of translation | 72/1390 | 468/18723 | 2.46e-09 | 2.17e-07 | 72 |
| GO:007097222 | Breast | DCIS | protein localization to endoplasmic reticulum | 18/1390 | 74/18723 | 5.57e-06 | 1.60e-04 | 18 |
| GO:000660523 | Breast | DCIS | protein targeting | 43/1390 | 314/18723 | 7.17e-05 | 1.41e-03 | 43 |
| GO:007259423 | Breast | DCIS | establishment of protein localization to organelle | 51/1390 | 422/18723 | 3.91e-04 | 5.40e-03 | 51 |
| GO:000641413 | Breast | DCIS | translational elongation | 10/1390 | 55/18723 | 6.66e-03 | 4.62e-02 | 10 |
| GO:001603210 | Cervix | CC | viral process | 109/2311 | 415/18723 | 5.40e-15 | 6.46e-12 | 109 |
| GO:190382910 | Cervix | CC | positive regulation of cellular protein localization | 72/2311 | 276/18723 | 3.20e-10 | 4.46e-08 | 72 |
| GO:00321035 | Cervix | CC | positive regulation of response to external stimulus | 95/2311 | 427/18723 | 5.44e-09 | 5.03e-07 | 95 |
| GO:00345048 | Cervix | CC | protein localization to nucleus | 68/2311 | 290/18723 | 9.91e-08 | 5.25e-06 | 68 |
| GO:005109810 | Cervix | CC | regulation of binding | 80/2311 | 363/18723 | 1.32e-07 | 6.42e-06 | 80 |
| GO:00313494 | Cervix | CC | positive regulation of defense response | 60/2311 | 278/18723 | 9.38e-06 | 2.11e-04 | 60 |
| Page: 1 2 3 4 5 6 7 8 9 10 11 12 13 14 15 16 17 18 19 20 21 22 23 24 25 26 27 28 29 30 31 32 33 34 |
| Pathway ID | Tissue | Disease Stage | Description | Gene Ratio | Bg Ratio | pvalue | p.adjust | qvalue | Count |
| hsa0304027 | Esophagus | ESCC | Spliceosome | 128/4205 | 217/8465 | 3.31e-03 | 8.79e-03 | 4.50e-03 | 128 |
| hsa0304037 | Esophagus | ESCC | Spliceosome | 128/4205 | 217/8465 | 3.31e-03 | 8.79e-03 | 4.50e-03 | 128 |
| hsa030407 | Liver | Cirrhotic | Spliceosome | 102/2530 | 217/8465 | 5.69e-08 | 9.47e-07 | 5.84e-07 | 102 |
| hsa0304012 | Liver | Cirrhotic | Spliceosome | 102/2530 | 217/8465 | 5.69e-08 | 9.47e-07 | 5.84e-07 | 102 |
| hsa0304022 | Liver | HCC | Spliceosome | 122/4020 | 217/8465 | 5.55e-03 | 1.60e-02 | 8.91e-03 | 122 |
| hsa0304032 | Liver | HCC | Spliceosome | 122/4020 | 217/8465 | 5.55e-03 | 1.60e-02 | 8.91e-03 | 122 |
| hsa0304016 | Oral cavity | OSCC | Spliceosome | 123/3704 | 217/8465 | 7.21e-05 | 2.74e-04 | 1.40e-04 | 123 |
| hsa0304017 | Oral cavity | OSCC | Spliceosome | 123/3704 | 217/8465 | 7.21e-05 | 2.74e-04 | 1.40e-04 | 123 |
| hsa0304026 | Oral cavity | LP | Spliceosome | 106/2418 | 217/8465 | 1.30e-10 | 2.40e-09 | 1.55e-09 | 106 |
| hsa0304036 | Oral cavity | LP | Spliceosome | 106/2418 | 217/8465 | 1.30e-10 | 2.40e-09 | 1.55e-09 | 106 |
| Page: 1 |
Top |
Cell-cell communication analysis |
| Identification of potential cell-cell interactions between two cell types and their ligand-receptor pairs for different disease states |
| Ligand | Receptor | LRpair | Pathway | Tissue | Disease Stage |
| Page: 1 |
Top |
Single-cell gene regulatory network inference analysis |
| Find out the significant the regulons (TFs) and the target genes of each regulon across cell types for different disease states |
| TF | Cell Type | Tissue | Disease Stage | Target Gene | RSS | Regulon Activity |
| ∗The dot plots of a searched regulon are shown for all cell subpopulations in each disease state of each tissue based on the regulon specific score inferred using pySCENIC and by calculating the average expression. |
| Page: 1 |
Top |
Somatic mutation of malignant transformation related genes |
| Annotation of somatic variants for genes involved in malignant transformation |
| Hugo Symbol | Variant Class | Variant Classification | dbSNP RS | HGVSc | HGVSp | HGVSp Short | SWISSPROT | BIOTYPE | SIFT | PolyPhen | Tumor Sample Barcode | Tissue | Histology | Sex | Age | Stage | Therapy Types | Drugs | Outcome |
| RP9 | SNV | Missense_Mutation | c.401N>C | p.Arg134Thr | p.R134T | Q8TA86 | protein_coding | deleterious(0.02) | probably_damaging(0.969) | TCGA-AC-A23H-01 | Breast | breast invasive carcinoma | Female | >=65 | I/II | Unknown | Unknown | PD | |
| RP9 | SNV | Missense_Mutation | c.169C>A | p.Pro57Thr | p.P57T | Q8TA86 | protein_coding | deleterious_low_confidence(0) | probably_damaging(0.999) | TCGA-AN-A046-01 | Breast | breast invasive carcinoma | Female | >=65 | I/II | Unknown | Unknown | SD | |
| RP9 | insertion | Frame_Shift_Ins | novel | c.363_364insAAAAGGATCAATAACAAACGGG | p.Phe122LysfsTer24 | p.F122Kfs*24 | Q8TA86 | protein_coding | TCGA-A8-A07G-01 | Breast | breast invasive carcinoma | Female | >=65 | I/II | Chemotherapy | 5-fluorouracil | CR | ||
| RP9 | SNV | Missense_Mutation | c.319N>A | p.Arg107Ser | p.R107S | Q8TA86 | protein_coding | deleterious(0) | possibly_damaging(0.871) | TCGA-UC-A7PF-01 | Cervix | cervical & endocervical cancer | Female | <65 | I/II | Unknown | Unknown | SD | |
| RP9 | SNV | Missense_Mutation | c.283C>T | p.Pro95Ser | p.P95S | Q8TA86 | protein_coding | deleterious(0.01) | probably_damaging(0.996) | TCGA-AA-3877-01 | Colorectum | colon adenocarcinoma | Female | >=65 | I/II | Unknown | Unknown | SD | |
| RP9 | SNV | Missense_Mutation | c.365N>C | p.Phe122Ser | p.F122S | Q8TA86 | protein_coding | deleterious(0) | benign(0.173) | TCGA-DM-A1D6-01 | Colorectum | colon adenocarcinoma | Male | >=65 | I/II | Unknown | Unknown | SD | |
| RP9 | SNV | Missense_Mutation | c.663N>C | p.Glu221Asp | p.E221D | Q8TA86 | protein_coding | tolerated_low_confidence(1) | benign(0) | TCGA-F4-6703-01 | Colorectum | colon adenocarcinoma | Male | <65 | I/II | Unknown | Unknown | SD | |
| RP9 | SNV | Missense_Mutation | c.283C>T | p.Pro95Ser | p.P95S | Q8TA86 | protein_coding | deleterious(0.01) | probably_damaging(0.996) | TCGA-A5-A0G2-01 | Endometrium | uterine corpus endometrioid carcinoma | Female | <65 | III/IV | Unknown | Unknown | SD | |
| RP9 | SNV | Missense_Mutation | novel | c.227G>T | p.Gly76Val | p.G76V | Q8TA86 | protein_coding | deleterious(0) | probably_damaging(0.948) | TCGA-A5-A1OF-01 | Endometrium | uterine corpus endometrioid carcinoma | Female | <65 | I/II | Unknown | Unknown | SD |
| RP9 | SNV | Missense_Mutation | rs760221836 | c.328C>T | p.Arg110Cys | p.R110C | Q8TA86 | protein_coding | deleterious(0.05) | benign(0.02) | TCGA-AP-A051-01 | Endometrium | uterine corpus endometrioid carcinoma | Female | >=65 | I/II | Unknown | Unknown | SD |
| Page: 1 2 3 |
Top |
Related drugs of malignant transformation related genes |
| Identification of chemicals and drugs interact with genes involved in malignant transfromation |
| (DGIdb 4.0) |
| Entrez ID | Symbol | Category | Interaction Types | Drug Claim Name | Drug Name | PMIDs |
| Page: 1 |

Copyright 2023-Present -The University of Texas Health Science Center at Houston |