
|
|||||
|
 | |
| |
| |
| |
| |
| |
|
Gene: RORB |
Gene summary for RORB |
| Gene information | Species | Human | Gene symbol | RORB | Gene ID | 6096 |
| Gene name | RAR related orphan receptor B | |
| Gene Alias | EIG15 | |
| Cytomap | 9q21.13 | |
| Gene Type | protein-coding | GO ID | GO:0001503 | UniProtAcc | Q58EY0 |
Top |
Malignant transformation analysis |
| Identification of the aberrant gene expression in precancerous and cancerous lesions by comparing the gene expression of stem-like cells in diseased tissues with normal stem cells |
| Entrez ID | Symbol | Replicates | Species | Organ | Tissue | Adj P-value | Log2FC | Malignancy |
| 6096 | RORB | C38 | Human | Oral cavity | OSCC | 1.22e-07 | 7.74e-01 | 0.172 |
| 6096 | RORB | C43 | Human | Oral cavity | OSCC | 9.72e-14 | 2.49e-01 | 0.1704 |
| 6096 | RORB | C46 | Human | Oral cavity | OSCC | 6.33e-12 | 3.44e-01 | 0.1673 |
| 6096 | RORB | LN46 | Human | Oral cavity | OSCC | 6.84e-20 | 8.42e-01 | 0.1666 |
| Page: 1 |
| Tissue | Expression Dynamics | Abbreviation |
| Oral Cavity | 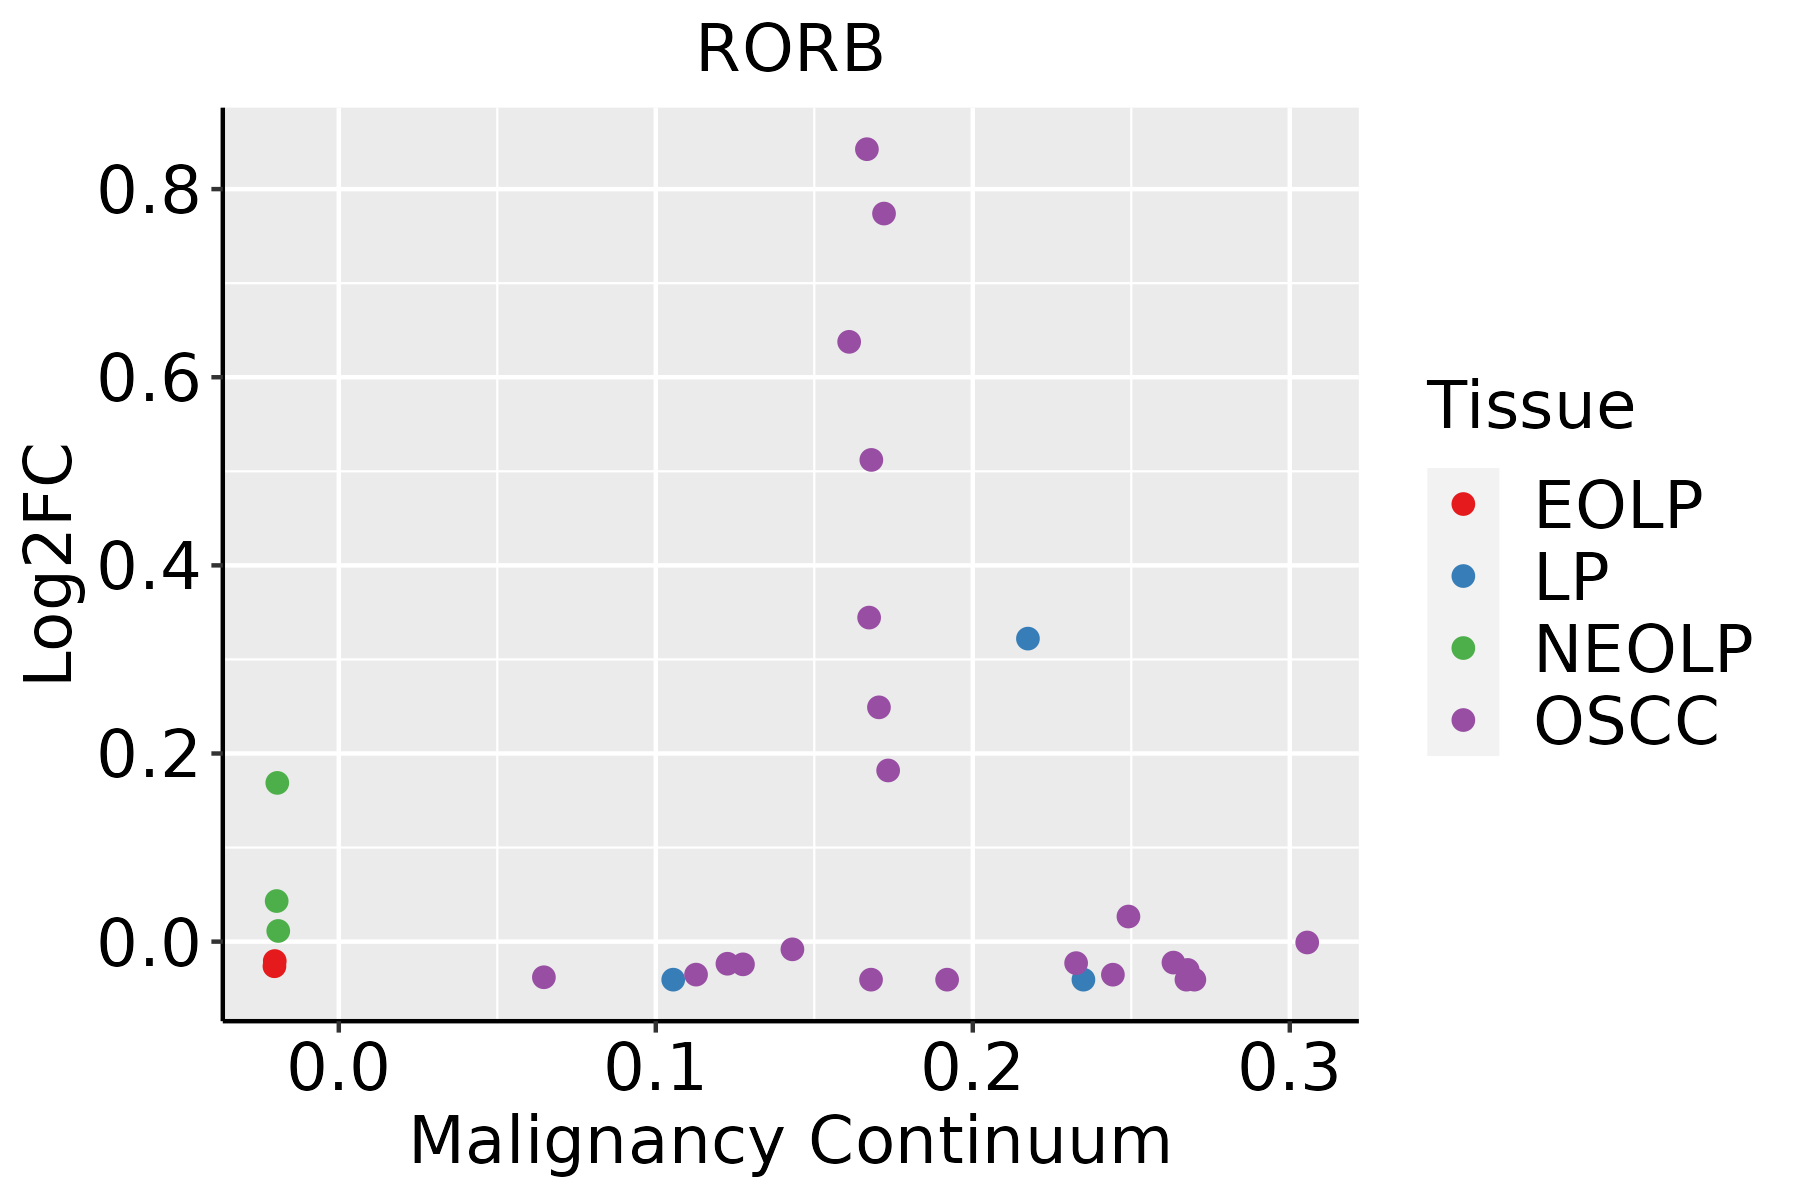 | EOLP: Erosive Oral lichen planus |
| LP: leukoplakia | ||
| NEOLP: Non-erosive oral lichen planus | ||
| OSCC: Oral squamous cell carcinoma |
| ∗log2FC in expression of this searched gene in stem-like cells from each diseased tissue sample relative to stem-like cells in normal samples in each tissue plotted against the malignancy continuum. Samples are colored based on if they are from different disease stage. |
Top |
Malignant transformation related pathway analysis |
| Find out the enriched GO biological processes and KEGG pathways involved in transition from healthy to precancer to cancer |
| Tissue | Disease Stage | Enriched GO biological Processes |
| Colorectum | AD |  |
| Colorectum | SER |  |
| Colorectum | MSS |  |
| Colorectum | MSI-H |  |
| Colorectum | FAP |  |
| ∗Top 15 enriched GO BP terms are showed in the bar plot of each disease state in each tissue. Each row represents a significant GO biological process which is colored according to the -log10(p.adjust). |
| Page: 1 2 3 4 5 6 7 8 9 |
| GO ID | Tissue | Disease Stage | Description | Gene Ratio | Bg Ratio | pvalue | p.adjust | Count |
| GO:003052218 | Oral cavity | OSCC | intracellular receptor signaling pathway | 149/7305 | 265/18723 | 8.69e-09 | 1.81e-07 | 149 |
| GO:004851116 | Oral cavity | OSCC | rhythmic process | 157/7305 | 298/18723 | 1.00e-06 | 1.36e-05 | 157 |
| GO:000150310 | Oral cavity | OSCC | ossification | 203/7305 | 408/18723 | 5.54e-06 | 6.19e-05 | 203 |
| GO:000762316 | Oral cavity | OSCC | circadian rhythm | 110/7305 | 210/18723 | 5.40e-05 | 4.48e-04 | 110 |
| GO:000164910 | Oral cavity | OSCC | osteoblast differentiation | 118/7305 | 229/18723 | 7.51e-05 | 5.85e-04 | 118 |
| GO:0032526 | Oral cavity | OSCC | response to retinoic acid | 54/7305 | 107/18723 | 1.04e-02 | 3.54e-02 | 54 |
| GO:00456674 | Oral cavity | OSCC | regulation of osteoblast differentiation | 65/7305 | 132/18723 | 1.06e-02 | 3.60e-02 | 65 |
| Page: 1 |
| Pathway ID | Tissue | Disease Stage | Description | Gene Ratio | Bg Ratio | pvalue | p.adjust | qvalue | Count |
| Page: 1 |
Top |
Cell-cell communication analysis |
| Identification of potential cell-cell interactions between two cell types and their ligand-receptor pairs for different disease states |
| Ligand | Receptor | LRpair | Pathway | Tissue | Disease Stage |
| Page: 1 |
Top |
Single-cell gene regulatory network inference analysis |
| Find out the significant the regulons (TFs) and the target genes of each regulon across cell types for different disease states |
| TF | Cell Type | Tissue | Disease Stage | Target Gene | RSS | Regulon Activity |
| RORB | QUIE | Esophagus | ESCC | PCOLCE,CXCL12,SELENOM, etc. | 6.91e-02 |  |
| RORB | MDSCs | Esophagus | ADJ | DOPEY2,CMTM8,TDRD7, etc. | 2.76e-02 |  |
| RORB | PERI | Skin | cSCC | BX284613.2,DENND5B,PRSS12, etc. | 3.01e-01 |  |
| ∗The dot plots of a searched regulon are shown for all cell subpopulations in each disease state of each tissue based on the regulon specific score inferred using pySCENIC and by calculating the average expression. |
| Page: 1 |
Top |
Somatic mutation of malignant transformation related genes |
| Annotation of somatic variants for genes involved in malignant transformation |
| Hugo Symbol | Variant Class | Variant Classification | dbSNP RS | HGVSc | HGVSp | HGVSp Short | SWISSPROT | BIOTYPE | SIFT | PolyPhen | Tumor Sample Barcode | Tissue | Histology | Sex | Age | Stage | Therapy Types | Drugs | Outcome |
| RORB | SNV | Missense_Mutation | novel | c.1345N>T | p.Leu449Phe | p.L449F | Q92753 | protein_coding | deleterious(0) | probably_damaging(0.983) | TCGA-A2-A3Y0-01 | Breast | breast invasive carcinoma | Female | <65 | I/II | Chemotherapy | adriamycin | CR |
| RORB | SNV | Missense_Mutation | c.651N>C | p.Gln217His | p.Q217H | Q92753 | protein_coding | deleterious(0) | possibly_damaging(0.863) | TCGA-A8-A08L-01 | Breast | breast invasive carcinoma | Female | >=65 | III/IV | Unknown | Unknown | SD | |
| RORB | SNV | Missense_Mutation | c.868N>T | p.Asp290Tyr | p.D290Y | Q92753 | protein_coding | deleterious(0) | probably_damaging(1) | TCGA-AN-A046-01 | Breast | breast invasive carcinoma | Female | >=65 | I/II | Unknown | Unknown | SD | |
| RORB | SNV | Missense_Mutation | novel | c.925C>T | p.Arg309Cys | p.R309C | Q92753 | protein_coding | deleterious(0) | probably_damaging(1) | TCGA-MA-AA3Z-01 | Cervix | cervical & endocervical cancer | Female | <65 | I/II | Unknown | Unknown | SD |
| RORB | SNV | Missense_Mutation | c.436G>A | p.Val146Ile | p.V146I | Q92753 | protein_coding | tolerated(0.43) | benign(0.001) | TCGA-5M-AATE-01 | Colorectum | colon adenocarcinoma | Male | >=65 | I/II | Unknown | Unknown | PD | |
| RORB | SNV | Missense_Mutation | novel | c.71N>C | p.Val24Ala | p.V24A | Q92753 | protein_coding | deleterious(0) | probably_damaging(0.977) | TCGA-AA-3715-01 | Colorectum | colon adenocarcinoma | Male | >=65 | I/II | Unknown | Unknown | PD |
| RORB | SNV | Missense_Mutation | c.138C>G | p.Cys46Trp | p.C46W | Q92753 | protein_coding | deleterious(0) | probably_damaging(1) | TCGA-AA-A00N-01 | Colorectum | colon adenocarcinoma | Male | >=65 | I/II | Unknown | Unknown | PD | |
| RORB | SNV | Missense_Mutation | c.923G>C | p.Cys308Ser | p.C308S | Q92753 | protein_coding | tolerated(0.36) | benign(0.073) | TCGA-AA-A010-01 | Colorectum | colon adenocarcinoma | Female | <65 | I/II | Chemotherapy | folinic | CR | |
| RORB | SNV | Missense_Mutation | c.1171G>T | p.Ala391Ser | p.A391S | Q92753 | protein_coding | deleterious(0.05) | possibly_damaging(0.473) | TCGA-AA-A022-01 | Colorectum | colon adenocarcinoma | Female | >=65 | I/II | Unknown | Unknown | SD | |
| RORB | SNV | Missense_Mutation | rs770337953 | c.836G>A | p.Arg279Gln | p.R279Q | Q92753 | protein_coding | deleterious(0.04) | possibly_damaging(0.511) | TCGA-AA-A02O-01 | Colorectum | colon adenocarcinoma | Male | >=65 | I/II | Unknown | Unknown | SD |
| Page: 1 2 3 4 5 6 7 |
Top |
Related drugs of malignant transformation related genes |
| Identification of chemicals and drugs interact with genes involved in malignant transfromation |
| (DGIdb 4.0) |
| Entrez ID | Symbol | Category | Interaction Types | Drug Claim Name | Drug Name | PMIDs |
| 6096 | RORB | DRUGGABLE GENOME, NUCLEAR HORMONE RECEPTOR, TRANSCRIPTION FACTOR, KINASE | US9598431, 5 | |||
| 6096 | RORB | DRUGGABLE GENOME, NUCLEAR HORMONE RECEPTOR, TRANSCRIPTION FACTOR, KINASE | US9598431, 2 | |||
| 6096 | RORB | DRUGGABLE GENOME, NUCLEAR HORMONE RECEPTOR, TRANSCRIPTION FACTOR, KINASE | US9598431, 1 | |||
| 6096 | RORB | DRUGGABLE GENOME, NUCLEAR HORMONE RECEPTOR, TRANSCRIPTION FACTOR, KINASE | antagonist | 135649927 | ||
| 6096 | RORB | DRUGGABLE GENOME, NUCLEAR HORMONE RECEPTOR, TRANSCRIPTION FACTOR, KINASE | agonist | 310264687 | ||
| 6096 | RORB | DRUGGABLE GENOME, NUCLEAR HORMONE RECEPTOR, TRANSCRIPTION FACTOR, KINASE | antagonist | 135649918 | ||
| 6096 | RORB | DRUGGABLE GENOME, NUCLEAR HORMONE RECEPTOR, TRANSCRIPTION FACTOR, KINASE | agonist,antagonist | 135651435 | TRETINOIN |
| Page: 1 |

Copyright 2023-Present -The University of Texas Health Science Center at Houston |