
|
|||||
|
 | |
| |
| |
| |
| |
| |
|
Gene: ROR2 |
Gene summary for ROR2 |
| Gene information | Species | Human | Gene symbol | ROR2 | Gene ID | 4920 |
| Gene name | receptor tyrosine kinase like orphan receptor 2 | |
| Gene Alias | BDB | |
| Cytomap | 9q22.31 | |
| Gene Type | protein-coding | GO ID | GO:0000003 | UniProtAcc | Q01974 |
Top |
Malignant transformation analysis |
| Identification of the aberrant gene expression in precancerous and cancerous lesions by comparing the gene expression of stem-like cells in diseased tissues with normal stem cells |
| Entrez ID | Symbol | Replicates | Species | Organ | Tissue | Adj P-value | Log2FC | Malignancy |
| 4920 | ROR2 | AEH-subject1 | Human | Endometrium | AEH | 3.80e-11 | 4.01e-01 | -0.3059 |
| 4920 | ROR2 | AEH-subject2 | Human | Endometrium | AEH | 4.70e-04 | 2.31e-01 | -0.2525 |
| 4920 | ROR2 | AEH-subject3 | Human | Endometrium | AEH | 7.15e-07 | 2.75e-01 | -0.2576 |
| 4920 | ROR2 | AEH-subject4 | Human | Endometrium | AEH | 1.30e-05 | 3.23e-01 | -0.2657 |
| 4920 | ROR2 | AEH-subject5 | Human | Endometrium | AEH | 7.97e-05 | 3.26e-01 | -0.2953 |
| 4920 | ROR2 | EEC-subject1 | Human | Endometrium | EEC | 1.18e-07 | 3.47e-01 | -0.2682 |
| 4920 | ROR2 | EEC-subject2 | Human | Endometrium | EEC | 1.65e-06 | 3.48e-01 | -0.2607 |
| 4920 | ROR2 | EEC-subject3 | Human | Endometrium | EEC | 4.77e-05 | -3.31e-02 | -0.2525 |
| 4920 | ROR2 | GSM5276934 | Human | Endometrium | EEC | 7.71e-03 | -8.13e-02 | -0.0913 |
| 4920 | ROR2 | GSM6177620_NYU_UCEC1_lib1_lib1 | Human | Endometrium | EEC | 1.21e-09 | -2.76e-03 | -0.1869 |
| 4920 | ROR2 | GSM6177620_NYU_UCEC1_lib2_lib2 | Human | Endometrium | EEC | 5.80e-10 | -4.72e-02 | -0.1875 |
| 4920 | ROR2 | GSM6177620_NYU_UCEC1_lib3_lib3 | Human | Endometrium | EEC | 2.90e-09 | 4.04e-02 | -0.1883 |
| 4920 | ROR2 | GSM6177621_NYU_UCEC2_lib1_lib1 | Human | Endometrium | EEC | 3.08e-06 | -4.28e-02 | -0.1934 |
| 4920 | ROR2 | GSM6177622_NYU_UCEC3_lib1_lib1 | Human | Endometrium | EEC | 1.35e-09 | -1.40e-01 | -0.1917 |
| 4920 | ROR2 | GSM6177622_NYU_UCEC3_lib2_lib2 | Human | Endometrium | EEC | 1.18e-09 | -8.35e-02 | -0.1916 |
| 4920 | ROR2 | P2T-E | Human | Esophagus | ESCC | 1.27e-21 | 4.15e-01 | 0.1177 |
| 4920 | ROR2 | P9T-E | Human | Esophagus | ESCC | 2.04e-08 | 2.09e-01 | 0.1131 |
| 4920 | ROR2 | P10T-E | Human | Esophagus | ESCC | 1.37e-05 | 6.93e-02 | 0.116 |
| 4920 | ROR2 | P12T-E | Human | Esophagus | ESCC | 1.17e-06 | 1.20e-01 | 0.1122 |
| 4920 | ROR2 | P16T-E | Human | Esophagus | ESCC | 2.84e-12 | 2.89e-01 | 0.1153 |
| Page: 1 2 |
| Tissue | Expression Dynamics | Abbreviation |
| Endometrium | 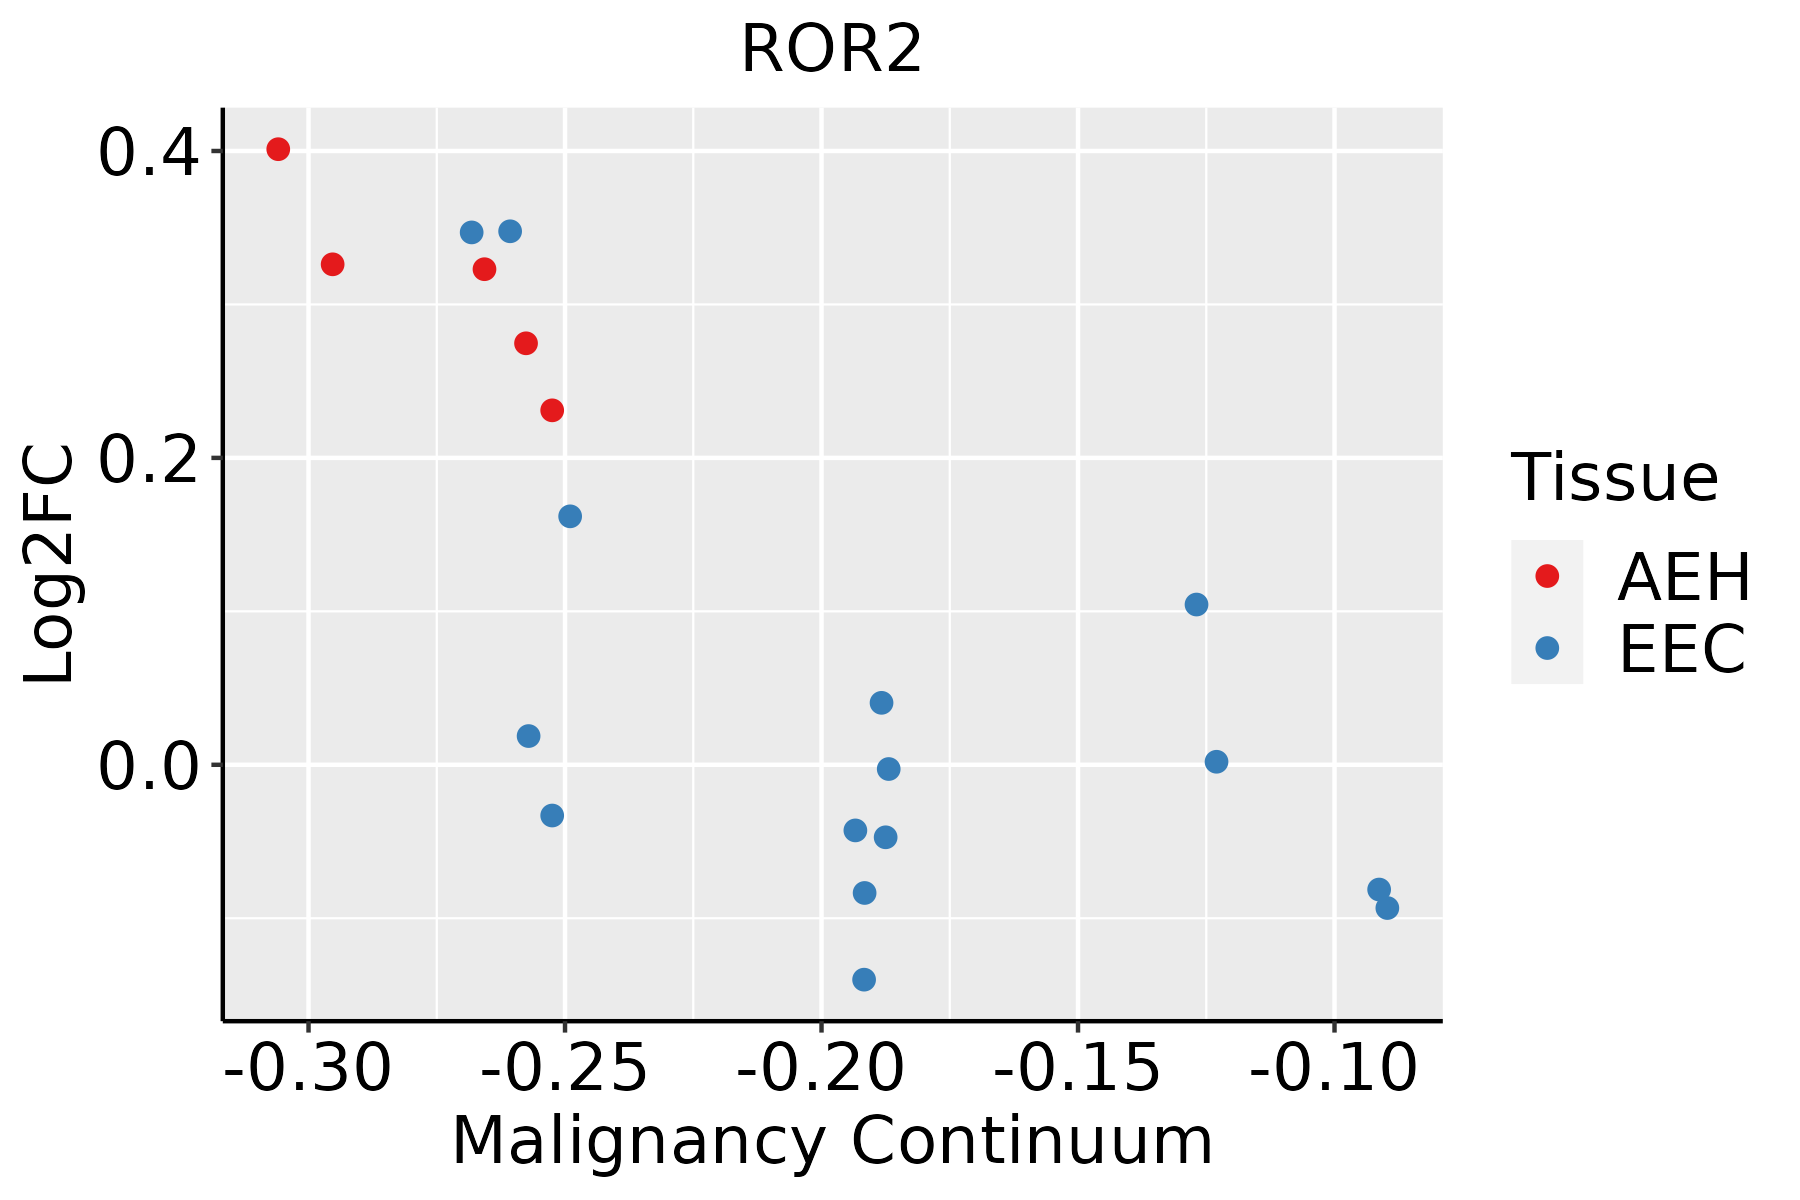 | AEH: Atypical endometrial hyperplasia |
| EEC: Endometrioid Cancer | ||
| Esophagus |  | ESCC: Esophageal squamous cell carcinoma |
| HGIN: High-grade intraepithelial neoplasias | ||
| LGIN: Low-grade intraepithelial neoplasias |
| ∗log2FC in expression of this searched gene in stem-like cells from each diseased tissue sample relative to stem-like cells in normal samples in each tissue plotted against the malignancy continuum. Samples are colored based on if they are from different disease stage. |
Top |
Malignant transformation related pathway analysis |
| Find out the enriched GO biological processes and KEGG pathways involved in transition from healthy to precancer to cancer |
| Tissue | Disease Stage | Enriched GO biological Processes |
| Colorectum | AD |  |
| Colorectum | SER |  |
| Colorectum | MSS |  |
| Colorectum | MSI-H |  |
| Colorectum | FAP |  |
| ∗Top 15 enriched GO BP terms are showed in the bar plot of each disease state in each tissue. Each row represents a significant GO biological process which is colored according to the -log10(p.adjust). |
| Page: 1 2 3 4 5 6 7 8 9 |
| GO ID | Tissue | Disease Stage | Description | Gene Ratio | Bg Ratio | pvalue | p.adjust | Count |
| GO:00614589 | Endometrium | AEH | reproductive system development | 88/2100 | 427/18723 | 9.50e-09 | 6.41e-07 | 88 |
| GO:00486089 | Endometrium | AEH | reproductive structure development | 87/2100 | 424/18723 | 1.43e-08 | 9.12e-07 | 87 |
| GO:00301118 | Endometrium | AEH | regulation of Wnt signaling pathway | 71/2100 | 328/18723 | 3.31e-08 | 1.87e-06 | 71 |
| GO:00160558 | Endometrium | AEH | Wnt signaling pathway | 85/2100 | 444/18723 | 4.99e-07 | 1.97e-05 | 85 |
| GO:01987388 | Endometrium | AEH | cell-cell signaling by wnt | 85/2100 | 446/18723 | 6.07e-07 | 2.29e-05 | 85 |
| GO:00015038 | Endometrium | AEH | ossification | 78/2100 | 408/18723 | 1.54e-06 | 4.85e-05 | 78 |
| GO:00608288 | Endometrium | AEH | regulation of canonical Wnt signaling pathway | 54/2100 | 253/18723 | 2.22e-06 | 6.56e-05 | 54 |
| GO:00514039 | Endometrium | AEH | stress-activated MAPK cascade | 50/2100 | 239/18723 | 9.33e-06 | 2.18e-04 | 50 |
| GO:00301777 | Endometrium | AEH | positive regulation of Wnt signaling pathway | 34/2100 | 140/18723 | 9.62e-06 | 2.23e-04 | 34 |
| GO:00310989 | Endometrium | AEH | stress-activated protein kinase signaling cascade | 51/2100 | 247/18723 | 1.12e-05 | 2.52e-04 | 51 |
| GO:00071787 | Endometrium | AEH | transmembrane receptor protein serine/threonine kinase signaling pathway | 67/2100 | 355/18723 | 1.28e-05 | 2.80e-04 | 67 |
| GO:00434105 | Endometrium | AEH | positive regulation of MAPK cascade | 84/2100 | 480/18723 | 2.19e-05 | 4.25e-04 | 84 |
| GO:00600708 | Endometrium | AEH | canonical Wnt signaling pathway | 58/2100 | 303/18723 | 3.12e-05 | 5.66e-04 | 58 |
| GO:00902637 | Endometrium | AEH | positive regulation of canonical Wnt signaling pathway | 26/2100 | 106/18723 | 8.63e-05 | 1.27e-03 | 26 |
| GO:00109758 | Endometrium | AEH | regulation of neuron projection development | 75/2100 | 445/18723 | 2.01e-04 | 2.54e-03 | 75 |
| GO:003367414 | Endometrium | AEH | positive regulation of kinase activity | 78/2100 | 467/18723 | 2.03e-04 | 2.54e-03 | 78 |
| GO:00509008 | Endometrium | AEH | leukocyte migration | 64/2100 | 369/18723 | 2.57e-04 | 3.04e-03 | 64 |
| GO:00458609 | Endometrium | AEH | positive regulation of protein kinase activity | 66/2100 | 386/18723 | 3.14e-04 | 3.53e-03 | 66 |
| GO:00305092 | Endometrium | AEH | BMP signaling pathway | 32/2100 | 152/18723 | 3.15e-04 | 3.54e-03 | 32 |
| GO:190370614 | Endometrium | AEH | regulation of hemopoiesis | 63/2100 | 367/18723 | 3.81e-04 | 4.10e-03 | 63 |
| Page: 1 2 3 4 5 6 7 |
| Pathway ID | Tissue | Disease Stage | Description | Gene Ratio | Bg Ratio | pvalue | p.adjust | qvalue | Count |
| hsa0431010 | Endometrium | AEH | Wnt signaling pathway | 37/1197 | 171/8465 | 4.68e-03 | 2.53e-02 | 1.86e-02 | 37 |
| hsa0431013 | Endometrium | AEH | Wnt signaling pathway | 37/1197 | 171/8465 | 4.68e-03 | 2.53e-02 | 1.86e-02 | 37 |
| hsa0431022 | Endometrium | EEC | Wnt signaling pathway | 40/1237 | 171/8465 | 1.37e-03 | 8.99e-03 | 6.70e-03 | 40 |
| hsa0431032 | Endometrium | EEC | Wnt signaling pathway | 40/1237 | 171/8465 | 1.37e-03 | 8.99e-03 | 6.70e-03 | 40 |
| Page: 1 |
Top |
Cell-cell communication analysis |
| Identification of potential cell-cell interactions between two cell types and their ligand-receptor pairs for different disease states |
| Ligand | Receptor | LRpair | Pathway | Tissue | Disease Stage |
| Page: 1 |
Top |
Single-cell gene regulatory network inference analysis |
| Find out the significant the regulons (TFs) and the target genes of each regulon across cell types for different disease states |
| TF | Cell Type | Tissue | Disease Stage | Target Gene | RSS | Regulon Activity |
| ∗The dot plots of a searched regulon are shown for all cell subpopulations in each disease state of each tissue based on the regulon specific score inferred using pySCENIC and by calculating the average expression. |
| Page: 1 |
Top |
Somatic mutation of malignant transformation related genes |
| Annotation of somatic variants for genes involved in malignant transformation |
| Hugo Symbol | Variant Class | Variant Classification | dbSNP RS | HGVSc | HGVSp | HGVSp Short | SWISSPROT | BIOTYPE | SIFT | PolyPhen | Tumor Sample Barcode | Tissue | Histology | Sex | Age | Stage | Therapy Types | Drugs | Outcome |
| ROR2 | SNV | Missense_Mutation | rs746196217 | c.356N>A | p.Arg119Gln | p.R119Q | Q01974 | protein_coding | deleterious(0) | benign(0.028) | TCGA-5L-AAT1-01 | Breast | breast invasive carcinoma | Female | <65 | III/IV | Hormone Therapy | letrozol | SD |
| ROR2 | SNV | Missense_Mutation | novel | c.2185T>C | p.Trp729Arg | p.W729R | Q01974 | protein_coding | deleterious(0.02) | benign(0.132) | TCGA-A7-A0CG-01 | Breast | breast invasive carcinoma | Female | >=65 | I/II | Unknown | Unknown | SD |
| ROR2 | SNV | Missense_Mutation | novel | c.1333N>G | p.Met445Val | p.M445V | Q01974 | protein_coding | tolerated(0.3) | benign(0.003) | TCGA-B6-A0IK-01 | Breast | breast invasive carcinoma | Female | <65 | III/IV | Unknown | Unknown | PD |
| ROR2 | SNV | Missense_Mutation | c.671N>T | p.Ser224Leu | p.S224L | Q01974 | protein_coding | tolerated(0.05) | probably_damaging(0.994) | TCGA-BH-A0B6-01 | Breast | breast invasive carcinoma | Female | <65 | I/II | Unknown | Unknown | SD | |
| ROR2 | SNV | Missense_Mutation | rs767474960 | c.1448N>A | p.Arg483Gln | p.R483Q | Q01974 | protein_coding | tolerated(0.43) | benign(0.248) | TCGA-BH-A18L-01 | Breast | breast invasive carcinoma | Female | <65 | III/IV | Unknown | Unknown | SD |
| ROR2 | SNV | Missense_Mutation | rs373544528 | c.1553G>A | p.Arg518Gln | p.R518Q | Q01974 | protein_coding | tolerated(0.58) | possibly_damaging(0.697) | TCGA-C8-A274-01 | Breast | breast invasive carcinoma | Female | <65 | I/II | Hormone Therapy | tamoxiphen | SD |
| ROR2 | SNV | Missense_Mutation | novel | c.2468N>C | p.Gly823Ala | p.G823A | Q01974 | protein_coding | deleterious_low_confidence(0.01) | probably_damaging(0.996) | TCGA-D8-A1X5-01 | Breast | breast invasive carcinoma | Female | >=65 | III/IV | Hormone Therapy | tamoxiphen | SD |
| ROR2 | SNV | Missense_Mutation | c.1518C>G | p.Ile506Met | p.I506M | Q01974 | protein_coding | deleterious(0) | probably_damaging(0.997) | TCGA-E2-A1LH-01 | Breast | breast invasive carcinoma | Female | <65 | I/II | Chemotherapy | adriamycin | SD | |
| ROR2 | SNV | Missense_Mutation | novel | c.1479C>A | p.Phe493Leu | p.F493L | Q01974 | protein_coding | tolerated(0.5) | benign(0.003) | TCGA-OL-A5RU-01 | Breast | breast invasive carcinoma | Female | <65 | I/II | Chemotherapy | cyclophosphamide | CR |
| ROR2 | insertion | Nonsense_Mutation | novel | c.1139_1140insACATGGTGAAACCCCATAAAAATACAAAAATTAGCCAGGTGCGGT | p.Gln380_Asn381insHisGlyGluThrProTerLysTyrLysAsnTerProGlyAlaVal | p.Q380_N381insHGETP*KYKN*PGAV | Q01974 | protein_coding | TCGA-A8-A082-01 | Breast | breast invasive carcinoma | Female | <65 | I/II | Chemotherapy | 5-fluorouracil | CR |
| Page: 1 2 3 4 5 6 7 8 9 10 11 12 13 14 15 16 17 |
Top |
Related drugs of malignant transformation related genes |
| Identification of chemicals and drugs interact with genes involved in malignant transfromation |
| (DGIdb 4.0) |
| Entrez ID | Symbol | Category | Interaction Types | Drug Claim Name | Drug Name | PMIDs |
| 4920 | ROR2 | KINASE, TYROSINE KINASE, DRUGGABLE GENOME, CELL SURFACE, ENZYME | CCT301-59 (targeting ROR2) | |||
| 4920 | ROR2 | KINASE, TYROSINE KINASE, DRUGGABLE GENOME, CELL SURFACE, ENZYME | CCT301-38 (targeting ROR2) |
| Page: 1 |

Copyright 2023-Present -The University of Texas Health Science Center at Houston |