
|
|||||
|
 | |
| |
| |
| |
| |
| |
|
Gene: ROR1 |
Gene summary for ROR1 |
| Gene information | Species | Human | Gene symbol | ROR1 | Gene ID | 4919 |
| Gene name | receptor tyrosine kinase like orphan receptor 1 | |
| Gene Alias | NTRKR1 | |
| Cytomap | 1p31.3 | |
| Gene Type | protein-coding | GO ID | GO:0000165 | UniProtAcc | Q01973 |
Top |
Malignant transformation analysis |
| Identification of the aberrant gene expression in precancerous and cancerous lesions by comparing the gene expression of stem-like cells in diseased tissues with normal stem cells |
| Entrez ID | Symbol | Replicates | Species | Organ | Tissue | Adj P-value | Log2FC | Malignancy |
| 4919 | ROR1 | EEC-subject1 | Human | Endometrium | EEC | 1.02e-15 | 5.56e-01 | -0.2682 |
| 4919 | ROR1 | EEC-subject5 | Human | Endometrium | EEC | 2.41e-02 | 2.24e-01 | -0.249 |
| 4919 | ROR1 | GSM6177620_NYU_UCEC1_lib3_lib3 | Human | Endometrium | EEC | 2.62e-02 | 2.81e-02 | -0.1883 |
| 4919 | ROR1 | GSM6177621_NYU_UCEC2_lib1_lib1 | Human | Endometrium | EEC | 3.09e-02 | 1.48e-01 | -0.1934 |
| 4919 | ROR1 | GSM6177622_NYU_UCEC3_lib2_lib2 | Human | Endometrium | EEC | 1.73e-02 | -3.57e-02 | -0.1916 |
| 4919 | ROR1 | RNA-P25T1-P25T1-1 | Human | Lung | AIS | 8.22e-13 | 7.87e-01 | -0.2116 |
| 4919 | ROR1 | RNA-P25T1-P25T1-2 | Human | Lung | AIS | 3.57e-02 | 5.86e-01 | -0.1941 |
| 4919 | ROR1 | RNA-P25T1-P25T1-4 | Human | Lung | AIS | 6.75e-10 | 6.70e-01 | -0.2119 |
| 4919 | ROR1 | RNA-P6T2-P6T2-1 | Human | Lung | IAC | 5.97e-05 | 3.18e-01 | -0.0166 |
| 4919 | ROR1 | RNA-P6T2-P6T2-2 | Human | Lung | IAC | 4.10e-11 | 4.62e-01 | -0.0132 |
| 4919 | ROR1 | RNA-P6T2-P6T2-3 | Human | Lung | IAC | 1.58e-11 | 3.86e-01 | -0.013 |
| 4919 | ROR1 | RNA-P6T2-P6T2-4 | Human | Lung | IAC | 1.66e-07 | 4.57e-01 | -0.0121 |
| 4919 | ROR1 | RNA-P7T1-P7T1-1 | Human | Lung | AIS | 1.65e-02 | 5.31e-01 | -0.0961 |
| 4919 | ROR1 | RNA-P7T1-P7T1-2 | Human | Lung | AIS | 1.91e-02 | 5.35e-01 | -0.0876 |
| 4919 | ROR1 | RNA-P7T1-P7T1-3 | Human | Lung | AIS | 8.79e-03 | 4.77e-01 | -0.0822 |
| 4919 | ROR1 | RNA-P7T1-P7T1-4 | Human | Lung | AIS | 3.91e-04 | 5.95e-01 | -0.0809 |
| 4919 | ROR1 | HTA12-23-1 | Human | Pancreas | PDAC | 4.22e-05 | 7.91e-01 | 0.3405 |
| 4919 | ROR1 | HTA12-25-1 | Human | Pancreas | PDAC | 2.61e-04 | 4.90e-01 | 0.313 |
| 4919 | ROR1 | HTA12-26-1 | Human | Pancreas | PDAC | 2.99e-17 | 8.83e-01 | 0.3728 |
| 4919 | ROR1 | HTA12-29-1 | Human | Pancreas | PDAC | 2.72e-44 | 9.86e-01 | 0.3722 |
| Page: 1 2 |
| Tissue | Expression Dynamics | Abbreviation |
| Endometrium | 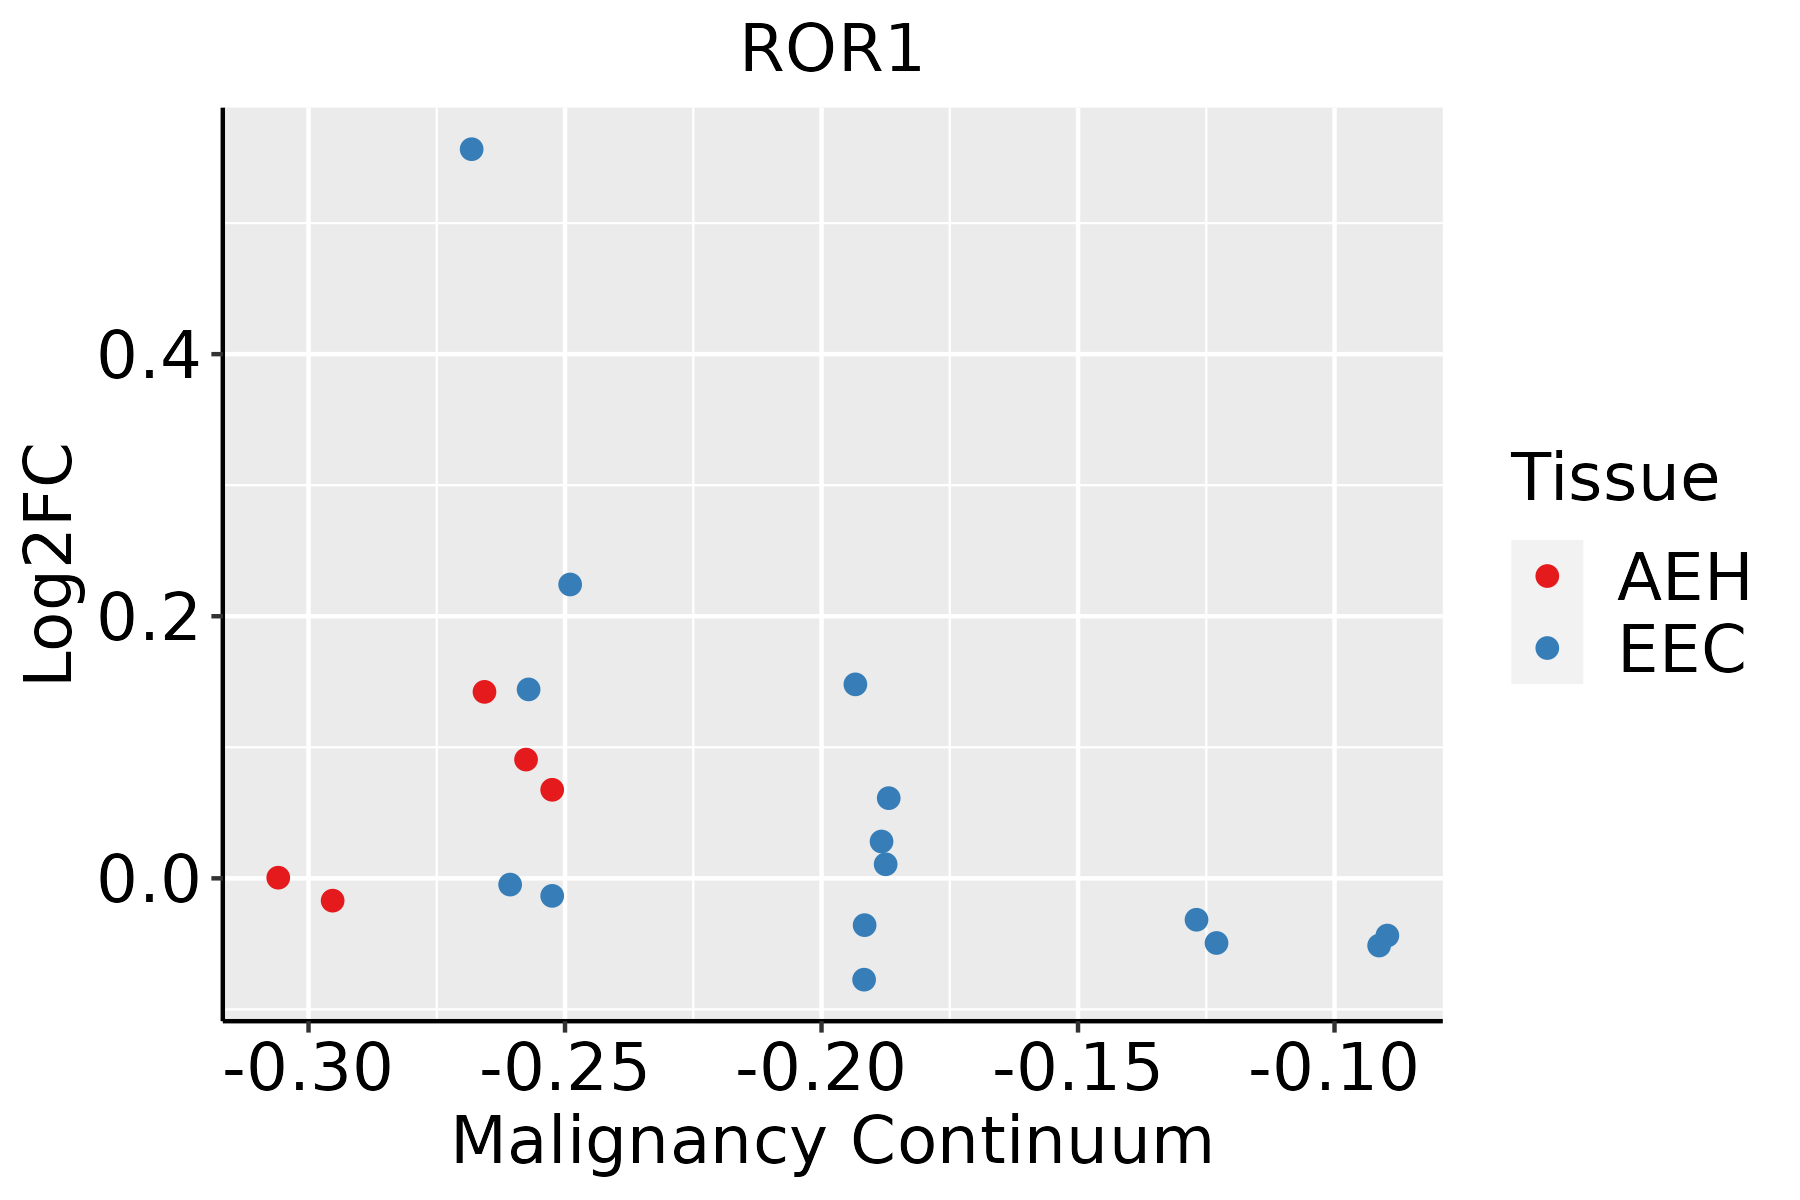 | AEH: Atypical endometrial hyperplasia |
| EEC: Endometrioid Cancer | ||
| Lung |  | AAH: Atypical adenomatous hyperplasia |
| AIS: Adenocarcinoma in situ | ||
| IAC: Invasive lung adenocarcinoma | ||
| MIA: Minimally invasive adenocarcinoma | ||
| Thyroid |  | ATC: Anaplastic thyroid cancer |
| HT: Hashimoto's thyroiditis | ||
| PTC: Papillary thyroid cancer |
| ∗log2FC in expression of this searched gene in stem-like cells from each diseased tissue sample relative to stem-like cells in normal samples in each tissue plotted against the malignancy continuum. Samples are colored based on if they are from different disease stage. |
Top |
Malignant transformation related pathway analysis |
| Find out the enriched GO biological processes and KEGG pathways involved in transition from healthy to precancer to cancer |
| Tissue | Disease Stage | Enriched GO biological Processes |
| Colorectum | AD |  |
| Colorectum | SER |  |
| Colorectum | MSS |  |
| Colorectum | MSI-H |  |
| Colorectum | FAP |  |
| ∗Top 15 enriched GO BP terms are showed in the bar plot of each disease state in each tissue. Each row represents a significant GO biological process which is colored according to the -log10(p.adjust). |
| Page: 1 2 3 4 5 6 7 8 9 |
| GO ID | Tissue | Disease Stage | Description | Gene Ratio | Bg Ratio | pvalue | p.adjust | Count |
| GO:001605513 | Endometrium | EEC | Wnt signaling pathway | 90/2168 | 444/18723 | 6.65e-08 | 3.50e-06 | 90 |
| GO:019873813 | Endometrium | EEC | cell-cell signaling by wnt | 90/2168 | 446/18723 | 8.25e-08 | 4.23e-06 | 90 |
| GO:004341011 | Endometrium | EEC | positive regulation of MAPK cascade | 89/2168 | 480/18723 | 4.21e-06 | 1.08e-04 | 89 |
| GO:004312216 | Endometrium | EEC | regulation of I-kappaB kinase/NF-kappaB signaling | 53/2168 | 249/18723 | 7.59e-06 | 1.73e-04 | 53 |
| GO:004312314 | Endometrium | EEC | positive regulation of I-kappaB kinase/NF-kappaB signaling | 42/2168 | 186/18723 | 1.47e-05 | 2.87e-04 | 42 |
| GO:000724915 | Endometrium | EEC | I-kappaB kinase/NF-kappaB signaling | 57/2168 | 281/18723 | 1.60e-05 | 3.12e-04 | 57 |
| GO:003367415 | Endometrium | EEC | positive regulation of kinase activity | 83/2168 | 467/18723 | 4.32e-05 | 7.10e-04 | 83 |
| GO:001097513 | Endometrium | EEC | regulation of neuron projection development | 79/2168 | 445/18723 | 6.80e-05 | 1.01e-03 | 79 |
| GO:005109013 | Endometrium | EEC | regulation of DNA-binding transcription factor activity | 75/2168 | 440/18723 | 3.71e-04 | 3.97e-03 | 75 |
| GO:003134613 | Endometrium | EEC | positive regulation of cell projection organization | 61/2168 | 353/18723 | 8.82e-04 | 8.03e-03 | 61 |
| GO:000173812 | Endometrium | EEC | morphogenesis of a polarized epithelium | 21/2168 | 94/18723 | 2.18e-03 | 1.63e-02 | 21 |
| GO:00600713 | Endometrium | EEC | Wnt signaling pathway, planar cell polarity pathway | 13/2168 | 52/18723 | 5.34e-03 | 3.31e-02 | 13 |
| GO:20000273 | Endometrium | EEC | regulation of animal organ morphogenesis | 24/2168 | 125/18723 | 8.60e-03 | 4.70e-02 | 24 |
| GO:00160556 | Lung | IAC | Wnt signaling pathway | 95/2061 | 444/18723 | 1.13e-10 | 2.80e-08 | 95 |
| GO:01987386 | Lung | IAC | cell-cell signaling by wnt | 95/2061 | 446/18723 | 1.46e-10 | 3.48e-08 | 95 |
| GO:00109756 | Lung | IAC | regulation of neuron projection development | 82/2061 | 445/18723 | 1.82e-06 | 8.78e-05 | 82 |
| GO:00336748 | Lung | IAC | positive regulation of kinase activity | 83/2061 | 467/18723 | 6.76e-06 | 2.45e-04 | 83 |
| GO:00072495 | Lung | IAC | I-kappaB kinase/NF-kappaB signaling | 56/2061 | 281/18723 | 7.39e-06 | 2.62e-04 | 56 |
| GO:00431226 | Lung | IAC | regulation of I-kappaB kinase/NF-kappaB signaling | 51/2061 | 249/18723 | 8.41e-06 | 2.87e-04 | 51 |
| GO:00510903 | Lung | IAC | regulation of DNA-binding transcription factor activity | 76/2061 | 440/18723 | 4.44e-05 | 1.05e-03 | 76 |
| Page: 1 2 3 4 |
| Pathway ID | Tissue | Disease Stage | Description | Gene Ratio | Bg Ratio | pvalue | p.adjust | qvalue | Count |
| hsa0431022 | Endometrium | EEC | Wnt signaling pathway | 40/1237 | 171/8465 | 1.37e-03 | 8.99e-03 | 6.70e-03 | 40 |
| hsa0431032 | Endometrium | EEC | Wnt signaling pathway | 40/1237 | 171/8465 | 1.37e-03 | 8.99e-03 | 6.70e-03 | 40 |
| hsa043108 | Lung | IAC | Wnt signaling pathway | 40/1053 | 171/8465 | 4.56e-05 | 7.06e-04 | 4.69e-04 | 40 |
| hsa0431011 | Lung | IAC | Wnt signaling pathway | 40/1053 | 171/8465 | 4.56e-05 | 7.06e-04 | 4.69e-04 | 40 |
| hsa0431021 | Lung | AIS | Wnt signaling pathway | 39/961 | 171/8465 | 1.29e-05 | 3.32e-04 | 2.12e-04 | 39 |
| hsa0431031 | Lung | AIS | Wnt signaling pathway | 39/961 | 171/8465 | 1.29e-05 | 3.32e-04 | 2.12e-04 | 39 |
| Page: 1 |
Top |
Cell-cell communication analysis |
| Identification of potential cell-cell interactions between two cell types and their ligand-receptor pairs for different disease states |
| Ligand | Receptor | LRpair | Pathway | Tissue | Disease Stage |
| Page: 1 |
Top |
Single-cell gene regulatory network inference analysis |
| Find out the significant the regulons (TFs) and the target genes of each regulon across cell types for different disease states |
| TF | Cell Type | Tissue | Disease Stage | Target Gene | RSS | Regulon Activity |
| ∗The dot plots of a searched regulon are shown for all cell subpopulations in each disease state of each tissue based on the regulon specific score inferred using pySCENIC and by calculating the average expression. |
| Page: 1 |
Top |
Somatic mutation of malignant transformation related genes |
| Annotation of somatic variants for genes involved in malignant transformation |
| Hugo Symbol | Variant Class | Variant Classification | dbSNP RS | HGVSc | HGVSp | HGVSp Short | SWISSPROT | BIOTYPE | SIFT | PolyPhen | Tumor Sample Barcode | Tissue | Histology | Sex | Age | Stage | Therapy Types | Drugs | Outcome |
| ROR1 | SNV | Missense_Mutation | rs201702143 | c.103N>G | p.Ser35Ala | p.S35A | Q01973 | protein_coding | tolerated_low_confidence(0.82) | benign(0.034) | TCGA-A2-A0CQ-01 | Breast | breast invasive carcinoma | Female | <65 | I/II | Chemotherapy | adriamycin | SD |
| ROR1 | SNV | Missense_Mutation | novel | c.1924N>C | p.Ser642Pro | p.S642P | Q01973 | protein_coding | deleterious(0) | probably_damaging(0.997) | TCGA-A2-A0D1-01 | Breast | breast invasive carcinoma | Female | >=65 | I/II | Chemotherapy | taxotere | SD |
| ROR1 | SNV | Missense_Mutation | rs201702143 | c.103N>G | p.Ser35Ala | p.S35A | Q01973 | protein_coding | tolerated_low_confidence(0.82) | benign(0.034) | TCGA-A2-A0T4-01 | Breast | breast invasive carcinoma | Female | <65 | I/II | Hormone Therapy | femara | SD |
| ROR1 | SNV | Missense_Mutation | rs201702143 | c.103T>G | p.Ser35Ala | p.S35A | Q01973 | protein_coding | tolerated_low_confidence(0.82) | benign(0.034) | TCGA-A8-A097-01 | Breast | breast invasive carcinoma | Female | >=65 | I/II | Hormone Therapy | tamoxiphen | SD |
| ROR1 | SNV | Missense_Mutation | rs866734548 | c.1969N>T | p.Arg657Cys | p.R657C | Q01973 | protein_coding | deleterious(0) | probably_damaging(1) | TCGA-AN-A0AK-01 | Breast | breast invasive carcinoma | Female | >=65 | I/II | Unknown | Unknown | SD |
| ROR1 | SNV | Missense_Mutation | c.175N>T | p.Thr59Ser | p.T59S | Q01973 | protein_coding | tolerated(0.65) | benign(0.08) | TCGA-AN-A0FJ-01 | Breast | breast invasive carcinoma | Female | <65 | III/IV | Unknown | Unknown | SD | |
| ROR1 | SNV | Missense_Mutation | c.1579N>C | p.Met527Leu | p.M527L | Q01973 | protein_coding | tolerated(1) | benign(0.003) | TCGA-AN-A0XS-01 | Breast | breast invasive carcinoma | Female | <65 | III/IV | Unknown | Unknown | SD | |
| ROR1 | SNV | Missense_Mutation | c.748N>C | p.Asp250His | p.D250H | Q01973 | protein_coding | deleterious(0.04) | probably_damaging(0.997) | TCGA-AR-A250-01 | Breast | breast invasive carcinoma | Female | <65 | I/II | Chemotherapy | doxorubicin | SD | |
| ROR1 | SNV | Missense_Mutation | rs749580497 | c.206N>T | p.Thr69Met | p.T69M | Q01973 | protein_coding | tolerated(0.07) | possibly_damaging(0.881) | TCGA-B6-A0I8-01 | Breast | breast invasive carcinoma | Female | <65 | I/II | Unknown | Unknown | PD |
| ROR1 | SNV | Missense_Mutation | rs139362871 | c.1624N>A | p.Val542Ile | p.V542I | Q01973 | protein_coding | tolerated(0.15) | possibly_damaging(0.544) | TCGA-B6-A0IE-01 | Breast | breast invasive carcinoma | Female | <65 | III/IV | Unknown | Unknown | PD |
| Page: 1 2 3 4 5 6 7 8 9 10 11 12 13 |
Top |
Related drugs of malignant transformation related genes |
| Identification of chemicals and drugs interact with genes involved in malignant transfromation |
| (DGIdb 4.0) |
| Entrez ID | Symbol | Category | Interaction Types | Drug Claim Name | Drug Name | PMIDs |
| 4919 | ROR1 | KINASE, TYROSINE KINASE, ENZYME, DRUGGABLE GENOME, CELL SURFACE | Cirmtuzumab | CIRMTUZUMAB | ||
| 4919 | ROR1 | KINASE, TYROSINE KINASE, ENZYME, DRUGGABLE GENOME, CELL SURFACE | ROR1R-CAR-T Cell | |||
| 4919 | ROR1 | KINASE, TYROSINE KINASE, ENZYME, DRUGGABLE GENOME, CELL SURFACE | ROR1 CAR-specific Autologous T-Lymphocytes |
| Page: 1 |

Copyright 2023-Present -The University of Texas Health Science Center at Houston |