
|
|||||
|
 | |
| |
| |
| |
| |
| |
|
Gene: ROMO1 |
Gene summary for ROMO1 |
| Gene information | Species | Human | Gene symbol | ROMO1 | Gene ID | 140823 |
| Gene name | reactive oxygen species modulator 1 | |
| Gene Alias | C20orf52 | |
| Cytomap | 20q11.22 | |
| Gene Type | protein-coding | GO ID | GO:0000302 | UniProtAcc | P60602 |
Top |
Malignant transformation analysis |
| Identification of the aberrant gene expression in precancerous and cancerous lesions by comparing the gene expression of stem-like cells in diseased tissues with normal stem cells |
| Entrez ID | Symbol | Replicates | Species | Organ | Tissue | Adj P-value | Log2FC | Malignancy |
| 140823 | ROMO1 | GSM4909282 | Human | Breast | IDC | 6.21e-07 | 4.10e-01 | -0.0288 |
| 140823 | ROMO1 | GSM4909285 | Human | Breast | IDC | 5.08e-03 | -1.46e-01 | 0.21 |
| 140823 | ROMO1 | GSM4909287 | Human | Breast | IDC | 1.48e-04 | 3.42e-01 | 0.2057 |
| 140823 | ROMO1 | GSM4909290 | Human | Breast | IDC | 2.07e-07 | 4.35e-01 | 0.2096 |
| 140823 | ROMO1 | GSM4909291 | Human | Breast | IDC | 4.66e-06 | 4.26e-01 | 0.1753 |
| 140823 | ROMO1 | GSM4909293 | Human | Breast | IDC | 1.07e-09 | 3.28e-01 | 0.1581 |
| 140823 | ROMO1 | GSM4909294 | Human | Breast | IDC | 8.21e-10 | 3.48e-01 | 0.2022 |
| 140823 | ROMO1 | GSM4909296 | Human | Breast | IDC | 9.13e-13 | 3.29e-01 | 0.1524 |
| 140823 | ROMO1 | GSM4909297 | Human | Breast | IDC | 4.23e-08 | -3.25e-02 | 0.1517 |
| 140823 | ROMO1 | GSM4909298 | Human | Breast | IDC | 1.69e-06 | 3.24e-01 | 0.1551 |
| 140823 | ROMO1 | GSM4909299 | Human | Breast | IDC | 8.40e-05 | 2.82e-01 | 0.035 |
| 140823 | ROMO1 | GSM4909301 | Human | Breast | IDC | 3.37e-20 | 5.44e-01 | 0.1577 |
| 140823 | ROMO1 | GSM4909304 | Human | Breast | IDC | 2.07e-25 | 6.23e-01 | 0.1636 |
| 140823 | ROMO1 | GSM4909307 | Human | Breast | IDC | 6.91e-03 | 3.00e-01 | 0.1569 |
| 140823 | ROMO1 | GSM4909308 | Human | Breast | IDC | 6.62e-05 | 2.11e-01 | 0.158 |
| 140823 | ROMO1 | GSM4909309 | Human | Breast | IDC | 4.53e-10 | 3.72e-01 | 0.0483 |
| 140823 | ROMO1 | GSM4909311 | Human | Breast | IDC | 3.14e-37 | 2.49e-01 | 0.1534 |
| 140823 | ROMO1 | GSM4909312 | Human | Breast | IDC | 6.53e-08 | 1.35e-01 | 0.1552 |
| 140823 | ROMO1 | GSM4909315 | Human | Breast | IDC | 1.16e-23 | 6.34e-01 | 0.21 |
| 140823 | ROMO1 | GSM4909316 | Human | Breast | IDC | 2.38e-15 | 6.16e-01 | 0.21 |
| Page: 1 2 3 4 5 6 7 8 9 10 11 12 13 |
| Tissue | Expression Dynamics | Abbreviation |
| Breast |  | IDC: Invasive ductal carcinoma |
| DCIS: Ductal carcinoma in situ | ||
| Precancer(BRCA1-mut): Precancerous lesion from BRCA1 mutation carriers | ||
| Cervix | 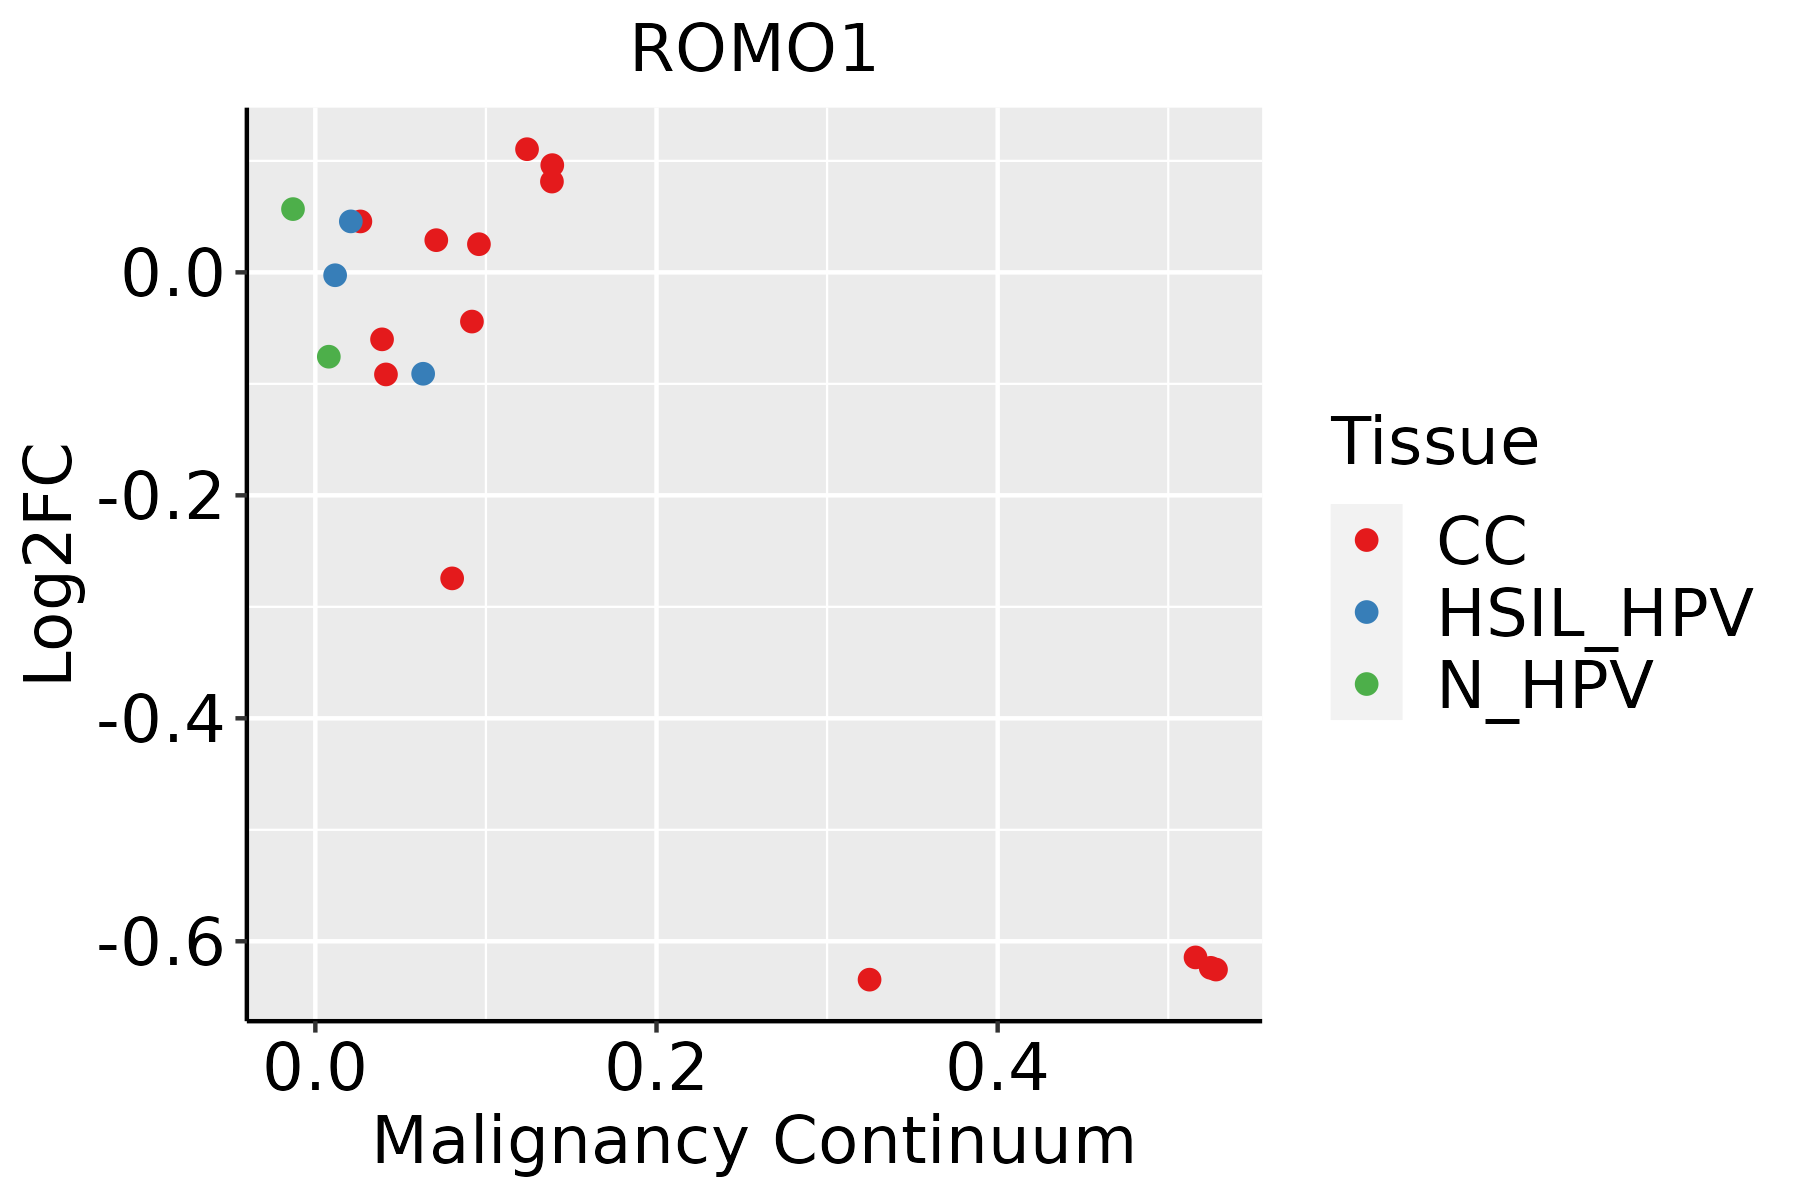 | CC: Cervix cancer |
| HSIL_HPV: HPV-infected high-grade squamous intraepithelial lesions | ||
| N_HPV: HPV-infected normal cervix | ||
| Colorectum (GSE201348) | 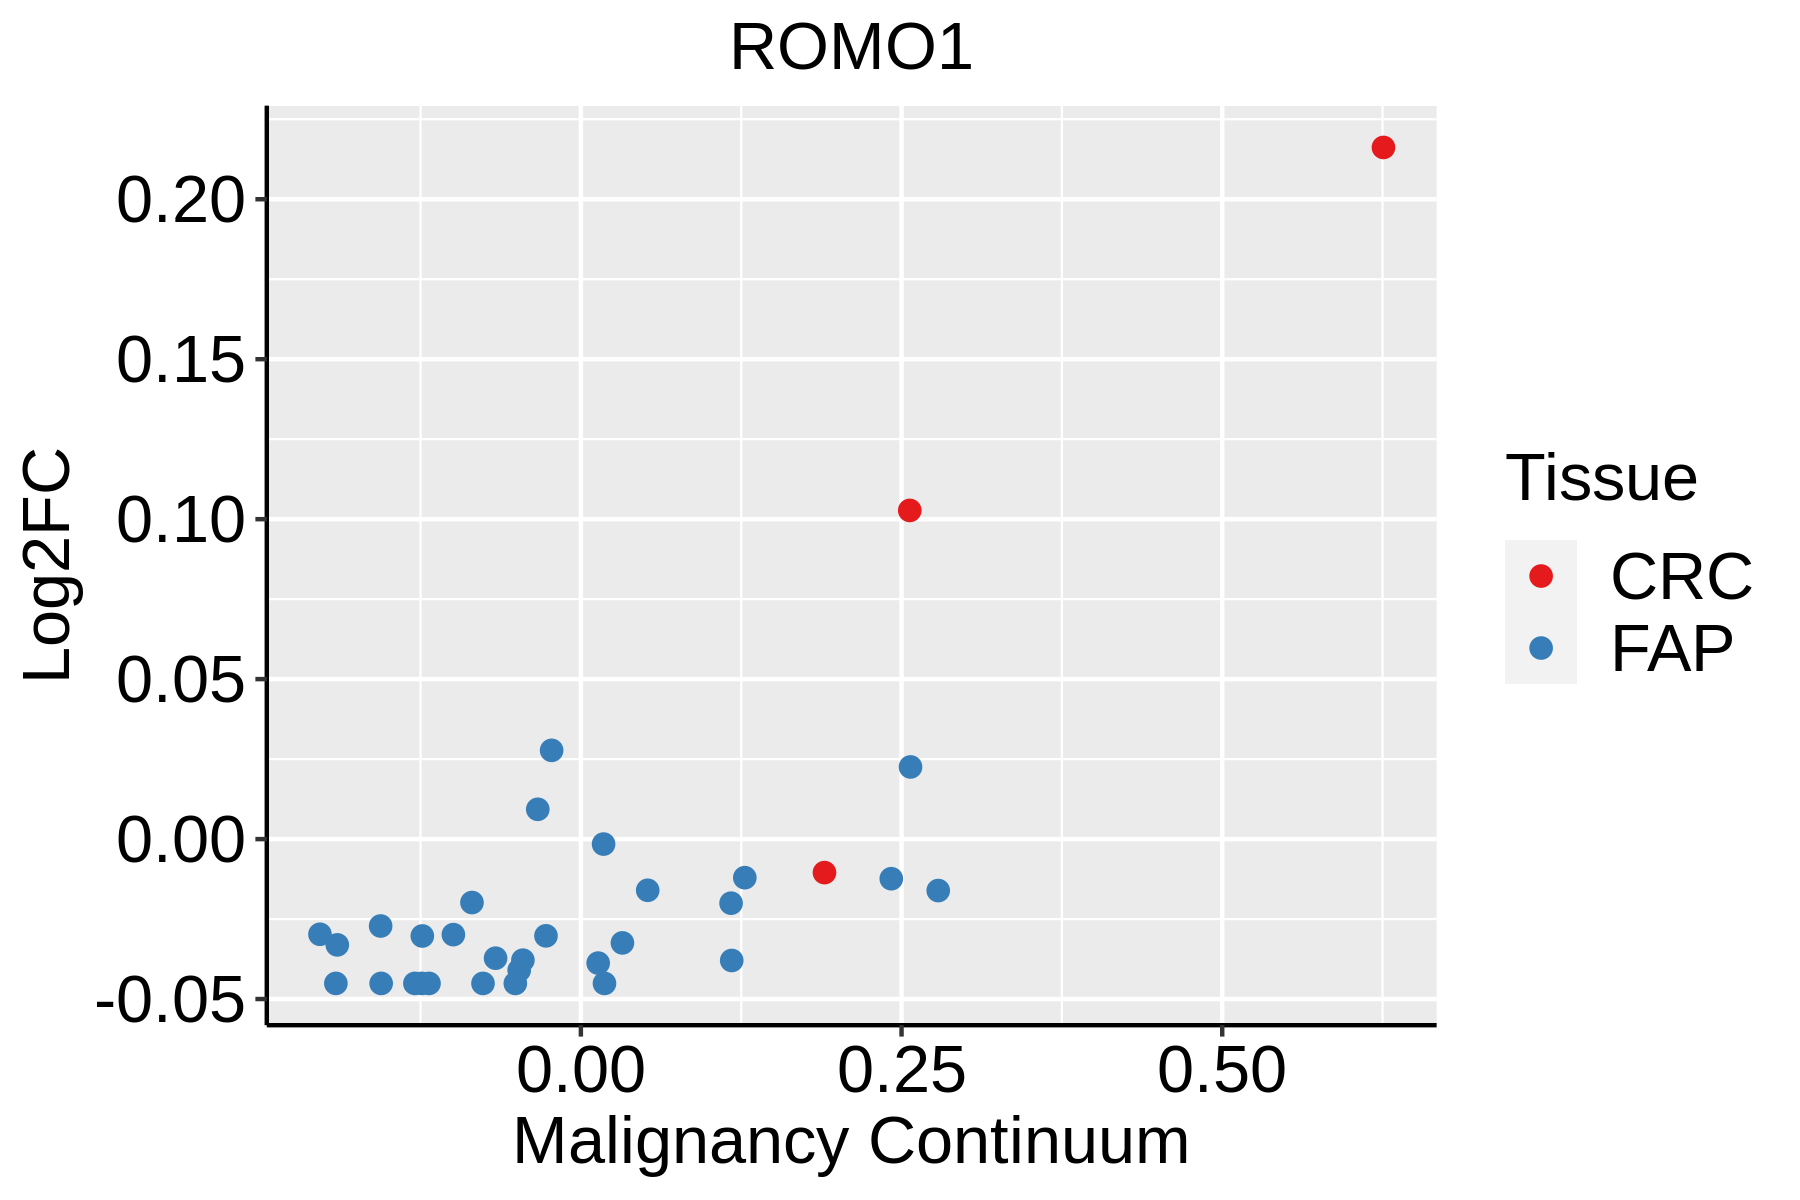 | FAP: Familial adenomatous polyposis |
| CRC: Colorectal cancer | ||
| Colorectum (HTA11) |  | AD: Adenomas |
| SER: Sessile serrated lesions | ||
| MSI-H: Microsatellite-high colorectal cancer | ||
| MSS: Microsatellite stable colorectal cancer | ||
| Endometrium | 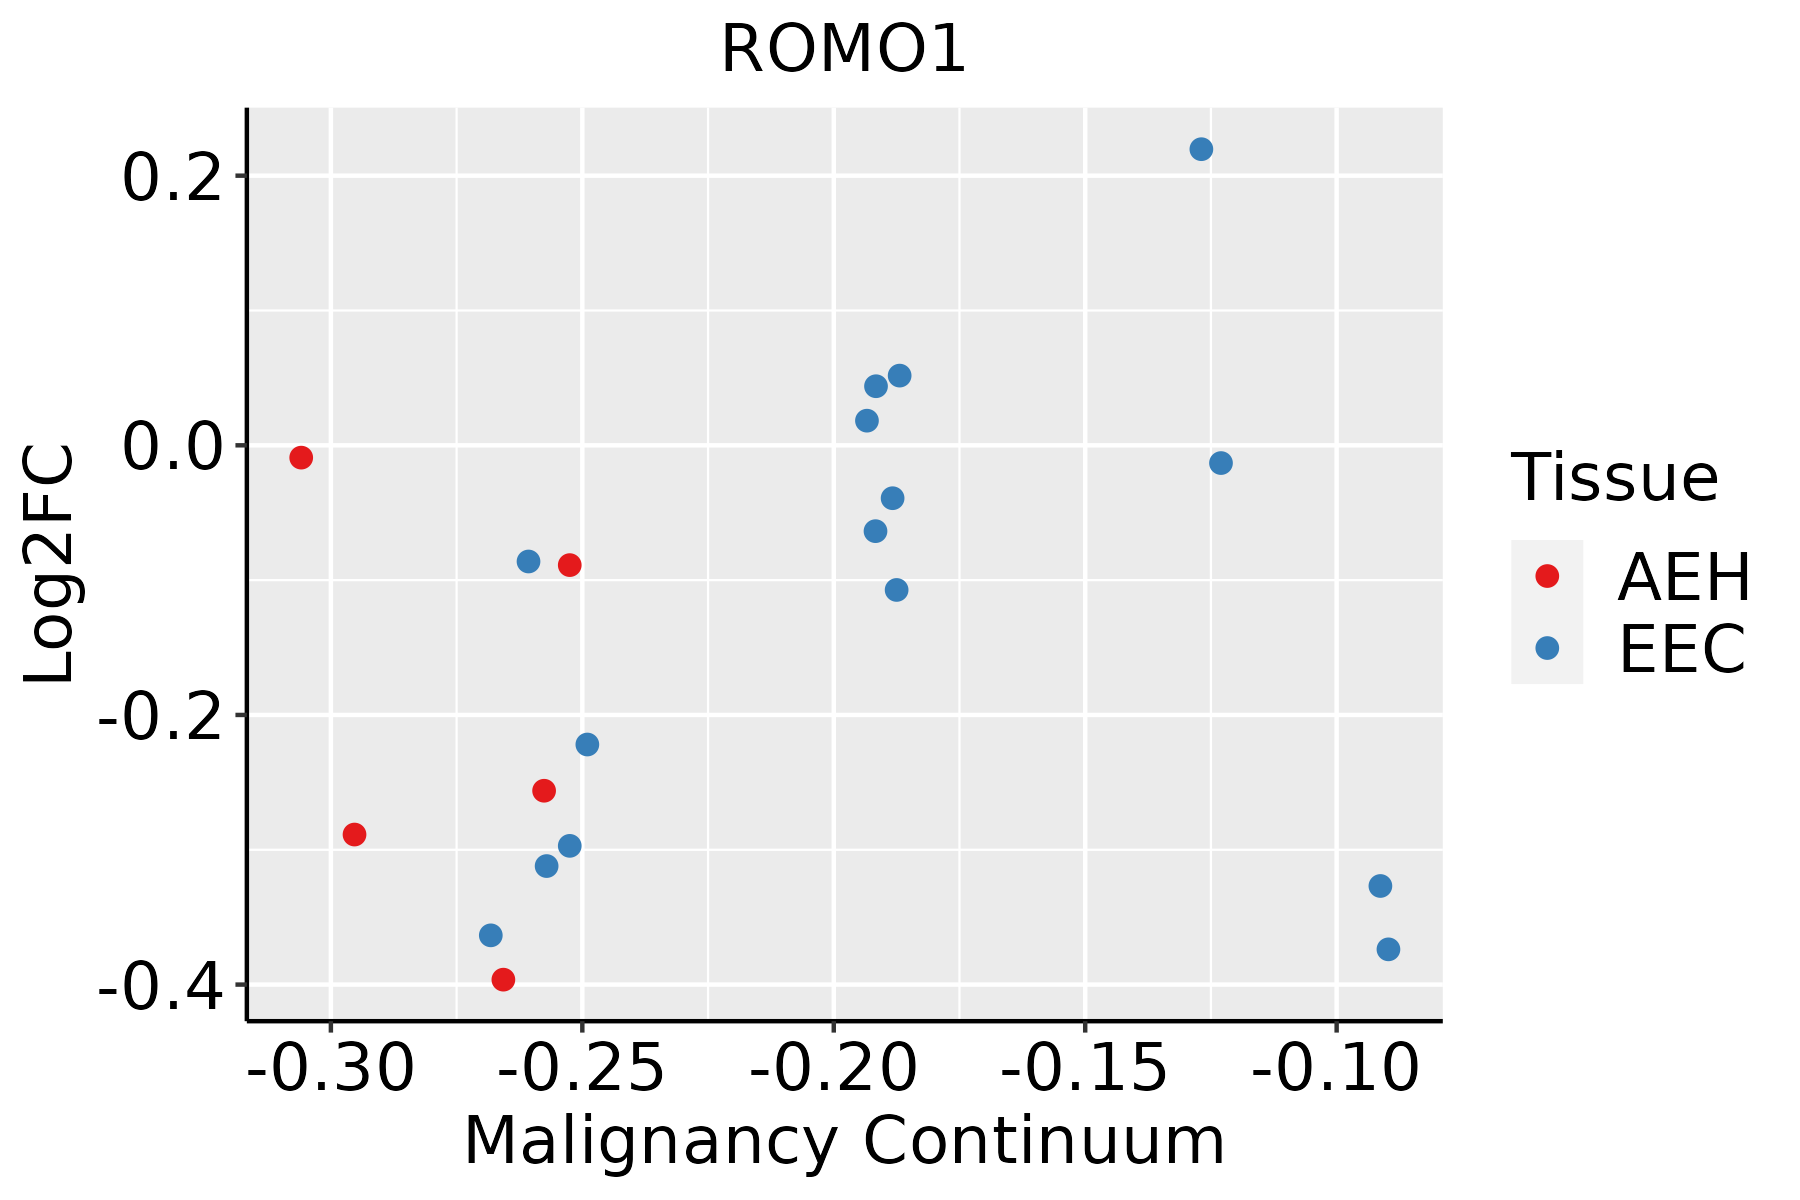 | AEH: Atypical endometrial hyperplasia |
| EEC: Endometrioid Cancer | ||
| Esophagus |  | ESCC: Esophageal squamous cell carcinoma |
| HGIN: High-grade intraepithelial neoplasias | ||
| LGIN: Low-grade intraepithelial neoplasias | ||
| Liver | 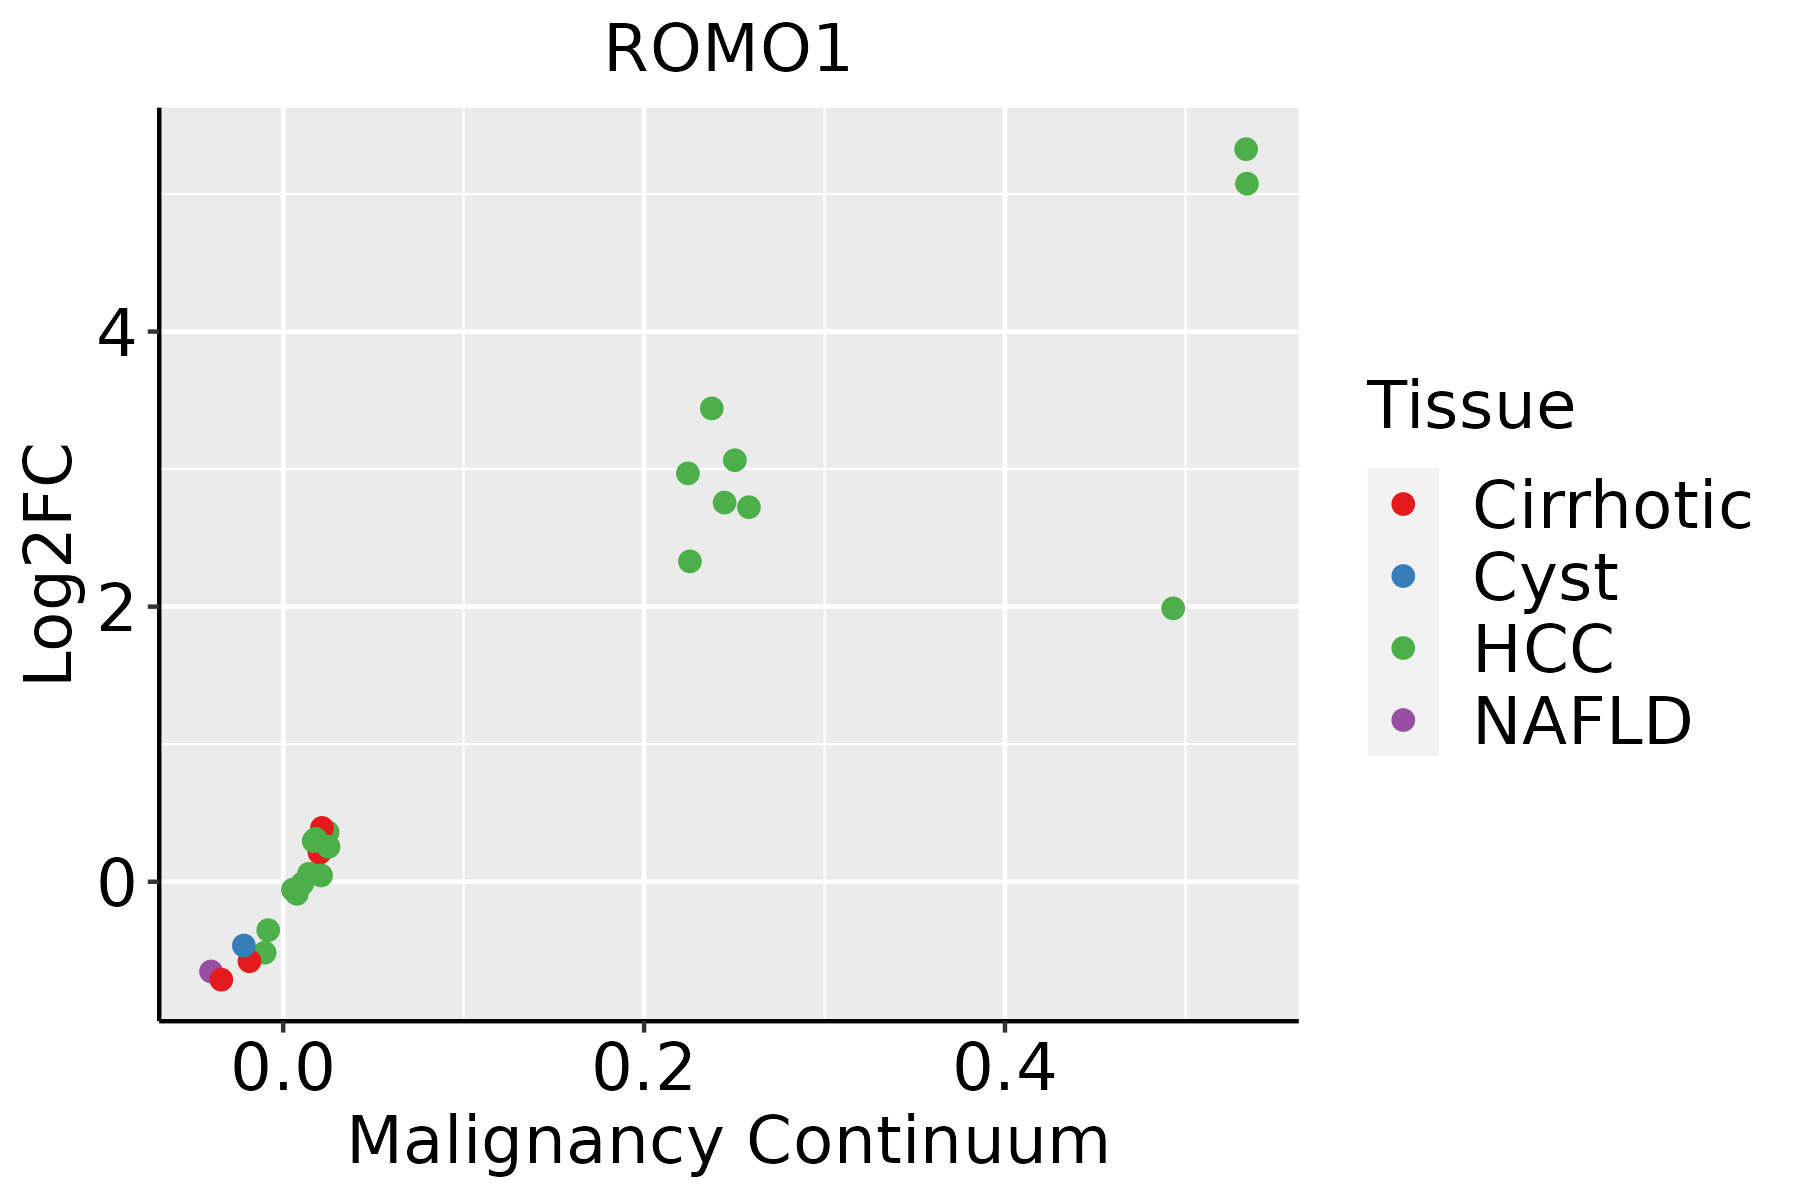 | HCC: Hepatocellular carcinoma |
| NAFLD: Non-alcoholic fatty liver disease | ||
| Oral Cavity |  | EOLP: Erosive Oral lichen planus |
| LP: leukoplakia | ||
| NEOLP: Non-erosive oral lichen planus | ||
| OSCC: Oral squamous cell carcinoma | ||
| Prostate | 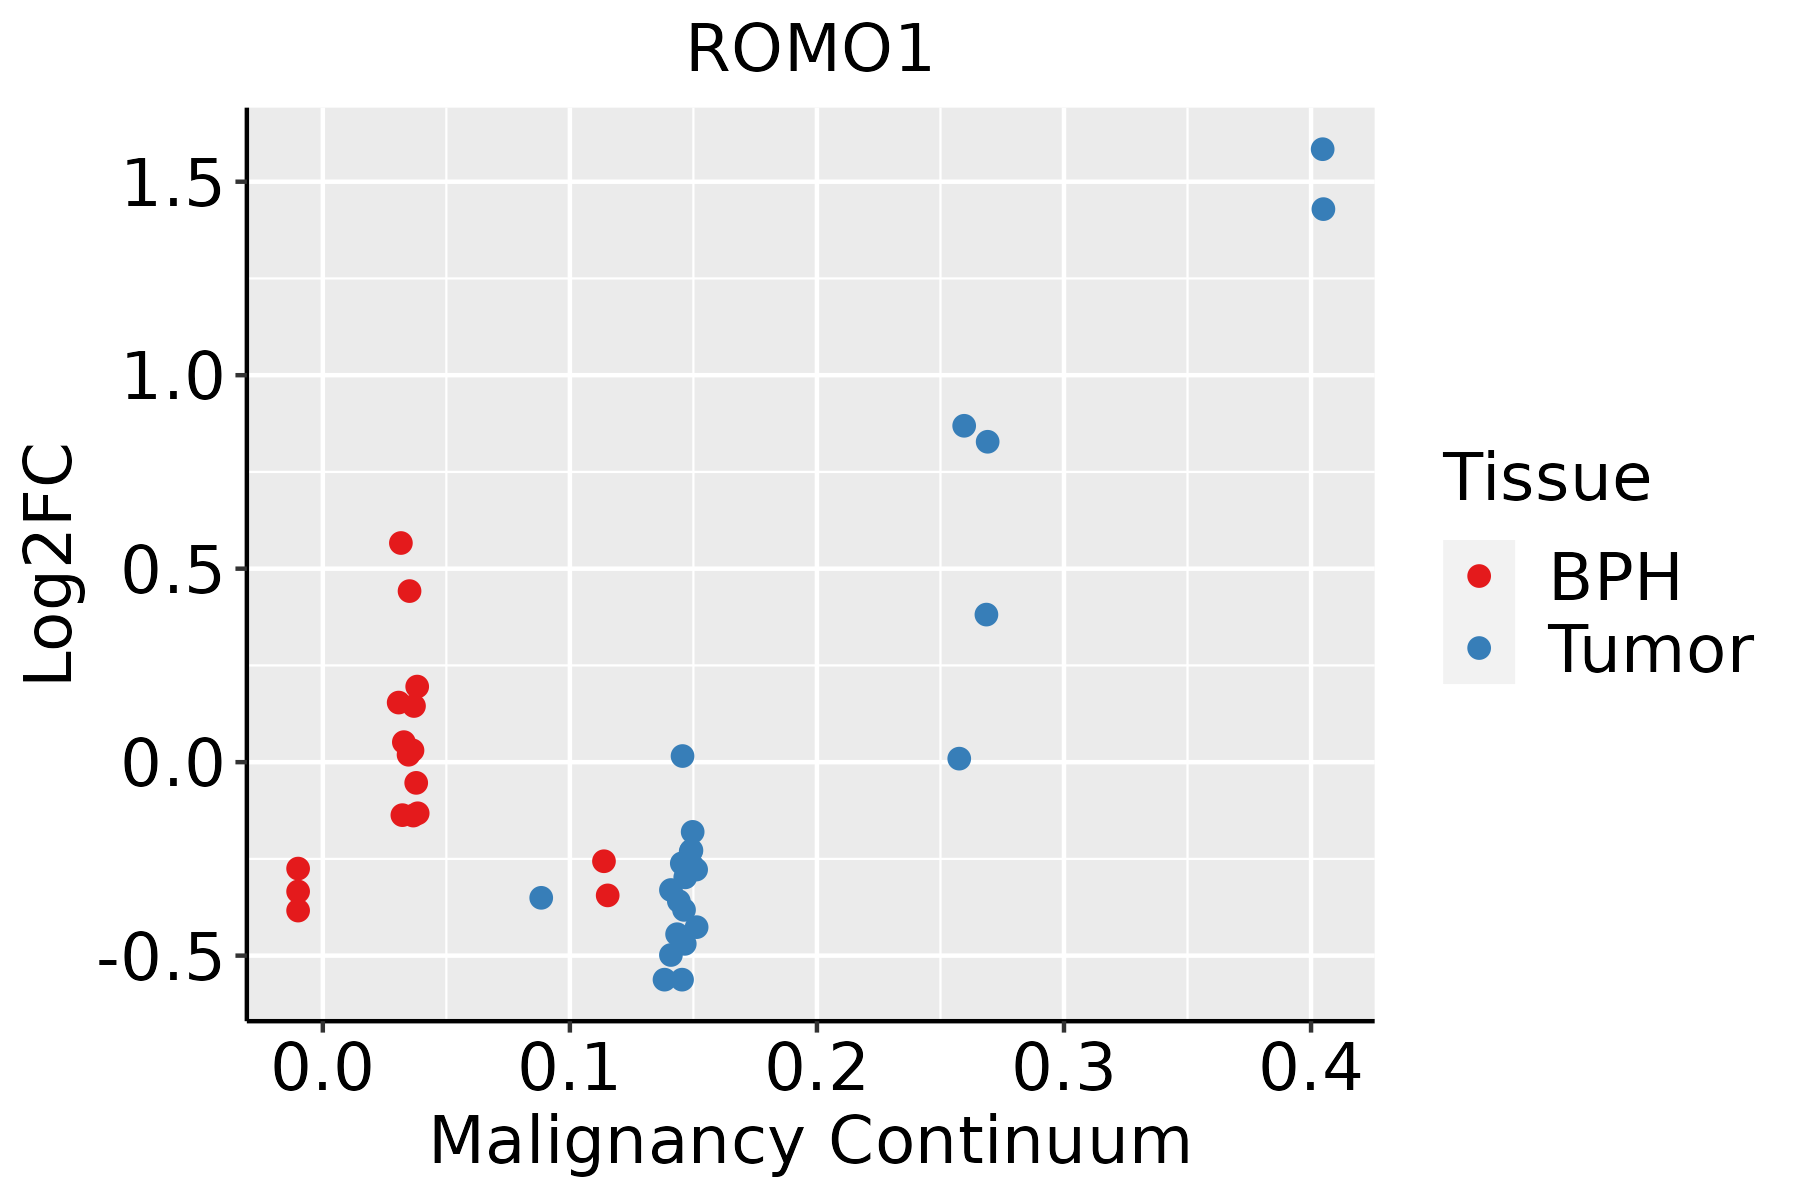 | BPH: Benign Prostatic Hyperplasia |
| Skin |  | AK: Actinic keratosis |
| cSCC: Cutaneous squamous cell carcinoma | ||
| SCCIS:squamous cell carcinoma in situ | ||
| Thyroid | 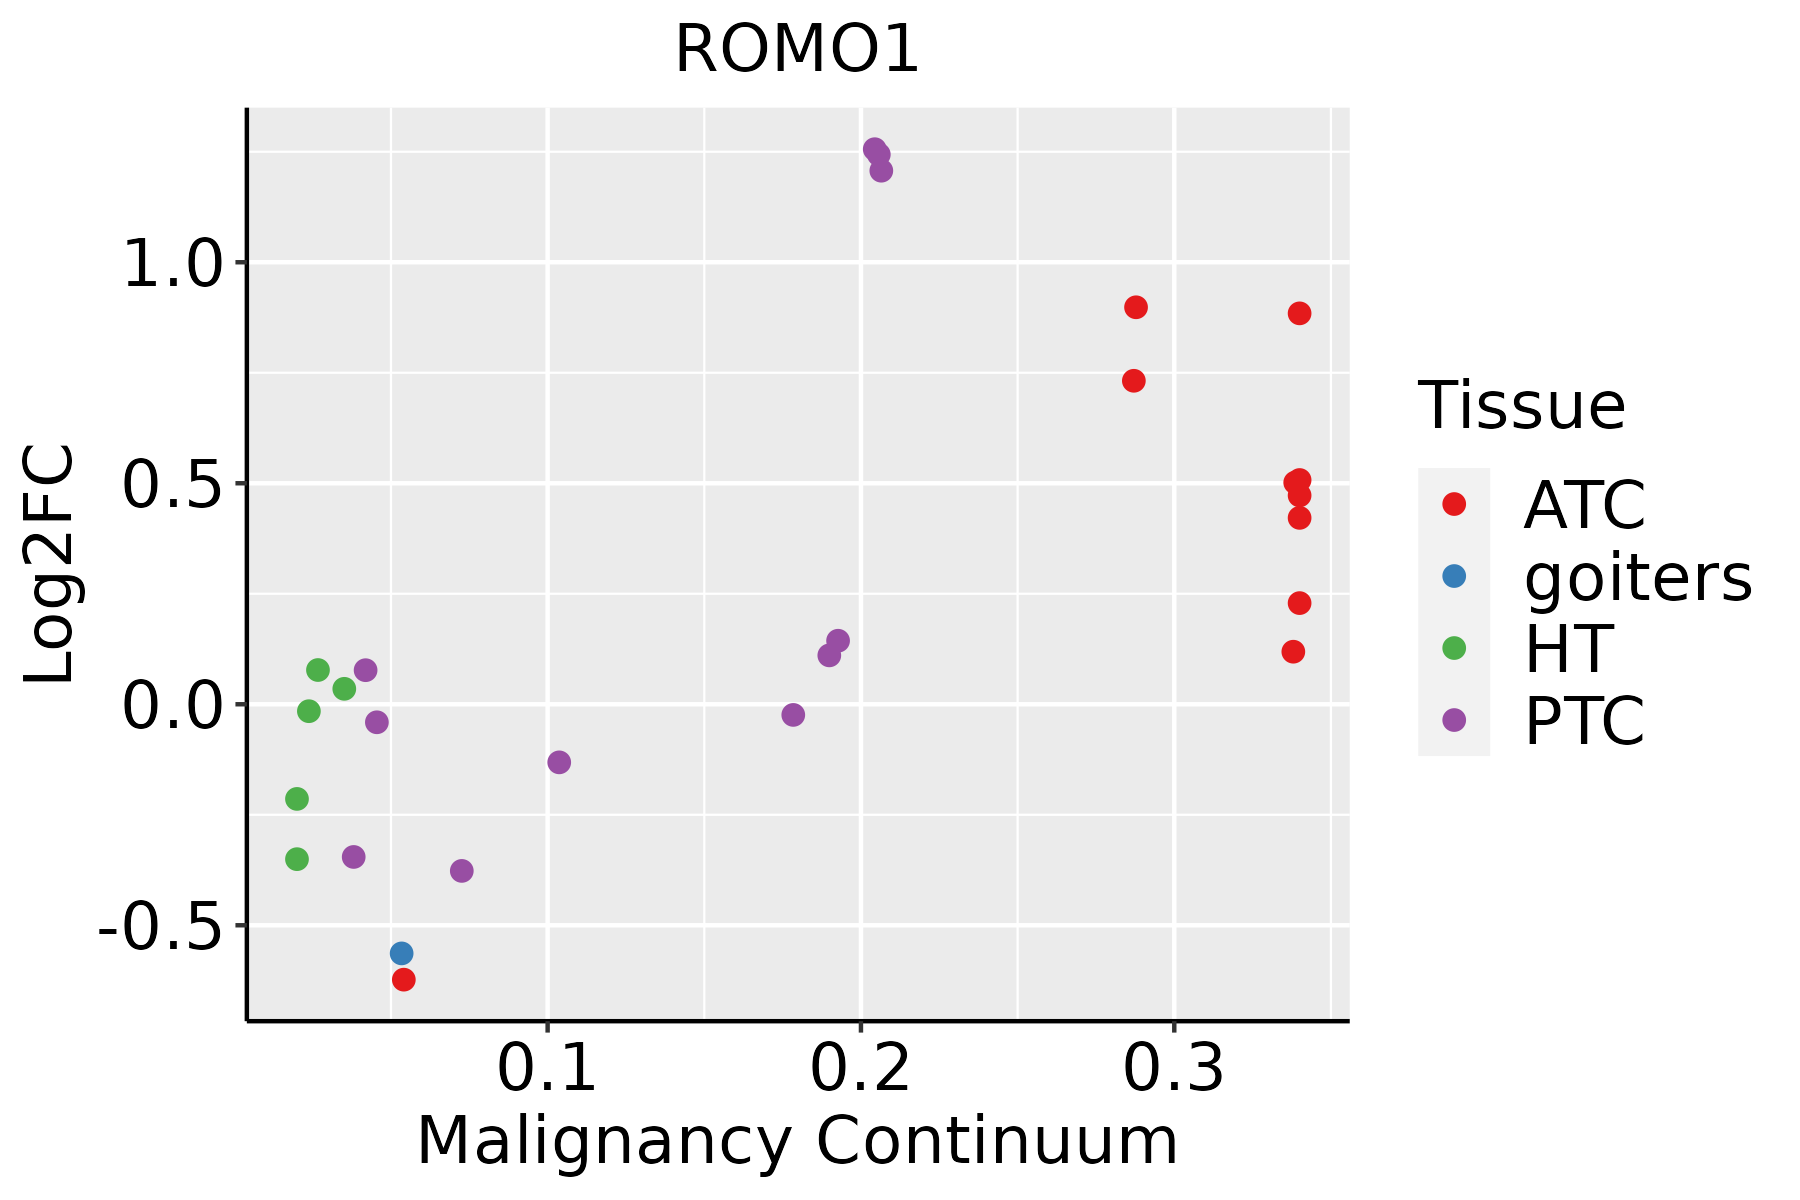 | ATC: Anaplastic thyroid cancer |
| HT: Hashimoto's thyroiditis | ||
| PTC: Papillary thyroid cancer |
| ∗log2FC in expression of this searched gene in stem-like cells from each diseased tissue sample relative to stem-like cells in normal samples in each tissue plotted against the malignancy continuum. Samples are colored based on if they are from different disease stage. |
Top |
Malignant transformation related pathway analysis |
| Find out the enriched GO biological processes and KEGG pathways involved in transition from healthy to precancer to cancer |
| Tissue | Disease Stage | Enriched GO biological Processes |
| Colorectum | AD |  |
| Colorectum | SER |  |
| Colorectum | MSS |  |
| Colorectum | MSI-H |  |
| Colorectum | FAP |  |
| ∗Top 15 enriched GO BP terms are showed in the bar plot of each disease state in each tissue. Each row represents a significant GO biological process which is colored according to the -log10(p.adjust). |
| Page: 1 2 3 4 5 6 7 8 9 |
| GO ID | Tissue | Disease Stage | Description | Gene Ratio | Bg Ratio | pvalue | p.adjust | Count |
| GO:00069799 | Breast | Precancer | response to oxidative stress | 70/1080 | 446/18723 | 1.59e-14 | 4.26e-12 | 70 |
| GO:00068398 | Breast | Precancer | mitochondrial transport | 45/1080 | 254/18723 | 1.37e-11 | 1.88e-09 | 45 |
| GO:00621979 | Breast | Precancer | cellular response to chemical stress | 51/1080 | 337/18723 | 2.40e-10 | 2.34e-08 | 51 |
| GO:00003029 | Breast | Precancer | response to reactive oxygen species | 38/1080 | 222/18723 | 1.47e-09 | 1.23e-07 | 38 |
| GO:00345999 | Breast | Precancer | cellular response to oxidative stress | 42/1080 | 288/18723 | 2.78e-08 | 1.79e-06 | 42 |
| GO:00444039 | Breast | Precancer | biological process involved in symbiotic interaction | 42/1080 | 290/18723 | 3.40e-08 | 2.11e-06 | 42 |
| GO:19905427 | Breast | Precancer | mitochondrial transmembrane transport | 22/1080 | 102/18723 | 6.38e-08 | 3.80e-06 | 22 |
| GO:00075688 | Breast | Precancer | aging | 41/1080 | 339/18723 | 5.95e-06 | 1.71e-04 | 41 |
| GO:00705858 | Breast | Precancer | protein localization to mitochondrion | 21/1080 | 125/18723 | 9.07e-06 | 2.42e-04 | 21 |
| GO:00070066 | Breast | Precancer | mitochondrial membrane organization | 20/1080 | 116/18723 | 9.88e-06 | 2.61e-04 | 20 |
| GO:00726558 | Breast | Precancer | establishment of protein localization to mitochondrion | 20/1080 | 120/18723 | 1.66e-05 | 4.03e-04 | 20 |
| GO:00346149 | Breast | Precancer | cellular response to reactive oxygen species | 23/1080 | 155/18723 | 2.82e-05 | 6.31e-04 | 23 |
| GO:00725938 | Breast | Precancer | reactive oxygen species metabolic process | 30/1080 | 239/18723 | 5.13e-05 | 1.07e-03 | 30 |
| GO:00197307 | Breast | Precancer | antimicrobial humoral response | 19/1080 | 122/18723 | 7.02e-05 | 1.40e-03 | 19 |
| GO:00618446 | Breast | Precancer | antimicrobial humoral immune response mediated by antimicrobial peptide | 14/1080 | 79/18723 | 1.53e-04 | 2.61e-03 | 14 |
| GO:00901516 | Breast | Precancer | establishment of protein localization to mitochondrial membrane | 8/1080 | 30/18723 | 2.24e-04 | 3.40e-03 | 8 |
| GO:00066268 | Breast | Precancer | protein targeting to mitochondrion | 15/1080 | 100/18723 | 5.94e-04 | 7.48e-03 | 15 |
| GO:00066059 | Breast | Precancer | protein targeting | 33/1080 | 314/18723 | 6.50e-04 | 7.99e-03 | 33 |
| GO:20003778 | Breast | Precancer | regulation of reactive oxygen species metabolic process | 20/1080 | 157/18723 | 7.19e-04 | 8.65e-03 | 20 |
| GO:00725948 | Breast | Precancer | establishment of protein localization to organelle | 41/1080 | 422/18723 | 7.75e-04 | 9.20e-03 | 41 |
| Page: 1 2 3 4 5 6 7 8 9 10 11 12 13 14 15 16 17 18 19 20 21 22 23 24 25 26 27 28 29 |
| Pathway ID | Tissue | Disease Stage | Description | Gene Ratio | Bg Ratio | pvalue | p.adjust | qvalue | Count |
| Page: 1 |
Top |
Cell-cell communication analysis |
| Identification of potential cell-cell interactions between two cell types and their ligand-receptor pairs for different disease states |
| Ligand | Receptor | LRpair | Pathway | Tissue | Disease Stage |
| Page: 1 |
Top |
Single-cell gene regulatory network inference analysis |
| Find out the significant the regulons (TFs) and the target genes of each regulon across cell types for different disease states |
| TF | Cell Type | Tissue | Disease Stage | Target Gene | RSS | Regulon Activity |
| ∗The dot plots of a searched regulon are shown for all cell subpopulations in each disease state of each tissue based on the regulon specific score inferred using pySCENIC and by calculating the average expression. |
| Page: 1 |
Top |
Somatic mutation of malignant transformation related genes |
| Annotation of somatic variants for genes involved in malignant transformation |
| Hugo Symbol | Variant Class | Variant Classification | dbSNP RS | HGVSc | HGVSp | HGVSp Short | SWISSPROT | BIOTYPE | SIFT | PolyPhen | Tumor Sample Barcode | Tissue | Histology | Sex | Age | Stage | Therapy Types | Drugs | Outcome |
| ROMO1 | SNV | Missense_Mutation | c.172N>G | p.Lys58Glu | p.K58E | P60602 | protein_coding | deleterious(0) | probably_damaging(0.992) | TCGA-AP-A056-01 | Endometrium | uterine corpus endometrioid carcinoma | Female | <65 | I/II | Unknown | Unknown | SD | |
| ROMO1 | SNV | Missense_Mutation | novel | c.142C>T | p.Arg48Trp | p.R48W | P60602 | protein_coding | deleterious(0.04) | benign(0.007) | TCGA-DF-A2KU-01 | Endometrium | uterine corpus endometrioid carcinoma | Female | Unknown | I/II | Unknown | Unknown | SD |
| ROMO1 | SNV | Missense_Mutation | novel | c.186N>C | p.Gln62His | p.Q62H | P60602 | protein_coding | deleterious(0.04) | benign(0.425) | TCGA-85-A4QQ-01 | Lung | lung squamous cell carcinoma | Male | >=65 | I/II | Unknown | Unknown | SD |
| ROMO1 | SNV | Missense_Mutation | rs749056787 | c.193N>A | p.Gly65Ser | p.G65S | P60602 | protein_coding | tolerated(0.16) | benign(0.056) | TCGA-VQ-A8P2-01 | Stomach | stomach adenocarcinoma | Male | >=65 | III/IV | Unspecific | Complete Response | |
| ROMO1 | SNV | Missense_Mutation | novel | c.37N>A | p.Pro13Thr | p.P13T | P60602 | protein_coding | deleterious(0) | possibly_damaging(0.887) | TCGA-VQ-AA68-01 | Stomach | stomach adenocarcinoma | Female | <65 | III/IV | Chemotherapy | fluorouracil | CR |
| Page: 1 |
Top |
Related drugs of malignant transformation related genes |
| Identification of chemicals and drugs interact with genes involved in malignant transfromation |
| (DGIdb 4.0) |
| Entrez ID | Symbol | Category | Interaction Types | Drug Claim Name | Drug Name | PMIDs |
| Page: 1 |

Copyright 2023-Present -The University of Texas Health Science Center at Houston |