
|
|||||
|
 | |
| |
| |
| |
| |
| |
|
Gene: ROCR |
Gene summary for ROCR |
| Gene information | Species | Human | Gene symbol | ROCR | Gene ID | 102723505 |
| Gene name | regulator of chondrogenesis RNA | |
| Gene Alias | LINC02095 | |
| Cytomap | 17q24.3 | |
| Gene Type | ncRNA | GO ID | NA | UniProtAcc | NA |
Top |
Malignant transformation analysis |
| Identification of the aberrant gene expression in precancerous and cancerous lesions by comparing the gene expression of stem-like cells in diseased tissues with normal stem cells |
| Entrez ID | Symbol | Replicates | Species | Organ | Tissue | Adj P-value | Log2FC | Malignancy |
| 102723505 | ROCR | GSM4909281 | Human | Breast | IDC | 4.97e-26 | 6.28e-01 | 0.21 |
| 102723505 | ROCR | GSM4909286 | Human | Breast | IDC | 1.58e-38 | 7.08e-01 | 0.1081 |
| 102723505 | ROCR | GSM4909299 | Human | Breast | IDC | 9.12e-07 | 2.95e-01 | 0.035 |
| 102723505 | ROCR | GSM4909305 | Human | Breast | IDC | 1.47e-02 | 2.27e-01 | 0.0436 |
| 102723505 | ROCR | DCIS2 | Human | Breast | DCIS | 1.38e-54 | 3.19e-01 | 0.0085 |
| Page: 1 |
| Tissue | Expression Dynamics | Abbreviation |
| Breast | 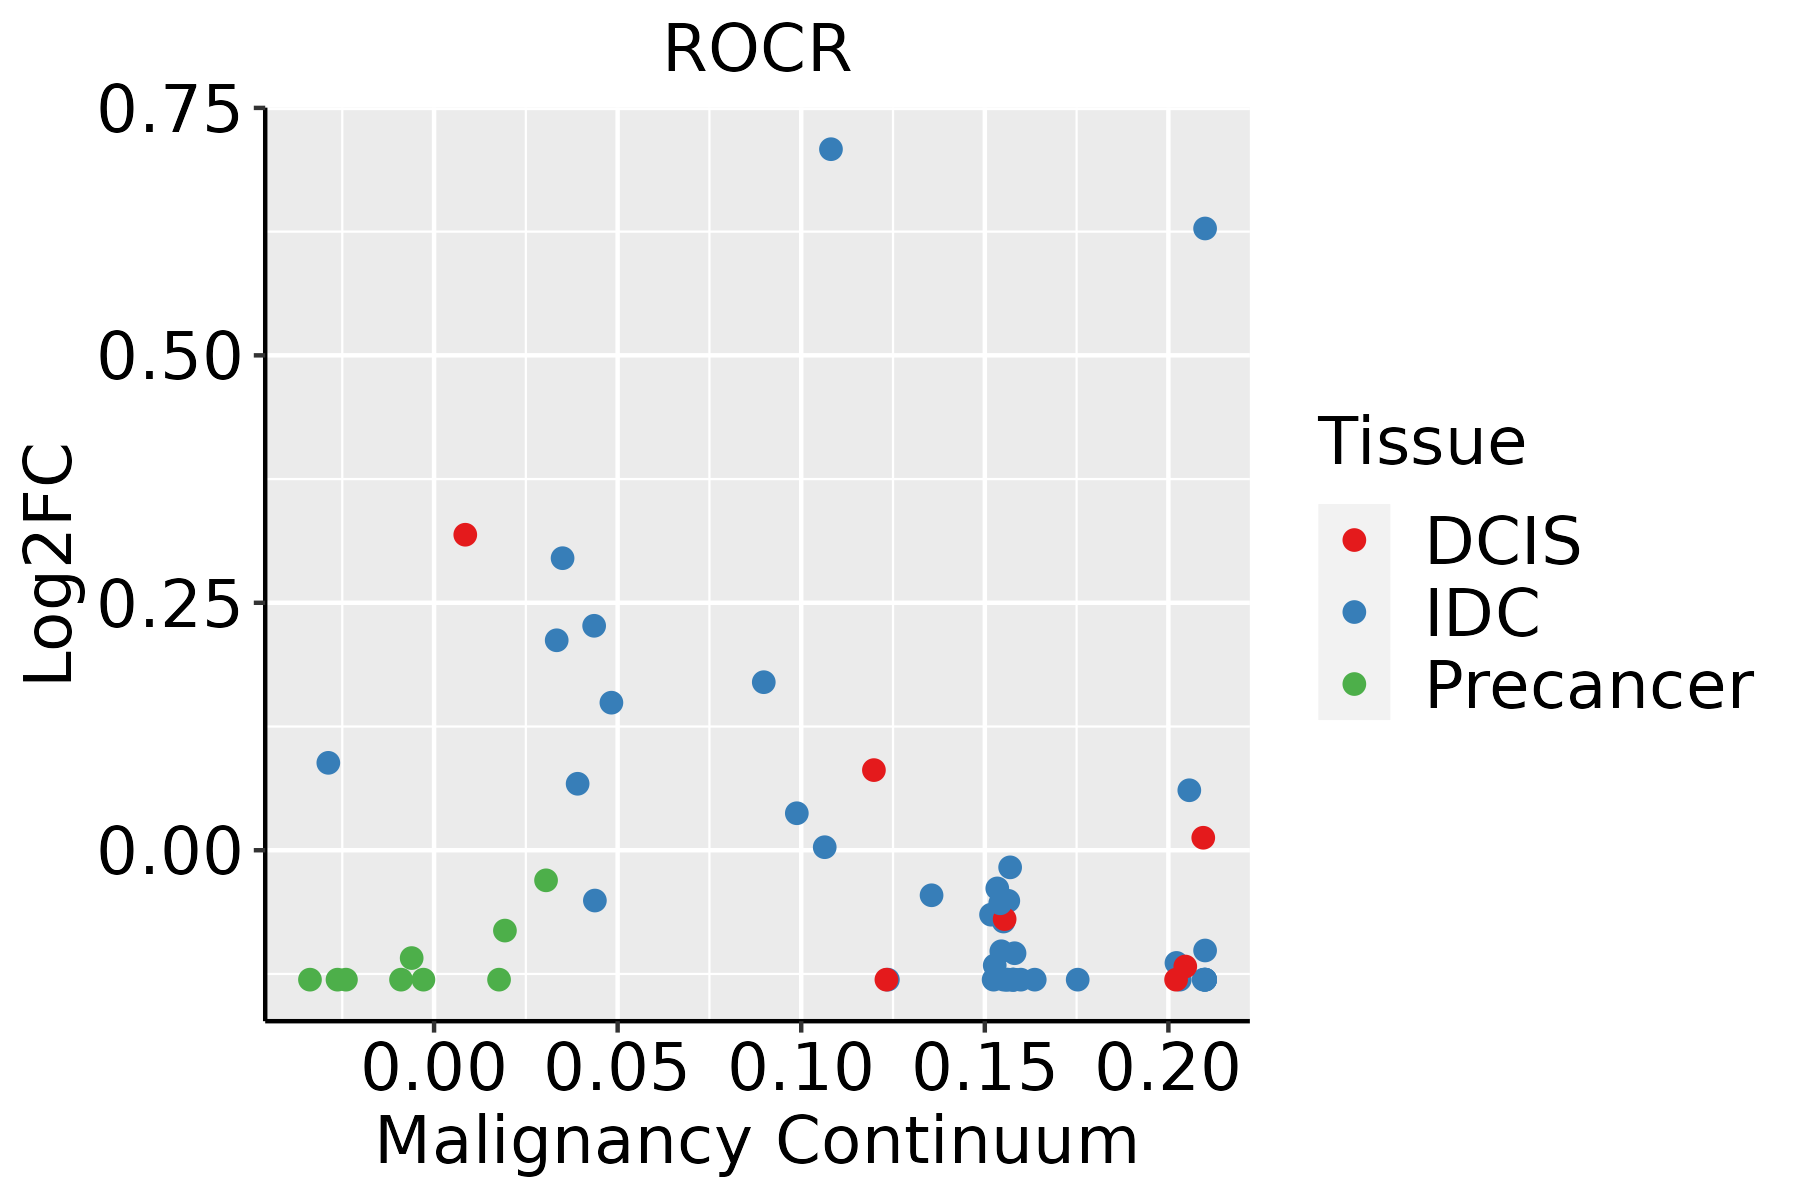 | IDC: Invasive ductal carcinoma |
| DCIS: Ductal carcinoma in situ | ||
| Precancer(BRCA1-mut): Precancerous lesion from BRCA1 mutation carriers |
| ∗log2FC in expression of this searched gene in stem-like cells from each diseased tissue sample relative to stem-like cells in normal samples in each tissue plotted against the malignancy continuum. Samples are colored based on if they are from different disease stage. |
Top |
Malignant transformation related pathway analysis |
| Find out the enriched GO biological processes and KEGG pathways involved in transition from healthy to precancer to cancer |
| Tissue | Disease Stage | Enriched GO biological Processes |
| Colorectum | AD |  |
| Colorectum | SER |  |
| Colorectum | MSS |  |
| Colorectum | MSI-H |  |
| Colorectum | FAP |  |
| ∗Top 15 enriched GO BP terms are showed in the bar plot of each disease state in each tissue. Each row represents a significant GO biological process which is colored according to the -log10(p.adjust). |
| Page: 1 2 3 4 5 6 7 8 9 |
| GO ID | Tissue | Disease Stage | Description | Gene Ratio | Bg Ratio | pvalue | p.adjust | Count |
| GO:004206027 | Esophagus | ESCC | wound healing | 243/8552 | 422/18723 | 4.62e-07 | 6.25e-06 | 243 |
| GO:004206020 | Oral cavity | OSCC | wound healing | 237/7305 | 422/18723 | 4.51e-13 | 2.18e-11 | 237 |
| GO:005087819 | Oral cavity | OSCC | regulation of body fluid levels | 179/7305 | 379/18723 | 6.19e-04 | 3.50e-03 | 179 |
| GO:00075969 | Oral cavity | OSCC | blood coagulation | 102/7305 | 217/18723 | 9.69e-03 | 3.43e-02 | 102 |
| GO:00075999 | Oral cavity | OSCC | hemostasis | 103/7305 | 222/18723 | 1.45e-02 | 4.73e-02 | 103 |
| GO:00508179 | Oral cavity | OSCC | coagulation | 103/7305 | 222/18723 | 1.45e-02 | 4.73e-02 | 103 |
| GO:0042060110 | Oral cavity | LP | wound healing | 139/4623 | 422/18723 | 7.10e-05 | 9.48e-04 | 139 |
| GO:004206026 | Oral cavity | EOLP | wound healing | 99/2218 | 422/18723 | 1.18e-11 | 1.85e-09 | 99 |
| GO:005081715 | Oral cavity | EOLP | coagulation | 43/2218 | 222/18723 | 7.59e-04 | 6.09e-03 | 43 |
| GO:000759615 | Oral cavity | EOLP | blood coagulation | 42/2218 | 217/18723 | 8.81e-04 | 6.76e-03 | 42 |
| GO:000759915 | Oral cavity | EOLP | hemostasis | 42/2218 | 222/18723 | 1.40e-03 | 9.58e-03 | 42 |
| GO:0050878110 | Oral cavity | EOLP | regulation of body fluid levels | 63/2218 | 379/18723 | 3.36e-03 | 1.94e-02 | 63 |
| GO:004206033 | Oral cavity | NEOLP | wound healing | 106/2005 | 422/18723 | 1.93e-17 | 1.91e-14 | 106 |
| GO:005081722 | Oral cavity | NEOLP | coagulation | 48/2005 | 222/18723 | 1.51e-06 | 3.77e-05 | 48 |
| GO:000759621 | Oral cavity | NEOLP | blood coagulation | 47/2005 | 217/18723 | 1.84e-06 | 4.44e-05 | 47 |
| GO:000759921 | Oral cavity | NEOLP | hemostasis | 47/2005 | 222/18723 | 3.57e-06 | 7.85e-05 | 47 |
| GO:005087825 | Oral cavity | NEOLP | regulation of body fluid levels | 70/2005 | 379/18723 | 3.62e-06 | 7.94e-05 | 70 |
| GO:00508184 | Oral cavity | NEOLP | regulation of coagulation | 16/2005 | 71/18723 | 2.95e-03 | 1.81e-02 | 16 |
| GO:004206029 | Skin | cSCC | wound healing | 152/4864 | 422/18723 | 2.66e-06 | 4.26e-05 | 152 |
| GO:004206034 | Thyroid | ATC | wound healing | 210/6293 | 422/18723 | 3.33e-12 | 1.37e-10 | 210 |
| Page: 1 2 |
| Pathway ID | Tissue | Disease Stage | Description | Gene Ratio | Bg Ratio | pvalue | p.adjust | qvalue | Count |
| Page: 1 |
Top |
Cell-cell communication analysis |
| Identification of potential cell-cell interactions between two cell types and their ligand-receptor pairs for different disease states |
| Ligand | Receptor | LRpair | Pathway | Tissue | Disease Stage |
| Page: 1 |
Top |
Single-cell gene regulatory network inference analysis |
| Find out the significant the regulons (TFs) and the target genes of each regulon across cell types for different disease states |
| TF | Cell Type | Tissue | Disease Stage | Target Gene | RSS | Regulon Activity |
| ∗The dot plots of a searched regulon are shown for all cell subpopulations in each disease state of each tissue based on the regulon specific score inferred using pySCENIC and by calculating the average expression. |
| Page: 1 |
Top |
Somatic mutation of malignant transformation related genes |
| Annotation of somatic variants for genes involved in malignant transformation |
| Hugo Symbol | Variant Class | Variant Classification | dbSNP RS | HGVSc | HGVSp | HGVSp Short | SWISSPROT | BIOTYPE | SIFT | PolyPhen | Tumor Sample Barcode | Tissue | Histology | Sex | Age | Stage | Therapy Types | Drugs | Outcome |
| Page: 1 |
Top |
Related drugs of malignant transformation related genes |
| Identification of chemicals and drugs interact with genes involved in malignant transfromation |
| (DGIdb 4.0) |
| Entrez ID | Symbol | Category | Interaction Types | Drug Claim Name | Drug Name | PMIDs |
| Page: 1 |

Copyright 2023-Present -The University of Texas Health Science Center at Houston |