
|
|||||
|
 | |
| |
| |
| |
| |
| |
|
Gene: ROBO3 |
Gene summary for ROBO3 |
| Gene information | Species | Human | Gene symbol | ROBO3 | Gene ID | 64221 |
| Gene name | roundabout guidance receptor 3 | |
| Gene Alias | HGPPS | |
| Cytomap | 11q24.2 | |
| Gene Type | protein-coding | GO ID | GO:0000902 | UniProtAcc | Q96MS0 |
Top |
Malignant transformation analysis |
| Identification of the aberrant gene expression in precancerous and cancerous lesions by comparing the gene expression of stem-like cells in diseased tissues with normal stem cells |
| Entrez ID | Symbol | Replicates | Species | Organ | Tissue | Adj P-value | Log2FC | Malignancy |
| 64221 | ROBO3 | P2T-E | Human | Esophagus | ESCC | 3.79e-20 | 3.07e-01 | 0.1177 |
| 64221 | ROBO3 | P4T-E | Human | Esophagus | ESCC | 6.42e-12 | 1.41e-01 | 0.1323 |
| 64221 | ROBO3 | P5T-E | Human | Esophagus | ESCC | 4.09e-02 | -1.81e-02 | 0.1327 |
| 64221 | ROBO3 | P8T-E | Human | Esophagus | ESCC | 3.69e-04 | 3.16e-02 | 0.0889 |
| 64221 | ROBO3 | P10T-E | Human | Esophagus | ESCC | 5.10e-12 | 2.20e-01 | 0.116 |
| 64221 | ROBO3 | P11T-E | Human | Esophagus | ESCC | 1.69e-04 | 1.34e-01 | 0.1426 |
| 64221 | ROBO3 | P16T-E | Human | Esophagus | ESCC | 2.38e-23 | 4.41e-01 | 0.1153 |
| 64221 | ROBO3 | P19T-E | Human | Esophagus | ESCC | 3.39e-02 | 2.57e-01 | 0.1662 |
| 64221 | ROBO3 | P21T-E | Human | Esophagus | ESCC | 2.09e-10 | 7.79e-02 | 0.1617 |
| 64221 | ROBO3 | P22T-E | Human | Esophagus | ESCC | 3.29e-07 | 1.34e-03 | 0.1236 |
| 64221 | ROBO3 | P24T-E | Human | Esophagus | ESCC | 7.45e-05 | 1.44e-02 | 0.1287 |
| 64221 | ROBO3 | P26T-E | Human | Esophagus | ESCC | 1.43e-35 | 5.21e-01 | 0.1276 |
| 64221 | ROBO3 | P27T-E | Human | Esophagus | ESCC | 1.09e-07 | 1.07e-01 | 0.1055 |
| 64221 | ROBO3 | P28T-E | Human | Esophagus | ESCC | 9.69e-03 | -8.19e-03 | 0.1149 |
| 64221 | ROBO3 | P30T-E | Human | Esophagus | ESCC | 1.10e-02 | 8.71e-02 | 0.137 |
| 64221 | ROBO3 | P31T-E | Human | Esophagus | ESCC | 4.46e-12 | 2.96e-01 | 0.1251 |
| 64221 | ROBO3 | P37T-E | Human | Esophagus | ESCC | 1.36e-15 | 2.42e-01 | 0.1371 |
| 64221 | ROBO3 | P44T-E | Human | Esophagus | ESCC | 3.38e-02 | 1.47e-02 | 0.1096 |
| 64221 | ROBO3 | P47T-E | Human | Esophagus | ESCC | 3.97e-04 | -1.25e-02 | 0.1067 |
| 64221 | ROBO3 | P49T-E | Human | Esophagus | ESCC | 4.73e-14 | 1.13e+00 | 0.1768 |
| Page: 1 2 |
| Tissue | Expression Dynamics | Abbreviation |
| Esophagus |  | ESCC: Esophageal squamous cell carcinoma |
| HGIN: High-grade intraepithelial neoplasias | ||
| LGIN: Low-grade intraepithelial neoplasias | ||
| Liver | 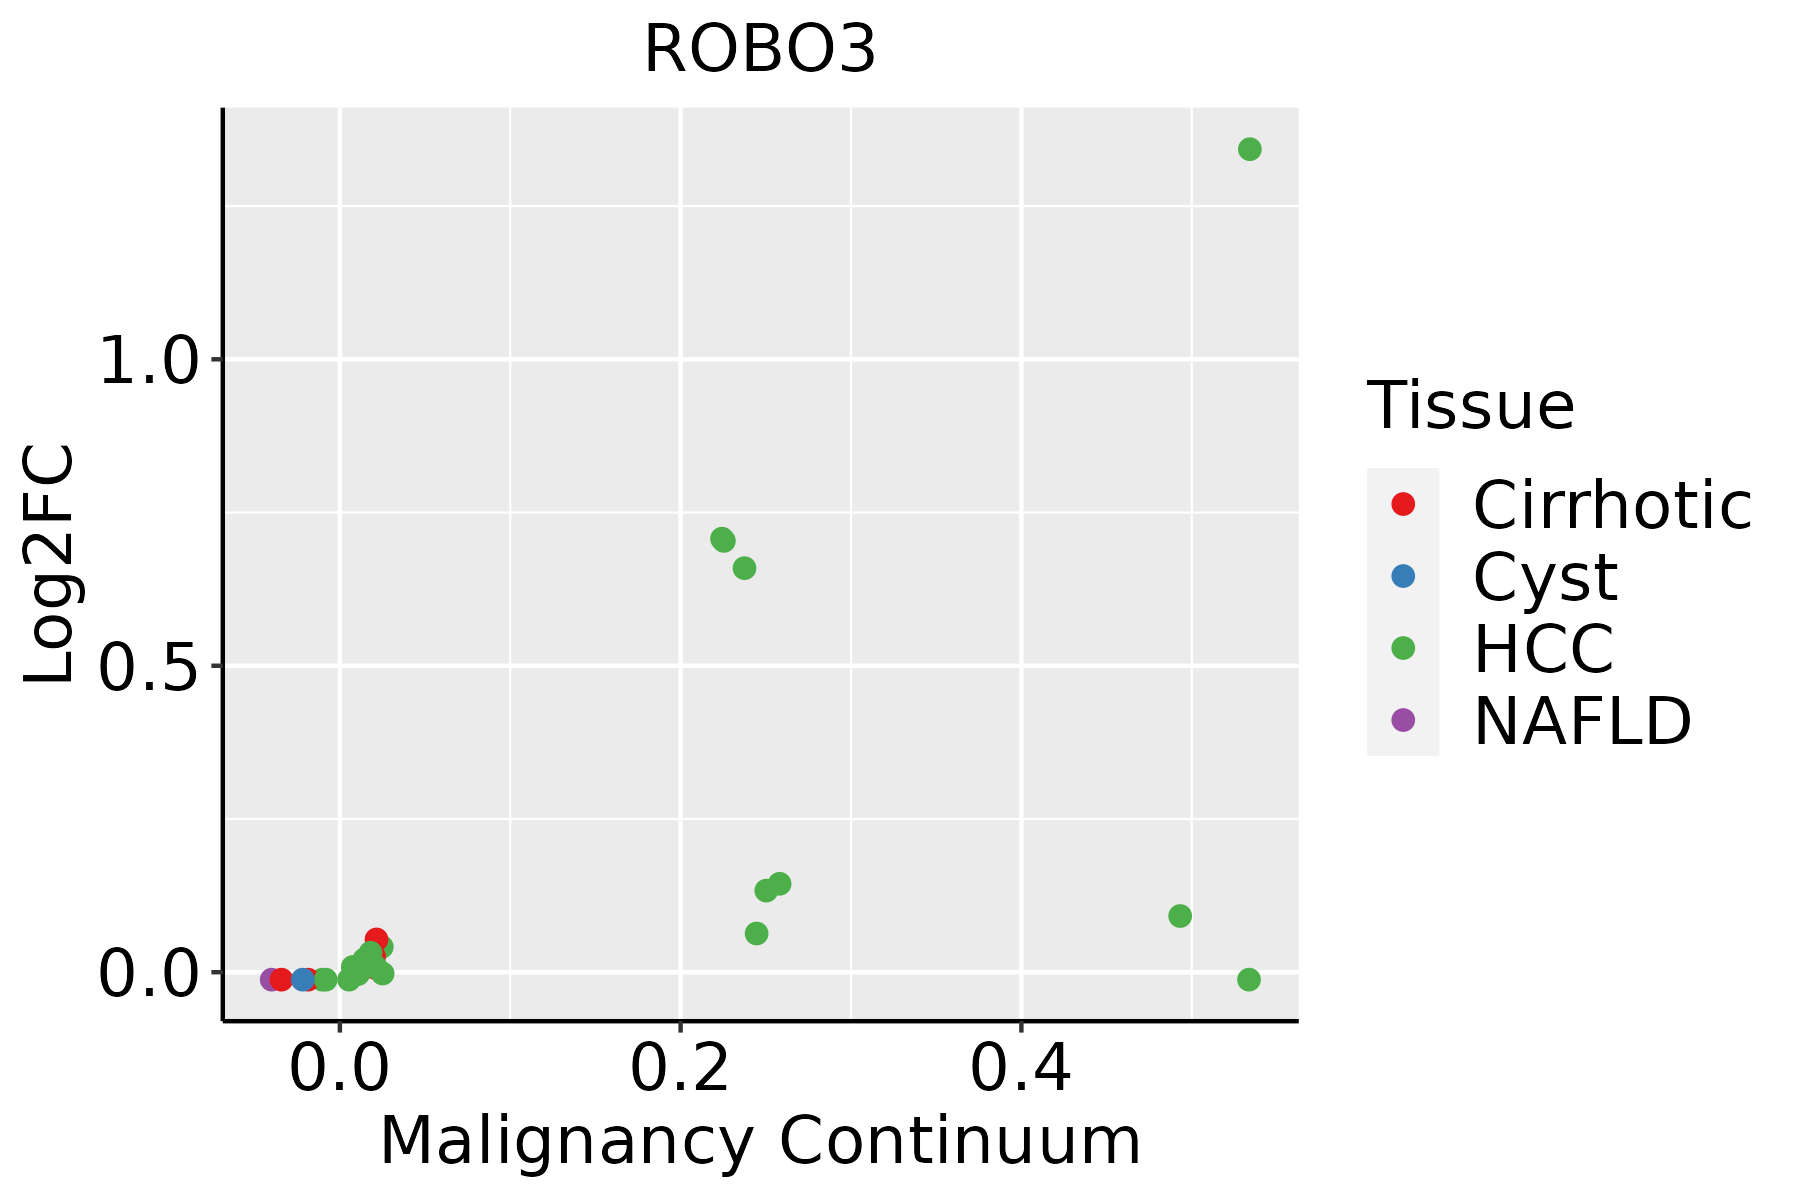 | HCC: Hepatocellular carcinoma |
| NAFLD: Non-alcoholic fatty liver disease | ||
| Thyroid |  | ATC: Anaplastic thyroid cancer |
| HT: Hashimoto's thyroiditis | ||
| PTC: Papillary thyroid cancer |
| ∗log2FC in expression of this searched gene in stem-like cells from each diseased tissue sample relative to stem-like cells in normal samples in each tissue plotted against the malignancy continuum. Samples are colored based on if they are from different disease stage. |
Top |
Malignant transformation related pathway analysis |
| Find out the enriched GO biological processes and KEGG pathways involved in transition from healthy to precancer to cancer |
| Tissue | Disease Stage | Enriched GO biological Processes |
| Colorectum | AD |  |
| Colorectum | SER |  |
| Colorectum | MSS |  |
| Colorectum | MSI-H |  |
| Colorectum | FAP |  |
| ∗Top 15 enriched GO BP terms are showed in the bar plot of each disease state in each tissue. Each row represents a significant GO biological process which is colored according to the -log10(p.adjust). |
| Page: 1 2 3 4 5 6 7 8 9 |
| GO ID | Tissue | Disease Stage | Description | Gene Ratio | Bg Ratio | pvalue | p.adjust | Count |
| GO:006156415 | Esophagus | ESCC | axon development | 251/8552 | 467/18723 | 2.41e-04 | 1.49e-03 | 251 |
| GO:000740915 | Esophagus | ESCC | axonogenesis | 219/8552 | 418/18723 | 3.14e-03 | 1.31e-02 | 219 |
| GO:006156423 | Thyroid | ATC | axon development | 220/6293 | 467/18723 | 6.85e-10 | 1.80e-08 | 220 |
| GO:000740919 | Thyroid | ATC | axonogenesis | 197/6293 | 418/18723 | 5.09e-09 | 1.13e-07 | 197 |
| GO:00074113 | Thyroid | ATC | axon guidance | 96/6293 | 227/18723 | 3.74e-03 | 1.63e-02 | 96 |
| GO:00974853 | Thyroid | ATC | neuron projection guidance | 96/6293 | 228/18723 | 4.36e-03 | 1.81e-02 | 96 |
| Page: 1 |
| Pathway ID | Tissue | Disease Stage | Description | Gene Ratio | Bg Ratio | pvalue | p.adjust | qvalue | Count |
| hsa0436016 | Esophagus | ESCC | Axon guidance | 108/4205 | 182/8465 | 5.13e-03 | 1.30e-02 | 6.67e-03 | 108 |
| hsa0436017 | Esophagus | ESCC | Axon guidance | 108/4205 | 182/8465 | 5.13e-03 | 1.30e-02 | 6.67e-03 | 108 |
| Page: 1 |
Top |
Cell-cell communication analysis |
| Identification of potential cell-cell interactions between two cell types and their ligand-receptor pairs for different disease states |
| Ligand | Receptor | LRpair | Pathway | Tissue | Disease Stage |
| Page: 1 |
Top |
Single-cell gene regulatory network inference analysis |
| Find out the significant the regulons (TFs) and the target genes of each regulon across cell types for different disease states |
| TF | Cell Type | Tissue | Disease Stage | Target Gene | RSS | Regulon Activity |
| ∗The dot plots of a searched regulon are shown for all cell subpopulations in each disease state of each tissue based on the regulon specific score inferred using pySCENIC and by calculating the average expression. |
| Page: 1 |
Top |
Somatic mutation of malignant transformation related genes |
| Annotation of somatic variants for genes involved in malignant transformation |
| Hugo Symbol | Variant Class | Variant Classification | dbSNP RS | HGVSc | HGVSp | HGVSp Short | SWISSPROT | BIOTYPE | SIFT | PolyPhen | Tumor Sample Barcode | Tissue | Histology | Sex | Age | Stage | Therapy Types | Drugs | Outcome |
| ROBO3 | SNV | Missense_Mutation | c.55N>G | p.Leu19Val | p.L19V | Q96MS0 | protein_coding | deleterious_low_confidence(0.02) | benign(0.164) | TCGA-A2-A0EQ-01 | Breast | breast invasive carcinoma | Female | <65 | I/II | Chemotherapy | adriamycin | SD | |
| ROBO3 | SNV | Missense_Mutation | novel | c.3247N>A | p.Glu1083Lys | p.E1083K | Q96MS0 | protein_coding | deleterious(0) | benign(0.257) | TCGA-A7-A4SE-01 | Breast | breast invasive carcinoma | Female | <65 | I/II | Chemotherapy | adriamycin | CR |
| ROBO3 | SNV | Missense_Mutation | rs750349831 | c.770N>A | p.Arg257His | p.R257H | Q96MS0 | protein_coding | deleterious(0) | probably_damaging(0.998) | TCGA-A8-A08O-01 | Breast | breast invasive carcinoma | Female | <65 | III/IV | Chemotherapy | docetaxel | PD |
| ROBO3 | SNV | Missense_Mutation | c.583G>C | p.Glu195Gln | p.E195Q | Q96MS0 | protein_coding | deleterious(0) | probably_damaging(0.999) | TCGA-AC-A23H-01 | Breast | breast invasive carcinoma | Female | >=65 | I/II | Unknown | Unknown | PD | |
| ROBO3 | SNV | Missense_Mutation | c.3413G>T | p.Arg1138Leu | p.R1138L | Q96MS0 | protein_coding | deleterious(0.01) | benign(0.029) | TCGA-AC-A5XS-01 | Breast | breast invasive carcinoma | Female | >=65 | I/II | Hormone Therapy | femara | SD | |
| ROBO3 | SNV | Missense_Mutation | novel | c.958G>C | p.Asp320His | p.D320H | Q96MS0 | protein_coding | deleterious(0.01) | probably_damaging(1) | TCGA-C8-A8HQ-01 | Breast | breast invasive carcinoma | Female | <65 | I/II | Unknown | Unknown | SD |
| ROBO3 | SNV | Missense_Mutation | c.3235N>G | p.Leu1079Val | p.L1079V | Q96MS0 | protein_coding | tolerated(0.09) | probably_damaging(0.978) | TCGA-D8-A1XQ-01 | Breast | breast invasive carcinoma | Female | >=65 | I/II | Unknown | Unknown | SD | |
| ROBO3 | SNV | Missense_Mutation | rs763940056 | c.3749N>A | p.Arg1250Gln | p.R1250Q | Q96MS0 | protein_coding | deleterious_low_confidence(0.01) | benign(0.015) | TCGA-D8-A1Y1-01 | Breast | breast invasive carcinoma | Female | >=65 | III/IV | Hormone Therapy | tamoxiphen | PD |
| ROBO3 | SNV | Missense_Mutation | rs768882181 | c.3394N>G | p.Cys1132Gly | p.C1132G | Q96MS0 | protein_coding | deleterious(0.01) | benign(0.026) | TCGA-E2-A14Q-01 | Breast | breast invasive carcinoma | Female | <65 | I/II | Hormone Therapy | tamoxiphen | SD |
| ROBO3 | SNV | Missense_Mutation | rs774489623 | c.1237N>A | p.Ala413Thr | p.A413T | Q96MS0 | protein_coding | tolerated(0.11) | benign(0.135) | TCGA-OL-A66K-01 | Breast | breast invasive carcinoma | Female | >=65 | I/II | Unknown | Unknown | SD |
| Page: 1 2 3 4 5 6 7 8 9 10 11 12 13 14 15 16 |
Top |
Related drugs of malignant transformation related genes |
| Identification of chemicals and drugs interact with genes involved in malignant transfromation |
| (DGIdb 4.0) |
| Entrez ID | Symbol | Category | Interaction Types | Drug Claim Name | Drug Name | PMIDs |
| Page: 1 |

Copyright 2023-Present -The University of Texas Health Science Center at Houston |