
|
|||||
|
 | |
| |
| |
| |
| |
| |
|
Gene: ROBO2 |
Gene summary for ROBO2 |
| Gene information | Species | Human | Gene symbol | ROBO2 | Gene ID | 6092 |
| Gene name | roundabout guidance receptor 2 | |
| Gene Alias | SAX3 | |
| Cytomap | 3p12.3 | |
| Gene Type | protein-coding | GO ID | GO:0000003 | UniProtAcc | Q9HCK4 |
Top |
Malignant transformation analysis |
| Identification of the aberrant gene expression in precancerous and cancerous lesions by comparing the gene expression of stem-like cells in diseased tissues with normal stem cells |
| Entrez ID | Symbol | Replicates | Species | Organ | Tissue | Adj P-value | Log2FC | Malignancy |
| 6092 | ROBO2 | HTA11_78_2000001011 | Human | Colorectum | AD | 2.52e-02 | 1.72e-01 | -0.1088 |
| 6092 | ROBO2 | HTA11_347_2000001011 | Human | Colorectum | AD | 1.16e-09 | 2.94e-01 | -0.1954 |
| 6092 | ROBO2 | HTA11_83_2000001011 | Human | Colorectum | SER | 5.94e-04 | 2.70e-01 | -0.1526 |
| 6092 | ROBO2 | HTA11_696_2000001011 | Human | Colorectum | AD | 1.46e-08 | 3.59e-01 | -0.1464 |
| 6092 | ROBO2 | HTA11_866_2000001011 | Human | Colorectum | AD | 9.34e-03 | 1.62e-01 | -0.1001 |
| 6092 | ROBO2 | HTA11_1391_2000001011 | Human | Colorectum | AD | 3.77e-15 | 5.17e-01 | -0.059 |
| 6092 | ROBO2 | HTA11_7663_2000001011 | Human | Colorectum | SER | 2.01e-02 | 2.57e-01 | 0.0131 |
| 6092 | ROBO2 | HTA11_6818_2000001011 | Human | Colorectum | AD | 8.53e-04 | 3.51e-01 | 0.0112 |
| 6092 | ROBO2 | HTA11_6818_2000001021 | Human | Colorectum | AD | 4.33e-02 | 1.92e-01 | 0.0588 |
| 6092 | ROBO2 | HTA11_99999965104_69814 | Human | Colorectum | MSS | 6.71e-27 | 9.48e-01 | 0.281 |
| 6092 | ROBO2 | CRC-1-8810 | Human | Colorectum | CRC | 8.73e-11 | 4.98e-01 | 0.6257 |
| 6092 | ROBO2 | AEH-subject1 | Human | Endometrium | AEH | 4.15e-36 | 8.52e-01 | -0.3059 |
| 6092 | ROBO2 | AEH-subject2 | Human | Endometrium | AEH | 6.51e-11 | 4.11e-01 | -0.2525 |
| 6092 | ROBO2 | AEH-subject3 | Human | Endometrium | AEH | 3.03e-24 | 6.64e-01 | -0.2576 |
| 6092 | ROBO2 | AEH-subject4 | Human | Endometrium | AEH | 2.01e-35 | 8.91e-01 | -0.2657 |
| 6092 | ROBO2 | AEH-subject5 | Human | Endometrium | AEH | 1.49e-32 | 9.33e-01 | -0.2953 |
| 6092 | ROBO2 | EEC-subject1 | Human | Endometrium | EEC | 2.86e-09 | 4.33e-01 | -0.2682 |
| 6092 | ROBO2 | EEC-subject2 | Human | Endometrium | EEC | 1.40e-22 | 6.09e-01 | -0.2607 |
| 6092 | ROBO2 | EEC-subject4 | Human | Endometrium | EEC | 5.44e-15 | 6.18e-01 | -0.2571 |
| 6092 | ROBO2 | EEC-subject5 | Human | Endometrium | EEC | 9.67e-35 | 9.43e-01 | -0.249 |
| Page: 1 2 |
| Tissue | Expression Dynamics | Abbreviation |
| Colorectum (GSE201348) |  | FAP: Familial adenomatous polyposis |
| CRC: Colorectal cancer | ||
| Colorectum (HTA11) |  | AD: Adenomas |
| SER: Sessile serrated lesions | ||
| MSI-H: Microsatellite-high colorectal cancer | ||
| MSS: Microsatellite stable colorectal cancer | ||
| Endometrium | 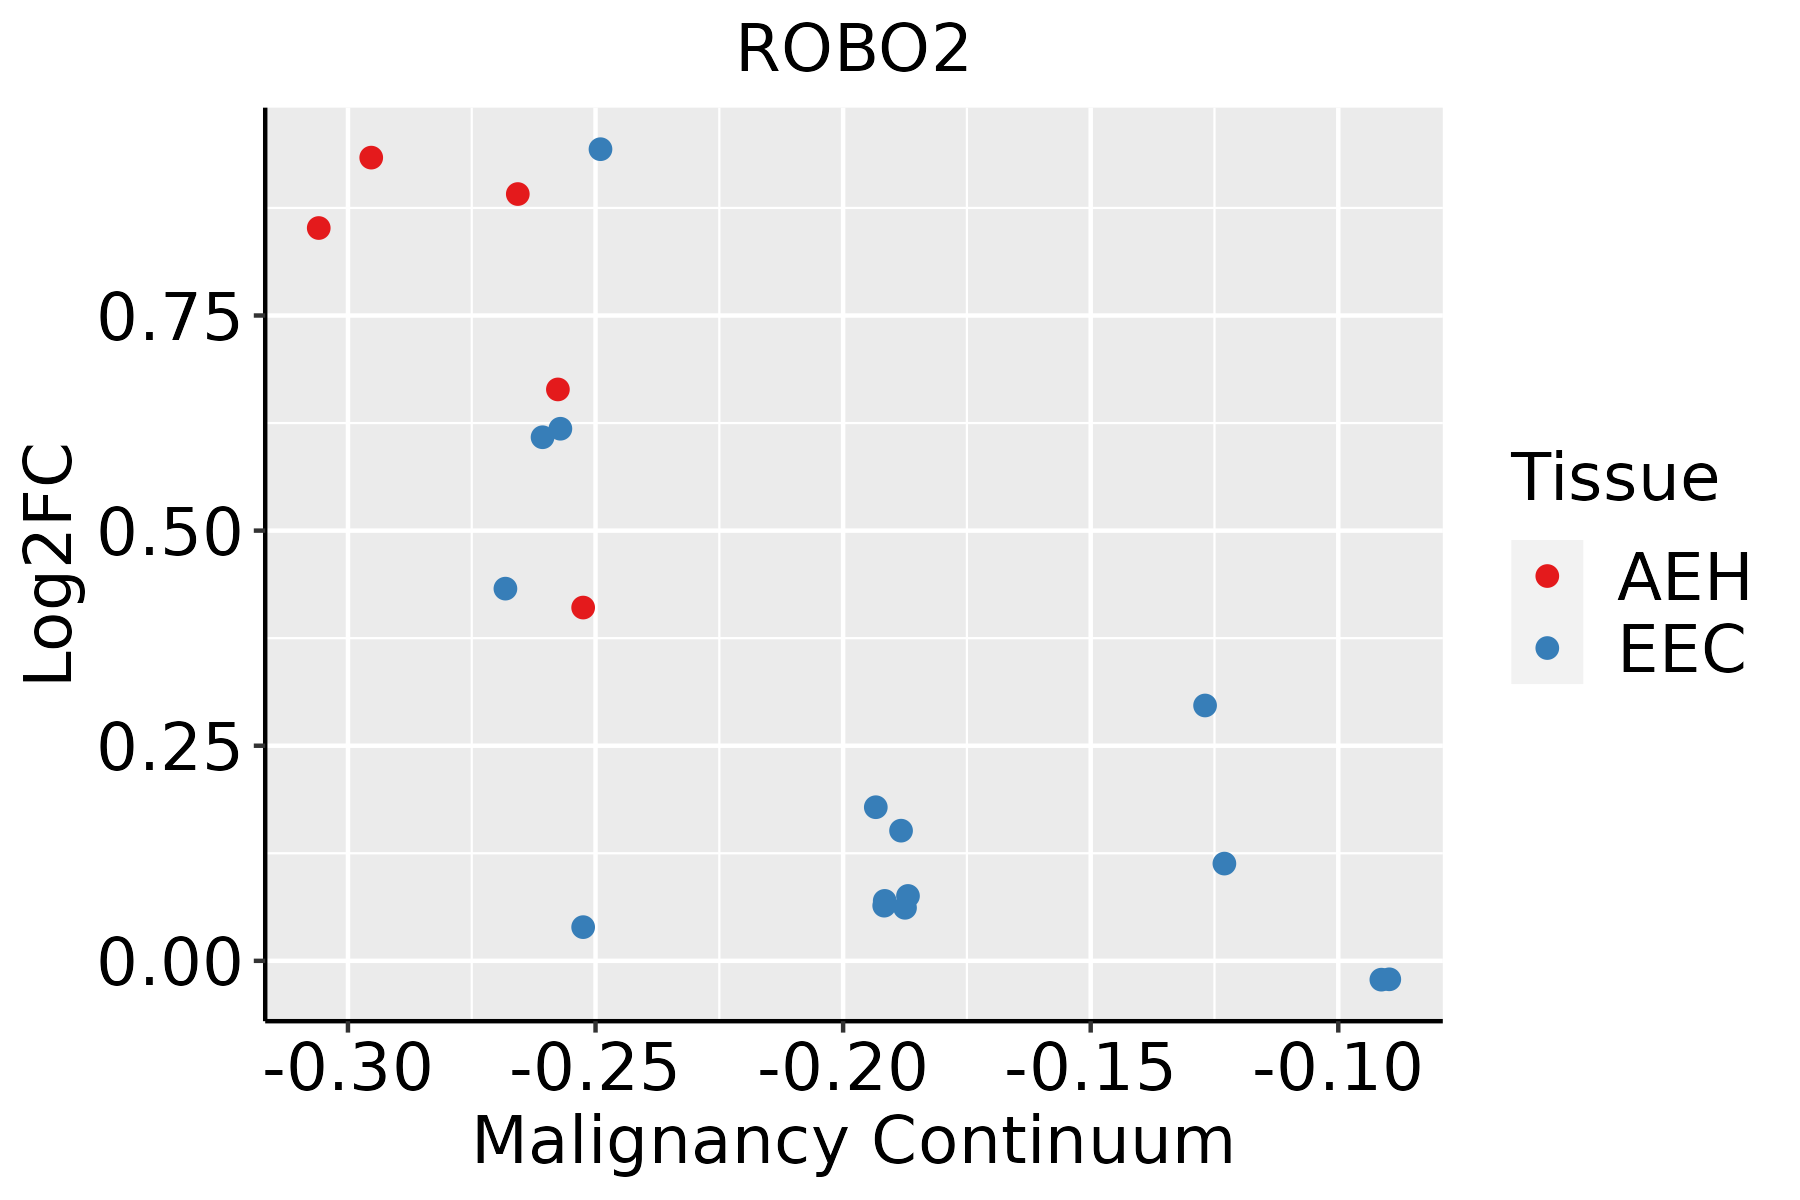 | AEH: Atypical endometrial hyperplasia |
| EEC: Endometrioid Cancer | ||
| Lung | 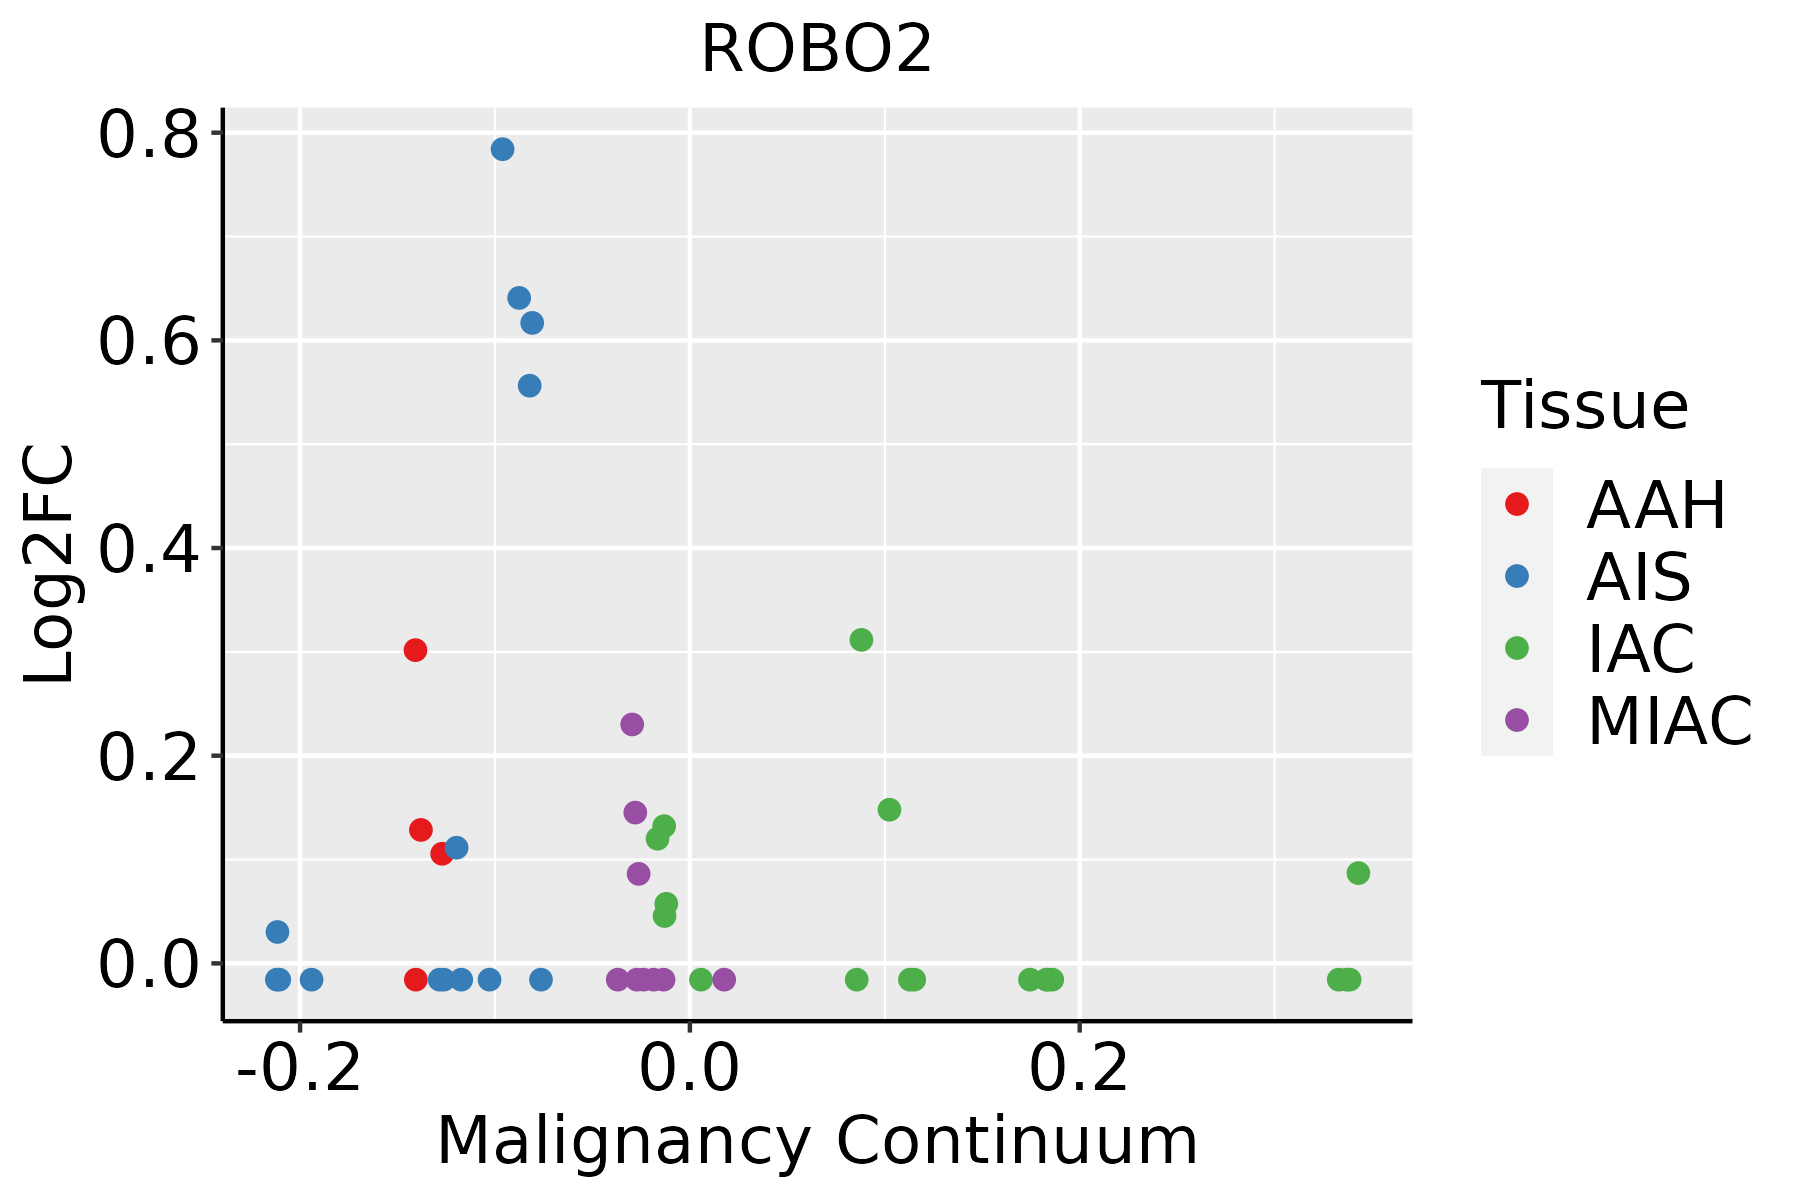 | AAH: Atypical adenomatous hyperplasia |
| AIS: Adenocarcinoma in situ | ||
| IAC: Invasive lung adenocarcinoma | ||
| MIA: Minimally invasive adenocarcinoma | ||
| Skin |  | AK: Actinic keratosis |
| cSCC: Cutaneous squamous cell carcinoma | ||
| SCCIS:squamous cell carcinoma in situ |
| ∗log2FC in expression of this searched gene in stem-like cells from each diseased tissue sample relative to stem-like cells in normal samples in each tissue plotted against the malignancy continuum. Samples are colored based on if they are from different disease stage. |
Top |
Malignant transformation related pathway analysis |
| Find out the enriched GO biological processes and KEGG pathways involved in transition from healthy to precancer to cancer |
| Tissue | Disease Stage | Enriched GO biological Processes |
| Colorectum | AD |  |
| Colorectum | SER |  |
| Colorectum | MSS |  |
| Colorectum | MSI-H |  |
| Colorectum | FAP |  |
| ∗Top 15 enriched GO BP terms are showed in the bar plot of each disease state in each tissue. Each row represents a significant GO biological process which is colored according to the -log10(p.adjust). |
| Page: 1 2 3 4 5 6 7 8 9 |
| GO ID | Tissue | Disease Stage | Description | Gene Ratio | Bg Ratio | pvalue | p.adjust | Count |
| GO:0034329 | Colorectum | AD | cell junction assembly | 136/3918 | 420/18723 | 2.02e-08 | 1.15e-06 | 136 |
| GO:0048511 | Colorectum | AD | rhythmic process | 94/3918 | 298/18723 | 1.00e-05 | 2.34e-04 | 94 |
| GO:0010975 | Colorectum | AD | regulation of neuron projection development | 129/3918 | 445/18723 | 2.88e-05 | 5.37e-04 | 129 |
| GO:0007409 | Colorectum | AD | axonogenesis | 122/3918 | 418/18723 | 3.36e-05 | 6.15e-04 | 122 |
| GO:0031346 | Colorectum | AD | positive regulation of cell projection organization | 104/3918 | 353/18723 | 8.26e-05 | 1.30e-03 | 104 |
| GO:0061564 | Colorectum | AD | axon development | 132/3918 | 467/18723 | 8.40e-05 | 1.31e-03 | 132 |
| GO:0010720 | Colorectum | AD | positive regulation of cell development | 87/3918 | 298/18723 | 4.17e-04 | 4.71e-03 | 87 |
| GO:0050770 | Colorectum | AD | regulation of axonogenesis | 49/3918 | 154/18723 | 9.88e-04 | 9.28e-03 | 49 |
| GO:0061458 | Colorectum | AD | reproductive system development | 116/3918 | 427/18723 | 1.11e-03 | 1.01e-02 | 116 |
| GO:1901888 | Colorectum | AD | regulation of cell junction assembly | 61/3918 | 204/18723 | 1.50e-03 | 1.27e-02 | 61 |
| GO:0048608 | Colorectum | AD | reproductive structure development | 114/3918 | 424/18723 | 1.78e-03 | 1.47e-02 | 114 |
| GO:0050767 | Colorectum | AD | regulation of neurogenesis | 99/3918 | 364/18723 | 2.35e-03 | 1.82e-02 | 99 |
| GO:0072073 | Colorectum | AD | kidney epithelium development | 42/3918 | 136/18723 | 4.02e-03 | 2.80e-02 | 42 |
| GO:0050808 | Colorectum | AD | synapse organization | 112/3918 | 426/18723 | 4.25e-03 | 2.92e-02 | 112 |
| GO:0050772 | Colorectum | AD | positive regulation of axonogenesis | 27/3918 | 79/18723 | 4.30e-03 | 2.95e-02 | 27 |
| GO:0007411 | Colorectum | AD | axon guidance | 64/3918 | 227/18723 | 5.41e-03 | 3.55e-02 | 64 |
| GO:0050807 | Colorectum | AD | regulation of synapse organization | 60/3918 | 211/18723 | 5.67e-03 | 3.64e-02 | 60 |
| GO:0097485 | Colorectum | AD | neuron projection guidance | 64/3918 | 228/18723 | 6.02e-03 | 3.78e-02 | 64 |
| GO:0007219 | Colorectum | AD | Notch signaling pathway | 50/3918 | 172/18723 | 6.92e-03 | 4.26e-02 | 50 |
| GO:00343291 | Colorectum | SER | cell junction assembly | 100/2897 | 420/18723 | 4.23e-06 | 1.61e-04 | 100 |
| Page: 1 2 3 4 5 6 7 8 9 10 11 12 13 |
| Pathway ID | Tissue | Disease Stage | Description | Gene Ratio | Bg Ratio | pvalue | p.adjust | qvalue | Count |
| hsa04360 | Colorectum | AD | Axon guidance | 61/2092 | 182/8465 | 4.36e-03 | 2.17e-02 | 1.38e-02 | 61 |
| hsa043601 | Colorectum | AD | Axon guidance | 61/2092 | 182/8465 | 4.36e-03 | 2.17e-02 | 1.38e-02 | 61 |
| hsa043602 | Colorectum | MSS | Axon guidance | 54/1875 | 182/8465 | 1.03e-02 | 3.69e-02 | 2.26e-02 | 54 |
| hsa043603 | Colorectum | MSS | Axon guidance | 54/1875 | 182/8465 | 1.03e-02 | 3.69e-02 | 2.26e-02 | 54 |
| hsa043606 | Colorectum | CRC | Axon guidance | 43/1091 | 182/8465 | 4.38e-05 | 8.70e-04 | 5.90e-04 | 43 |
| hsa043607 | Colorectum | CRC | Axon guidance | 43/1091 | 182/8465 | 4.38e-05 | 8.70e-04 | 5.90e-04 | 43 |
| hsa0436010 | Endometrium | AEH | Axon guidance | 39/1197 | 182/8465 | 4.47e-03 | 2.46e-02 | 1.80e-02 | 39 |
| hsa0436013 | Endometrium | AEH | Axon guidance | 39/1197 | 182/8465 | 4.47e-03 | 2.46e-02 | 1.80e-02 | 39 |
| hsa0436022 | Endometrium | EEC | Axon guidance | 39/1237 | 182/8465 | 7.78e-03 | 3.66e-02 | 2.73e-02 | 39 |
| hsa0436032 | Endometrium | EEC | Axon guidance | 39/1237 | 182/8465 | 7.78e-03 | 3.66e-02 | 2.73e-02 | 39 |
| hsa0436021 | Lung | AIS | Axon guidance | 34/961 | 182/8465 | 2.22e-03 | 1.37e-02 | 8.80e-03 | 34 |
| hsa0436031 | Lung | AIS | Axon guidance | 34/961 | 182/8465 | 2.22e-03 | 1.37e-02 | 8.80e-03 | 34 |
| Page: 1 |
Top |
Cell-cell communication analysis |
| Identification of potential cell-cell interactions between two cell types and their ligand-receptor pairs for different disease states |
| Ligand | Receptor | LRpair | Pathway | Tissue | Disease Stage |
| Page: 1 |
Top |
Single-cell gene regulatory network inference analysis |
| Find out the significant the regulons (TFs) and the target genes of each regulon across cell types for different disease states |
| TF | Cell Type | Tissue | Disease Stage | Target Gene | RSS | Regulon Activity |
| ∗The dot plots of a searched regulon are shown for all cell subpopulations in each disease state of each tissue based on the regulon specific score inferred using pySCENIC and by calculating the average expression. |
| Page: 1 |
Top |
Somatic mutation of malignant transformation related genes |
| Annotation of somatic variants for genes involved in malignant transformation |
| Hugo Symbol | Variant Class | Variant Classification | dbSNP RS | HGVSc | HGVSp | HGVSp Short | SWISSPROT | BIOTYPE | SIFT | PolyPhen | Tumor Sample Barcode | Tissue | Histology | Sex | Age | Stage | Therapy Types | Drugs | Outcome |
| ROBO2 | SNV | Missense_Mutation | c.3113N>T | p.Ser1038Ile | p.S1038I | Q9HCK4 | protein_coding | tolerated(0.12) | benign(0.205) | TCGA-A2-A04P-01 | Breast | breast invasive carcinoma | Female | <65 | III/IV | Chemotherapy | taxol | PD | |
| ROBO2 | SNV | Missense_Mutation | novel | c.1760N>C | p.Val587Ala | p.V587A | Q9HCK4 | protein_coding | deleterious(0.01) | possibly_damaging(0.558) | TCGA-A2-A0T0-01 | Breast | breast invasive carcinoma | Female | <65 | I/II | Chemotherapy | taxotere | SD |
| ROBO2 | SNV | Missense_Mutation | rs771948864 | c.1490N>T | p.Ser497Phe | p.S497F | Q9HCK4 | protein_coding | deleterious(0.04) | possibly_damaging(0.866) | TCGA-A7-A26J-01 | Breast | breast invasive carcinoma | Female | <65 | I/II | Hormone Therapy | tamoxiphen | SD |
| ROBO2 | SNV | Missense_Mutation | rs748277216 | c.980N>A | p.Arg327Gln | p.R327Q | Q9HCK4 | protein_coding | tolerated(0.15) | possibly_damaging(0.837) | TCGA-AN-A046-01 | Breast | breast invasive carcinoma | Female | >=65 | I/II | Unknown | Unknown | SD |
| ROBO2 | SNV | Missense_Mutation | novel | c.1745N>G | p.Asn582Ser | p.N582S | Q9HCK4 | protein_coding | tolerated(0.89) | benign(0.007) | TCGA-AN-A046-01 | Breast | breast invasive carcinoma | Female | >=65 | I/II | Unknown | Unknown | SD |
| ROBO2 | SNV | Missense_Mutation | rs764613049 | c.3839G>A | p.Arg1280Gln | p.R1280Q | Q9HCK4 | protein_coding | tolerated(0.08) | benign(0.023) | TCGA-AN-A0AM-01 | Breast | breast invasive carcinoma | Female | <65 | I/II | Unknown | Unknown | SD |
| ROBO2 | SNV | Missense_Mutation | novel | c.2792N>G | p.Asn931Ser | p.N931S | Q9HCK4 | protein_coding | tolerated(0.31) | benign(0.021) | TCGA-AN-A0FL-01 | Breast | breast invasive carcinoma | Female | <65 | I/II | Unknown | Unknown | SD |
| ROBO2 | SNV | Missense_Mutation | c.1470N>C | p.Gln490His | p.Q490H | Q9HCK4 | protein_coding | tolerated(0.18) | possibly_damaging(0.516) | TCGA-D8-A1JA-01 | Breast | breast invasive carcinoma | Female | <65 | III/IV | Chemotherapy | adriamycin | PD | |
| ROBO2 | SNV | Missense_Mutation | c.2217T>G | p.Asp739Glu | p.D739E | Q9HCK4 | protein_coding | tolerated(0.22) | probably_damaging(0.993) | TCGA-E2-A15G-01 | Breast | breast invasive carcinoma | Female | >=65 | I/II | Hormone Therapy | arimidex | SD | |
| ROBO2 | SNV | Missense_Mutation | c.1869N>A | p.Ser623Arg | p.S623R | Q9HCK4 | protein_coding | deleterious(0) | probably_damaging(1) | TCGA-E2-A1LS-01 | Breast | breast invasive carcinoma | Female | <65 | I/II | Unspecific | Cyclophosphamide | SD |
| Page: 1 2 3 4 5 6 7 8 9 10 11 12 13 14 15 16 17 18 19 20 21 22 23 24 25 26 27 28 29 30 31 |
Top |
Related drugs of malignant transformation related genes |
| Identification of chemicals and drugs interact with genes involved in malignant transfromation |
| (DGIdb 4.0) |
| Entrez ID | Symbol | Category | Interaction Types | Drug Claim Name | Drug Name | PMIDs |
| Page: 1 |

Copyright 2023-Present -The University of Texas Health Science Center at Houston |