
|
|||||
|
 | |
| |
| |
| |
| |
| |
|
Gene: ROBO1 |
Gene summary for ROBO1 |
| Gene information | Species | Human | Gene symbol | ROBO1 | Gene ID | 6091 |
| Gene name | roundabout guidance receptor 1 | |
| Gene Alias | DUTT1 | |
| Cytomap | 3p12.3 | |
| Gene Type | protein-coding | GO ID | GO:0000165 | UniProtAcc | Q9Y6N7 |
Top |
Malignant transformation analysis |
| Identification of the aberrant gene expression in precancerous and cancerous lesions by comparing the gene expression of stem-like cells in diseased tissues with normal stem cells |
| Entrez ID | Symbol | Replicates | Species | Organ | Tissue | Adj P-value | Log2FC | Malignancy |
| 6091 | ROBO1 | CA_HPV_3 | Human | Cervix | CC | 1.01e-03 | 5.44e-02 | 0.0414 |
| 6091 | ROBO1 | CCI_1 | Human | Cervix | CC | 2.67e-08 | 1.62e+00 | 0.528 |
| 6091 | ROBO1 | CCI_2 | Human | Cervix | CC | 3.41e-02 | 7.07e-01 | 0.5249 |
| 6091 | ROBO1 | CCI_3 | Human | Cervix | CC | 1.20e-19 | 1.62e+00 | 0.516 |
| 6091 | ROBO1 | LZE8T | Human | Esophagus | ESCC | 1.62e-09 | 4.10e-01 | 0.067 |
| 6091 | ROBO1 | LZE24T | Human | Esophagus | ESCC | 1.83e-05 | 2.10e-01 | 0.0596 |
| 6091 | ROBO1 | P1T-E | Human | Esophagus | ESCC | 3.72e-02 | 7.70e-02 | 0.0875 |
| 6091 | ROBO1 | P2T-E | Human | Esophagus | ESCC | 7.94e-36 | 6.45e-01 | 0.1177 |
| 6091 | ROBO1 | P4T-E | Human | Esophagus | ESCC | 1.71e-15 | 4.09e-01 | 0.1323 |
| 6091 | ROBO1 | P10T-E | Human | Esophagus | ESCC | 4.93e-13 | 2.07e-01 | 0.116 |
| 6091 | ROBO1 | P11T-E | Human | Esophagus | ESCC | 2.93e-07 | 3.78e-01 | 0.1426 |
| 6091 | ROBO1 | P12T-E | Human | Esophagus | ESCC | 5.84e-08 | 1.45e-01 | 0.1122 |
| 6091 | ROBO1 | P16T-E | Human | Esophagus | ESCC | 2.64e-08 | 6.01e-02 | 0.1153 |
| 6091 | ROBO1 | P20T-E | Human | Esophagus | ESCC | 1.26e-33 | 7.99e-01 | 0.1124 |
| 6091 | ROBO1 | P22T-E | Human | Esophagus | ESCC | 5.81e-04 | 1.26e-03 | 0.1236 |
| 6091 | ROBO1 | P23T-E | Human | Esophagus | ESCC | 9.08e-22 | 5.95e-01 | 0.108 |
| 6091 | ROBO1 | P24T-E | Human | Esophagus | ESCC | 9.29e-09 | 1.88e-01 | 0.1287 |
| 6091 | ROBO1 | P26T-E | Human | Esophagus | ESCC | 1.55e-12 | 3.99e-01 | 0.1276 |
| 6091 | ROBO1 | P27T-E | Human | Esophagus | ESCC | 8.59e-21 | 4.56e-01 | 0.1055 |
| 6091 | ROBO1 | P30T-E | Human | Esophagus | ESCC | 2.58e-03 | 1.93e-01 | 0.137 |
| Page: 1 2 3 4 5 |
| Tissue | Expression Dynamics | Abbreviation |
| Cervix | 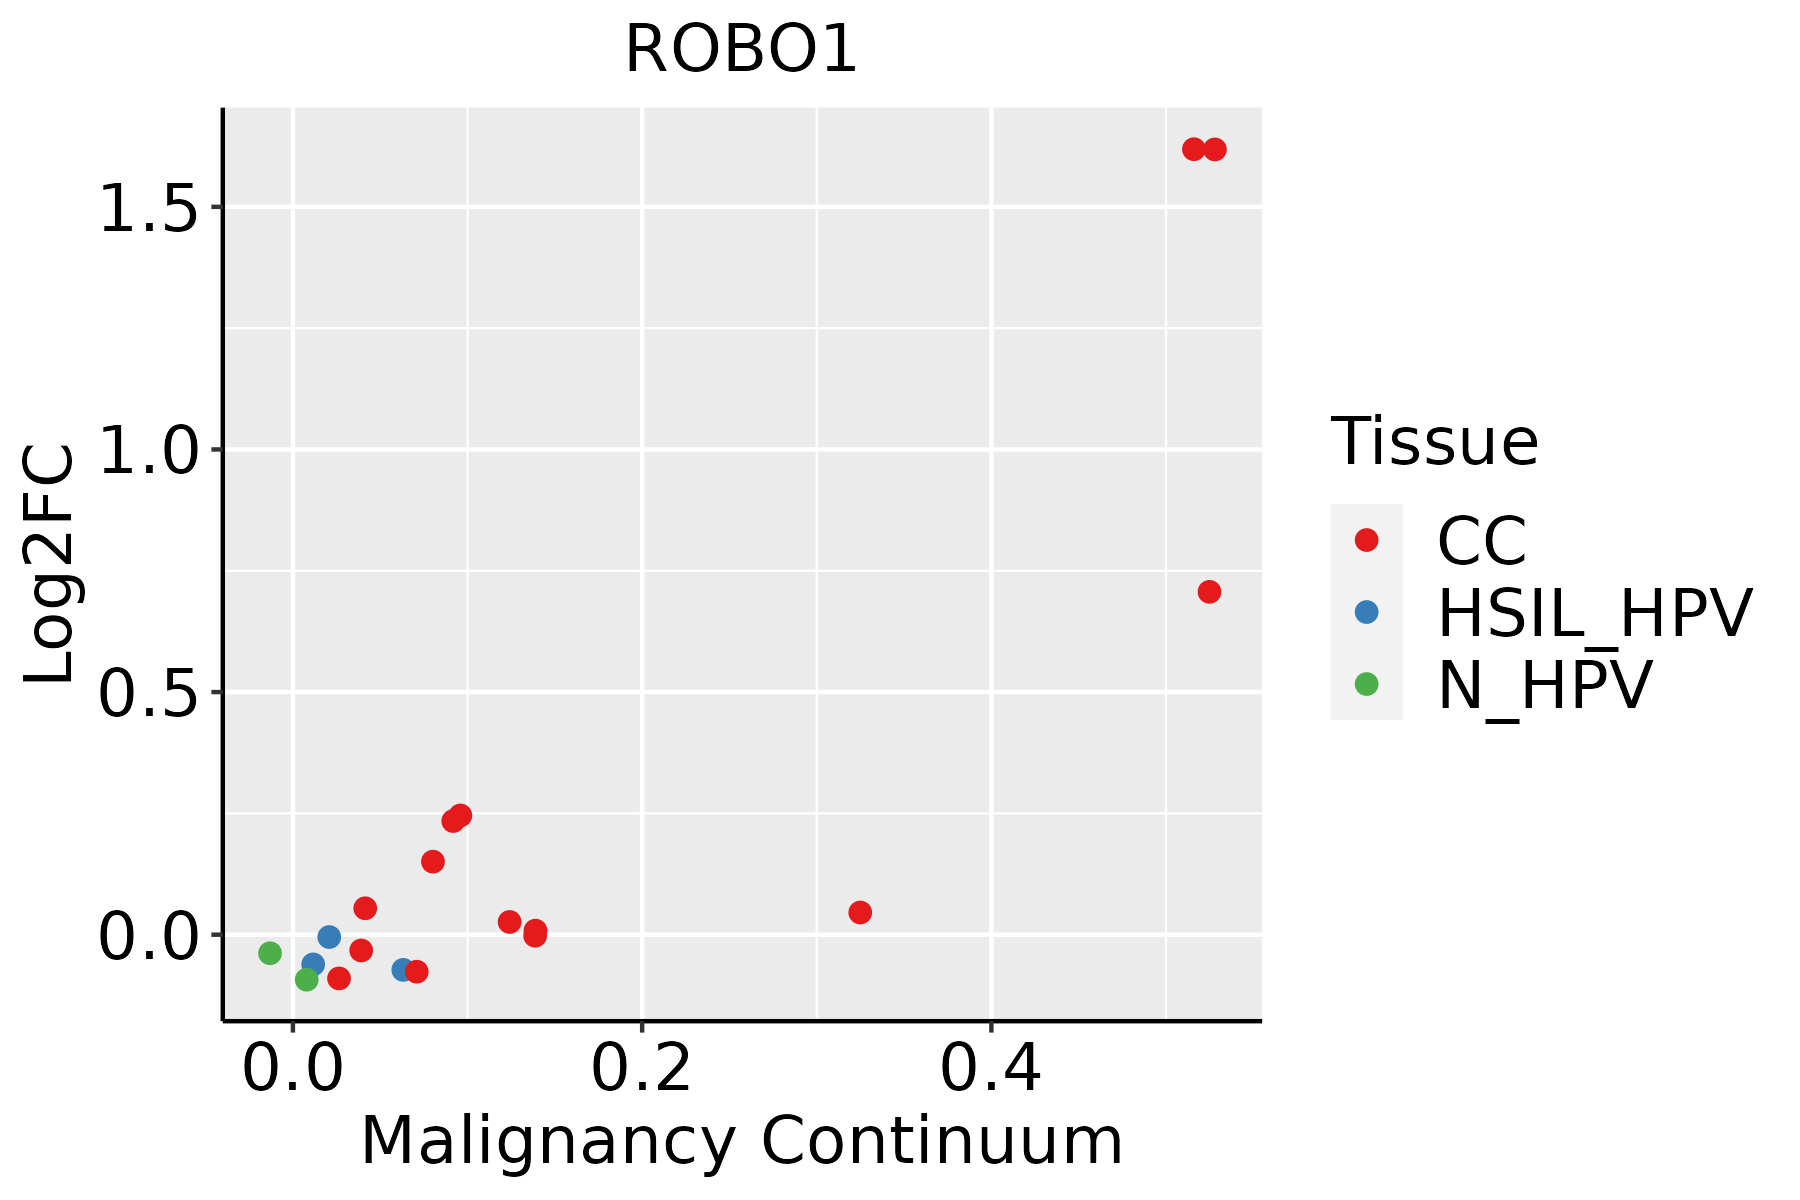 | CC: Cervix cancer |
| HSIL_HPV: HPV-infected high-grade squamous intraepithelial lesions | ||
| N_HPV: HPV-infected normal cervix | ||
| Esophagus | 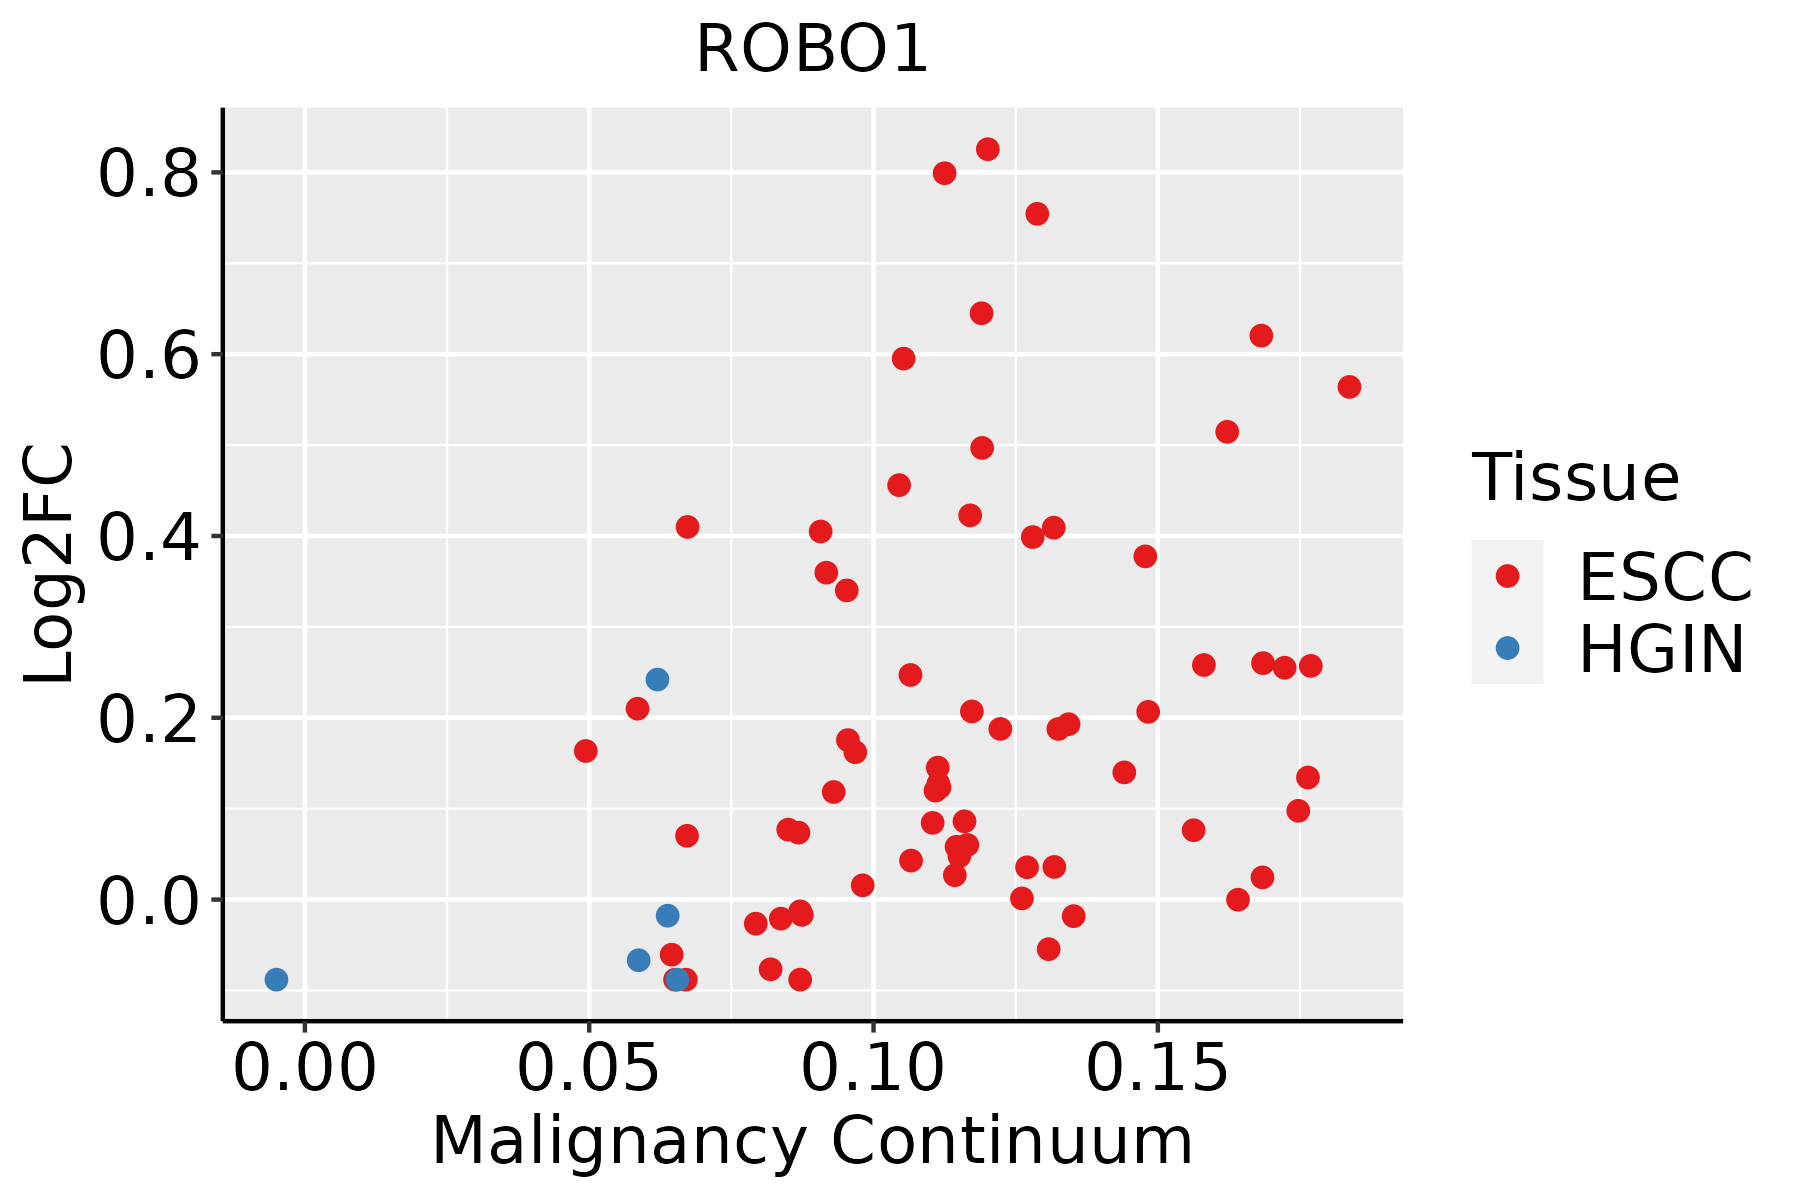 | ESCC: Esophageal squamous cell carcinoma |
| HGIN: High-grade intraepithelial neoplasias | ||
| LGIN: Low-grade intraepithelial neoplasias | ||
| Liver | 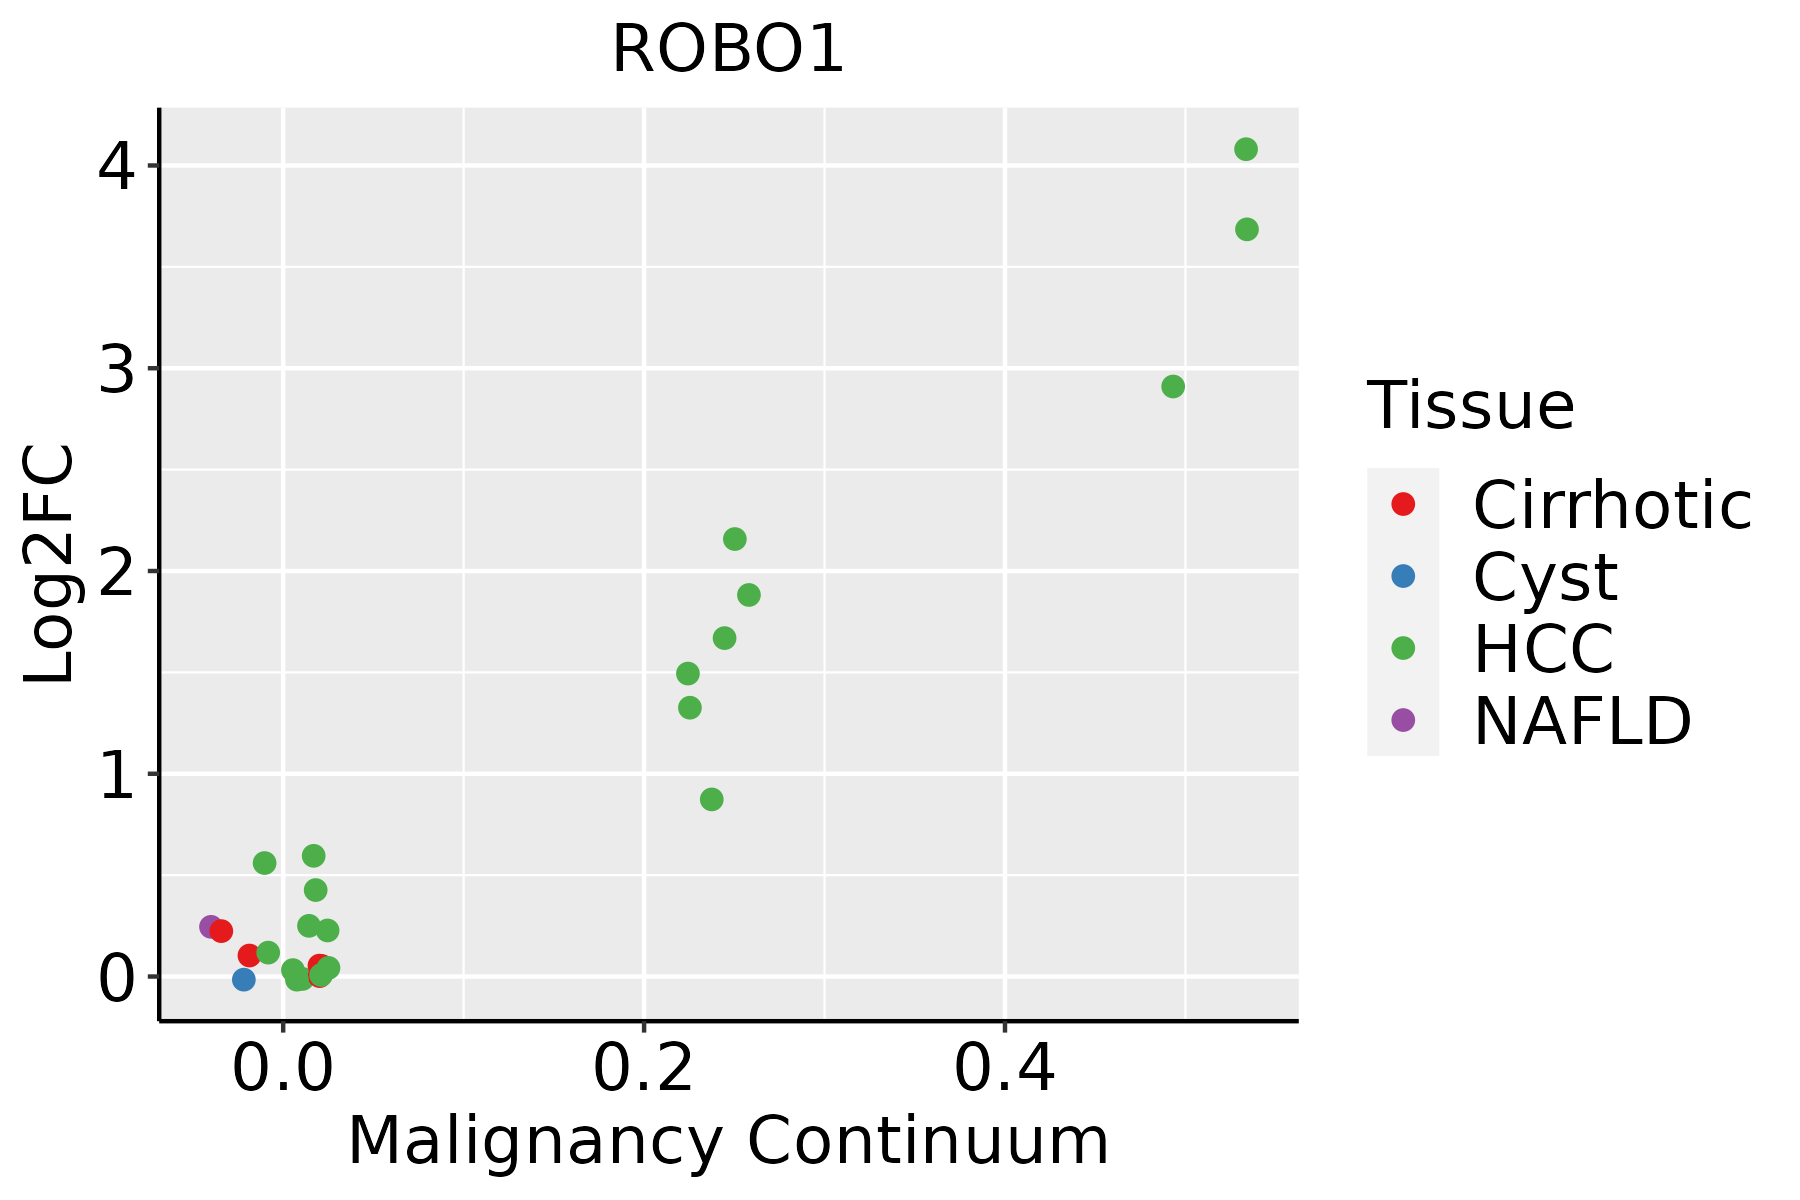 | HCC: Hepatocellular carcinoma |
| NAFLD: Non-alcoholic fatty liver disease | ||
| Oral Cavity | 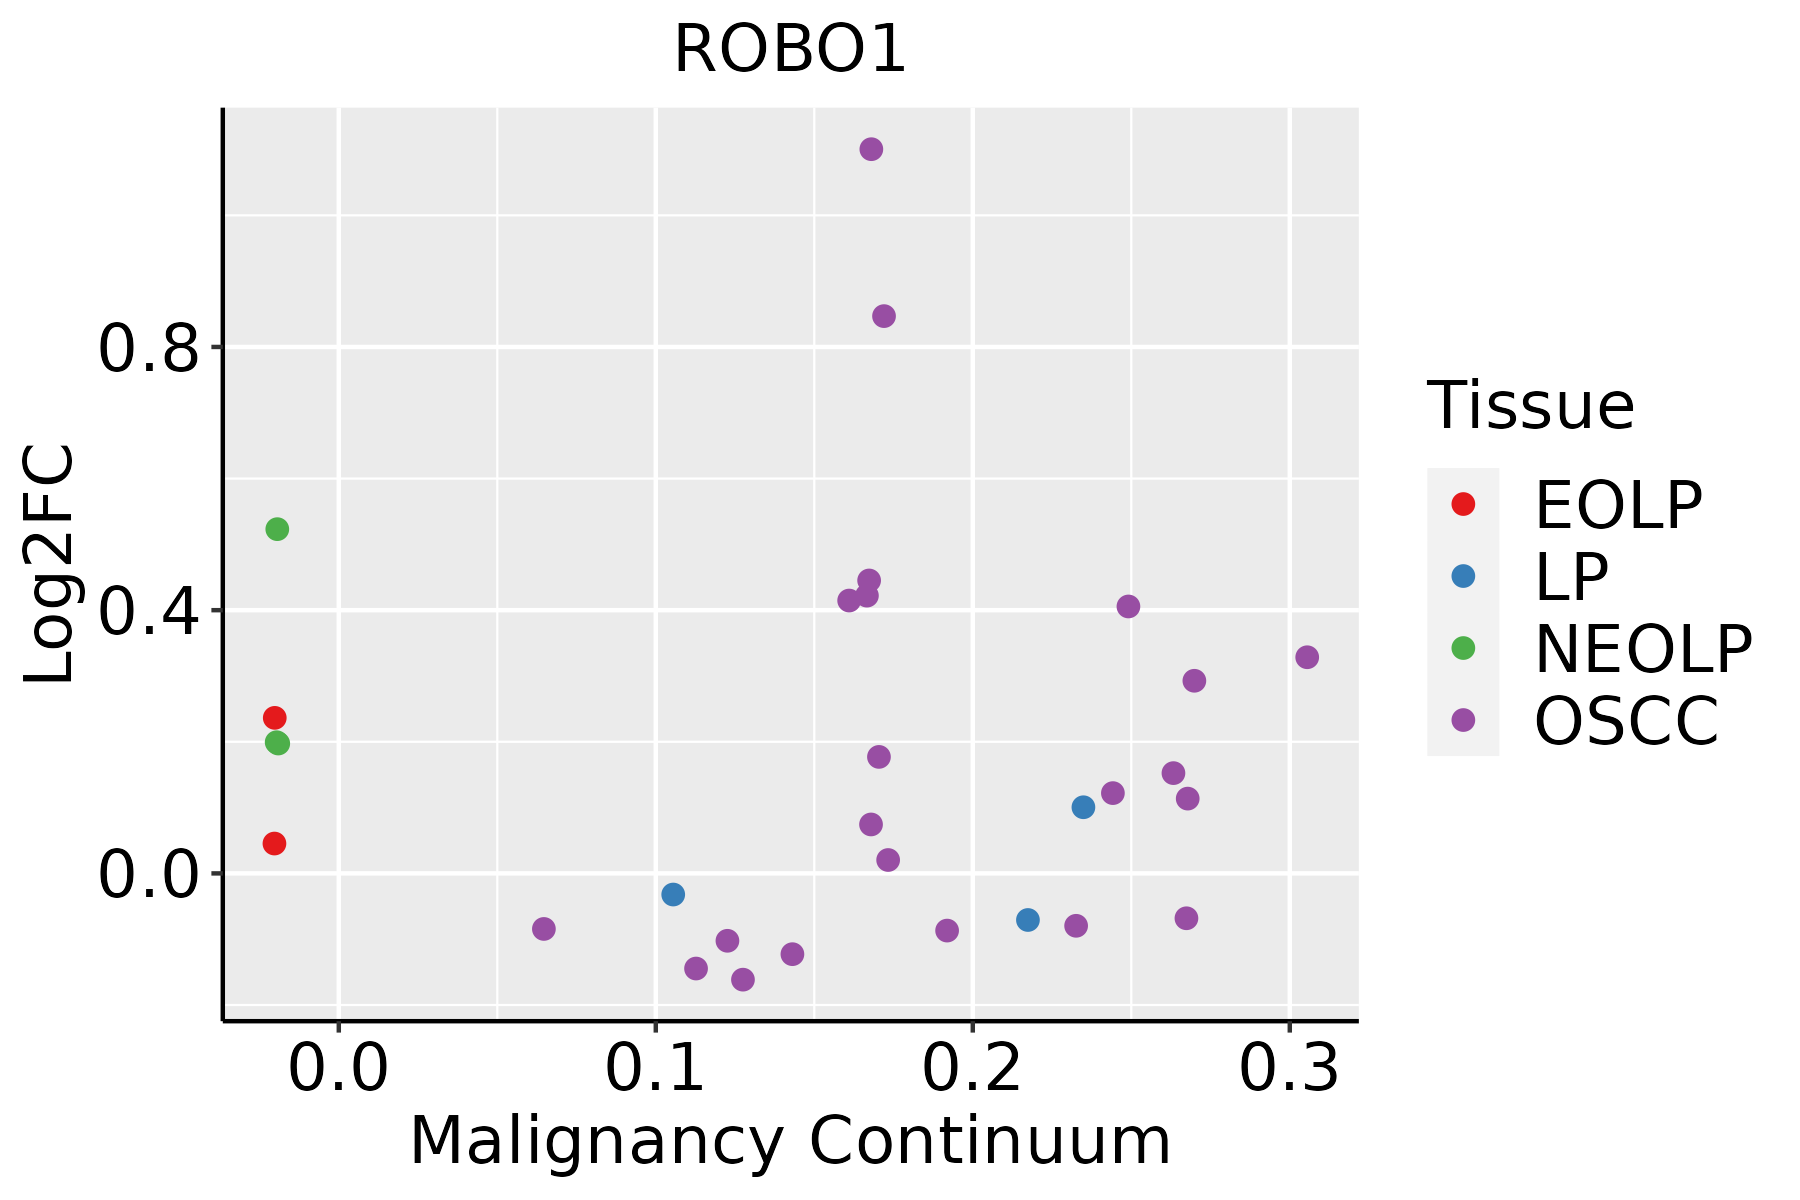 | EOLP: Erosive Oral lichen planus |
| LP: leukoplakia | ||
| NEOLP: Non-erosive oral lichen planus | ||
| OSCC: Oral squamous cell carcinoma | ||
| Prostate | 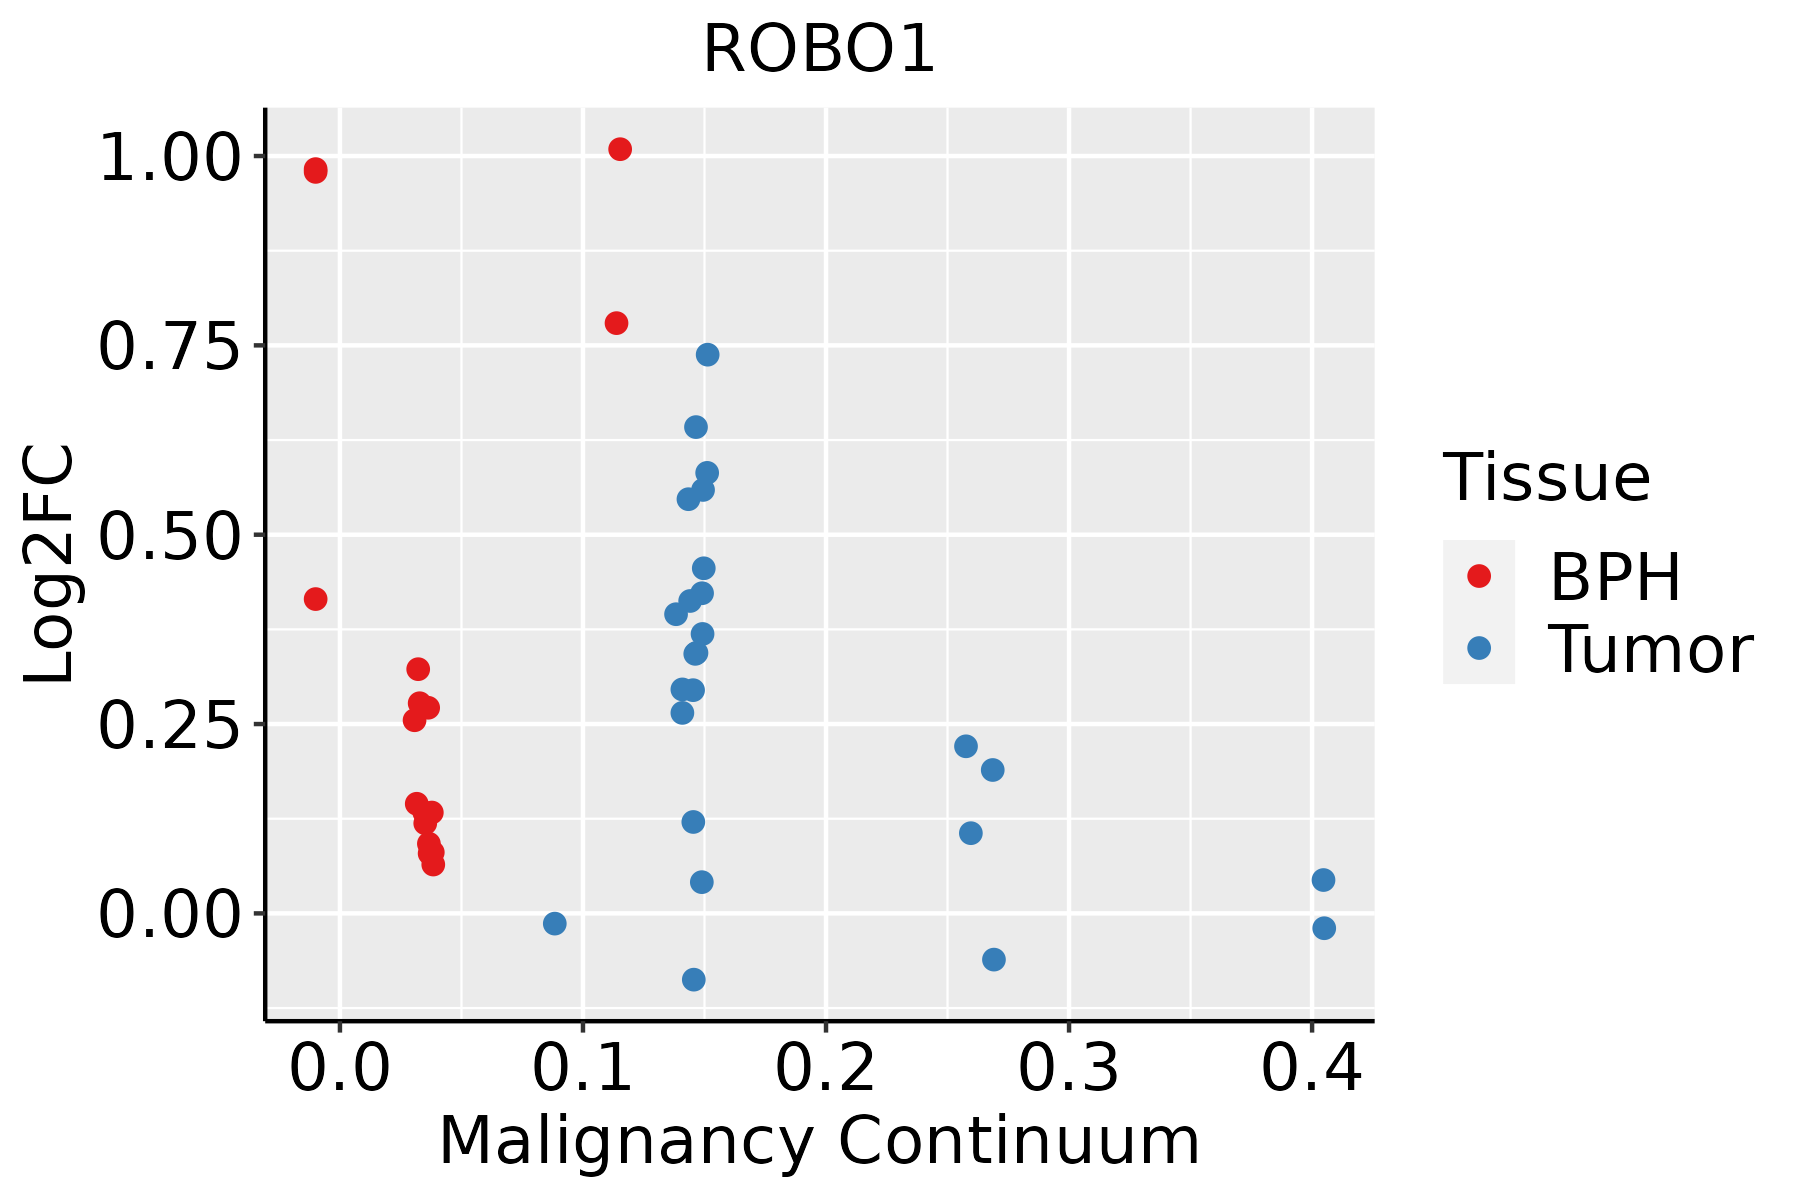 | BPH: Benign Prostatic Hyperplasia |
| Skin | 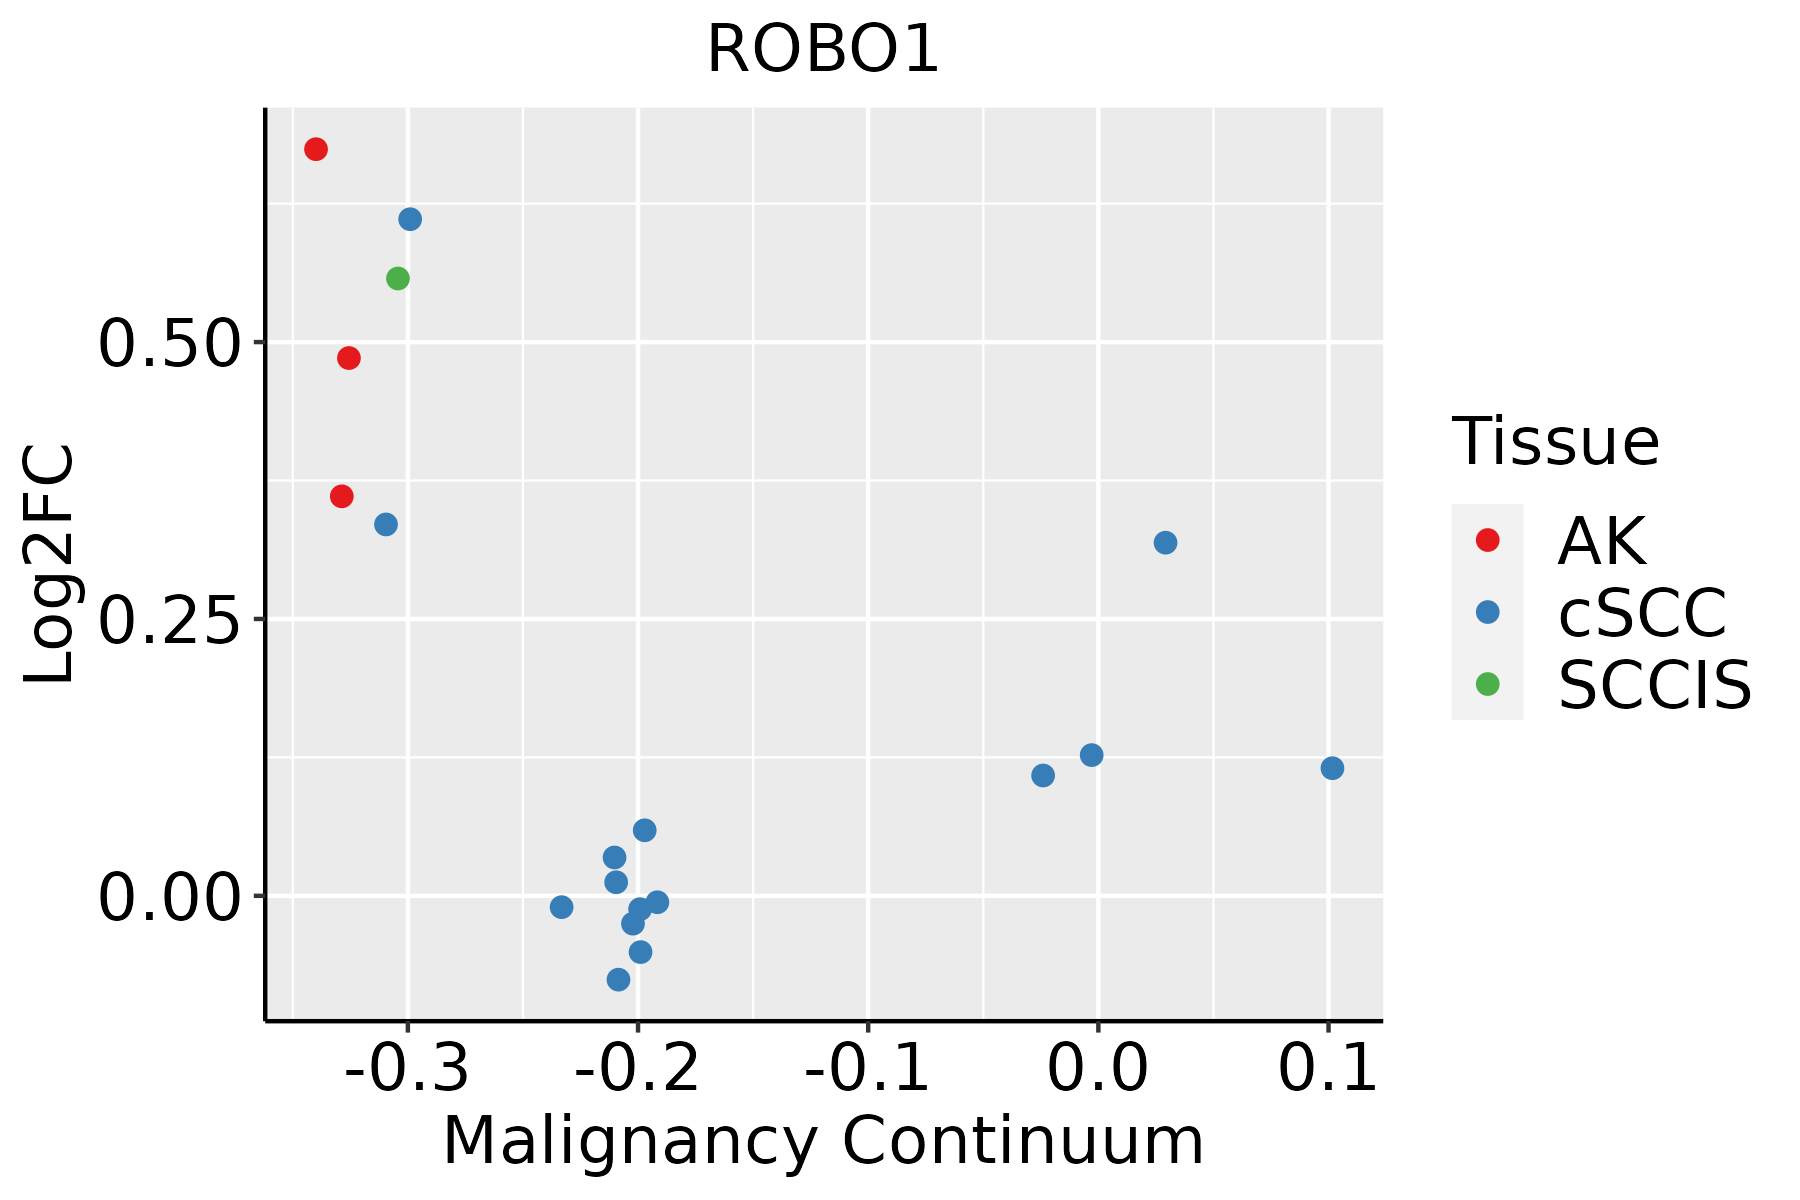 | AK: Actinic keratosis |
| cSCC: Cutaneous squamous cell carcinoma | ||
| SCCIS:squamous cell carcinoma in situ |
| ∗log2FC in expression of this searched gene in stem-like cells from each diseased tissue sample relative to stem-like cells in normal samples in each tissue plotted against the malignancy continuum. Samples are colored based on if they are from different disease stage. |
Top |
Malignant transformation related pathway analysis |
| Find out the enriched GO biological processes and KEGG pathways involved in transition from healthy to precancer to cancer |
| Tissue | Disease Stage | Enriched GO biological Processes |
| Colorectum | AD |  |
| Colorectum | SER |  |
| Colorectum | MSS |  |
| Colorectum | MSI-H |  |
| Colorectum | FAP |  |
| ∗Top 15 enriched GO BP terms are showed in the bar plot of each disease state in each tissue. Each row represents a significant GO biological process which is colored according to the -log10(p.adjust). |
| Page: 1 2 3 4 5 6 7 8 9 |
| GO ID | Tissue | Disease Stage | Description | Gene Ratio | Bg Ratio | pvalue | p.adjust | Count |
| GO:005254710 | Cervix | CC | regulation of peptidase activity | 112/2311 | 461/18723 | 6.70e-13 | 3.08e-10 | 112 |
| GO:004586210 | Cervix | CC | positive regulation of proteolysis | 95/2311 | 372/18723 | 1.84e-12 | 6.86e-10 | 95 |
| GO:005254810 | Cervix | CC | regulation of endopeptidase activity | 103/2311 | 432/18723 | 1.89e-11 | 5.14e-09 | 103 |
| GO:009013210 | Cervix | CC | epithelium migration | 90/2311 | 360/18723 | 2.45e-11 | 6.11e-09 | 90 |
| GO:00016679 | Cervix | CC | ameboidal-type cell migration | 110/2311 | 475/18723 | 2.66e-11 | 6.36e-09 | 110 |
| GO:001063110 | Cervix | CC | epithelial cell migration | 89/2311 | 357/18723 | 3.72e-11 | 8.54e-09 | 89 |
| GO:009013010 | Cervix | CC | tissue migration | 90/2311 | 365/18723 | 5.42e-11 | 1.05e-08 | 90 |
| GO:00510566 | Cervix | CC | regulation of small GTPase mediated signal transduction | 75/2311 | 302/18723 | 1.54e-09 | 1.74e-07 | 75 |
| GO:00506737 | Cervix | CC | epithelial cell proliferation | 98/2311 | 437/18723 | 2.01e-09 | 2.15e-07 | 98 |
| GO:001095210 | Cervix | CC | positive regulation of peptidase activity | 54/2311 | 197/18723 | 8.06e-09 | 6.99e-07 | 54 |
| GO:003367410 | Cervix | CC | positive regulation of kinase activity | 101/2311 | 467/18723 | 8.66e-09 | 7.22e-07 | 101 |
| GO:200011610 | Cervix | CC | regulation of cysteine-type endopeptidase activity | 61/2311 | 235/18723 | 8.69e-09 | 7.22e-07 | 61 |
| GO:00072656 | Cervix | CC | Ras protein signal transduction | 79/2311 | 337/18723 | 9.49e-09 | 7.77e-07 | 79 |
| GO:004328110 | Cervix | CC | regulation of cysteine-type endopeptidase activity involved in apoptotic process | 55/2311 | 209/18723 | 2.77e-08 | 1.95e-06 | 55 |
| GO:00458608 | Cervix | CC | positive regulation of protein kinase activity | 85/2311 | 386/18723 | 5.61e-08 | 3.29e-06 | 85 |
| GO:001095010 | Cervix | CC | positive regulation of endopeptidase activity | 48/2311 | 179/18723 | 1.12e-07 | 5.71e-06 | 48 |
| GO:00506787 | Cervix | CC | regulation of epithelial cell proliferation | 83/2311 | 381/18723 | 1.31e-07 | 6.42e-06 | 83 |
| GO:00719007 | Cervix | CC | regulation of protein serine/threonine kinase activity | 75/2311 | 359/18723 | 2.76e-06 | 8.02e-05 | 75 |
| GO:00109757 | Cervix | CC | regulation of neuron projection development | 88/2311 | 445/18723 | 4.26e-06 | 1.09e-04 | 88 |
| GO:00107206 | Cervix | CC | positive regulation of cell development | 64/2311 | 298/18723 | 5.69e-06 | 1.41e-04 | 64 |
| Page: 1 2 3 4 5 6 7 8 9 10 11 12 13 14 15 16 17 18 19 20 21 22 23 24 25 26 27 28 29 |
| Pathway ID | Tissue | Disease Stage | Description | Gene Ratio | Bg Ratio | pvalue | p.adjust | qvalue | Count |
| hsa043609 | Cervix | CC | Axon guidance | 47/1267 | 182/8465 | 8.13e-05 | 5.38e-04 | 3.18e-04 | 47 |
| hsa0436012 | Cervix | CC | Axon guidance | 47/1267 | 182/8465 | 8.13e-05 | 5.38e-04 | 3.18e-04 | 47 |
| hsa0436016 | Esophagus | ESCC | Axon guidance | 108/4205 | 182/8465 | 5.13e-03 | 1.30e-02 | 6.67e-03 | 108 |
| hsa0436017 | Esophagus | ESCC | Axon guidance | 108/4205 | 182/8465 | 5.13e-03 | 1.30e-02 | 6.67e-03 | 108 |
| hsa0436014 | Oral cavity | OSCC | Axon guidance | 97/3704 | 182/8465 | 5.59e-03 | 1.33e-02 | 6.76e-03 | 97 |
| hsa0436015 | Oral cavity | OSCC | Axon guidance | 97/3704 | 182/8465 | 5.59e-03 | 1.33e-02 | 6.76e-03 | 97 |
| hsa0436023 | Oral cavity | EOLP | Axon guidance | 38/1218 | 182/8465 | 1.02e-02 | 2.80e-02 | 1.65e-02 | 38 |
| hsa0436033 | Oral cavity | EOLP | Axon guidance | 38/1218 | 182/8465 | 1.02e-02 | 2.80e-02 | 1.65e-02 | 38 |
| hsa0436041 | Oral cavity | NEOLP | Axon guidance | 37/1112 | 182/8465 | 4.02e-03 | 1.64e-02 | 1.03e-02 | 37 |
| hsa0436051 | Oral cavity | NEOLP | Axon guidance | 37/1112 | 182/8465 | 4.02e-03 | 1.64e-02 | 1.03e-02 | 37 |
| Page: 1 |
Top |
Cell-cell communication analysis |
| Identification of potential cell-cell interactions between two cell types and their ligand-receptor pairs for different disease states |
| Ligand | Receptor | LRpair | Pathway | Tissue | Disease Stage |
| Page: 1 |
Top |
Single-cell gene regulatory network inference analysis |
| Find out the significant the regulons (TFs) and the target genes of each regulon across cell types for different disease states |
| TF | Cell Type | Tissue | Disease Stage | Target Gene | RSS | Regulon Activity |
| ∗The dot plots of a searched regulon are shown for all cell subpopulations in each disease state of each tissue based on the regulon specific score inferred using pySCENIC and by calculating the average expression. |
| Page: 1 |
Top |
Somatic mutation of malignant transformation related genes |
| Annotation of somatic variants for genes involved in malignant transformation |
| Hugo Symbol | Variant Class | Variant Classification | dbSNP RS | HGVSc | HGVSp | HGVSp Short | SWISSPROT | BIOTYPE | SIFT | PolyPhen | Tumor Sample Barcode | Tissue | Histology | Sex | Age | Stage | Therapy Types | Drugs | Outcome |
| ROBO1 | SNV | Missense_Mutation | rs770056315 | c.3778N>C | p.Thr1260Pro | p.T1260P | Q9Y6N7 | protein_coding | deleterious(0) | probably_damaging(0.947) | TCGA-A2-A04Q-01 | Breast | breast invasive carcinoma | Female | <65 | I/II | Chemotherapy | adriamycin | SD |
| ROBO1 | SNV | Missense_Mutation | novel | c.2958C>A | p.Asn986Lys | p.N986K | Q9Y6N7 | protein_coding | tolerated(0.19) | benign(0.066) | TCGA-A2-A04V-01 | Breast | breast invasive carcinoma | Female | <65 | I/II | Chemotherapy | cytoxan | PD |
| ROBO1 | SNV | Missense_Mutation | novel | c.1409N>C | p.Gly470Ala | p.G470A | Q9Y6N7 | protein_coding | tolerated(0.3) | possibly_damaging(0.703) | TCGA-A2-A0CV-01 | Breast | breast invasive carcinoma | Female | <65 | I/II | Chemotherapy | cytoxan | SD |
| ROBO1 | SNV | Missense_Mutation | novel | c.3740N>T | p.Ala1247Val | p.A1247V | Q9Y6N7 | protein_coding | tolerated(0.08) | benign(0.074) | TCGA-AC-A5EH-01 | Breast | breast invasive carcinoma | Female | >=65 | I/II | Unknown | Unknown | SD |
| ROBO1 | SNV | Missense_Mutation | c.4874N>T | p.Arg1625Ile | p.R1625I | Q9Y6N7 | protein_coding | deleterious_low_confidence(0) | benign(0.355) | TCGA-AN-A046-01 | Breast | breast invasive carcinoma | Female | >=65 | I/II | Unknown | Unknown | SD | |
| ROBO1 | SNV | Missense_Mutation | rs372853961 | c.3730N>T | p.Arg1244Trp | p.R1244W | Q9Y6N7 | protein_coding | deleterious(0) | probably_damaging(0.987) | TCGA-AN-A046-01 | Breast | breast invasive carcinoma | Female | >=65 | I/II | Unknown | Unknown | SD |
| ROBO1 | SNV | Missense_Mutation | rs756411742 | c.2295N>G | p.Ile765Met | p.I765M | Q9Y6N7 | protein_coding | tolerated(0.13) | benign(0.007) | TCGA-AN-A0XW-01 | Breast | breast invasive carcinoma | Female | <65 | III/IV | Unknown | Unknown | SD |
| ROBO1 | SNV | Missense_Mutation | c.440N>A | p.Cys147Tyr | p.C147Y | Q9Y6N7 | protein_coding | deleterious(0) | probably_damaging(1) | TCGA-AQ-A1H2-01 | Breast | breast invasive carcinoma | Female | >=65 | III/IV | Chemotherapy | herceptin | SD | |
| ROBO1 | SNV | Missense_Mutation | c.1287N>T | p.Gln429His | p.Q429H | Q9Y6N7 | protein_coding | deleterious(0) | probably_damaging(1) | TCGA-AR-A0TU-01 | Breast | breast invasive carcinoma | Female | <65 | I/II | Unspecific | Doxorubicin | SD | |
| ROBO1 | SNV | Missense_Mutation | rs770056315 | c.3778A>C | p.Thr1260Pro | p.T1260P | Q9Y6N7 | protein_coding | deleterious(0) | probably_damaging(0.947) | TCGA-B6-A0I5-01 | Breast | breast invasive carcinoma | Female | <65 | I/II | Unknown | Unknown | SD |
| Page: 1 2 3 4 5 6 7 8 9 10 11 12 13 14 15 16 17 18 19 20 21 22 23 24 25 26 27 |
Top |
Related drugs of malignant transformation related genes |
| Identification of chemicals and drugs interact with genes involved in malignant transfromation |
| (DGIdb 4.0) |
| Entrez ID | Symbol | Category | Interaction Types | Drug Claim Name | Drug Name | PMIDs |
| Page: 1 |

Copyright 2023-Present -The University of Texas Health Science Center at Houston |