
|
|||||
|
 | |
| |
| |
| |
| |
| |
|
Gene: RO60 |
Gene summary for RO60 |
| Gene information | Species | Human | Gene symbol | RO60 | Gene ID | 6738 |
| Gene name | Ro60, Y RNA binding protein | |
| Gene Alias | RORNP | |
| Cytomap | 1q31.2 | |
| Gene Type | protein-coding | GO ID | GO:0002376 | UniProtAcc | P10155 |
Top |
Malignant transformation analysis |
| Identification of the aberrant gene expression in precancerous and cancerous lesions by comparing the gene expression of stem-like cells in diseased tissues with normal stem cells |
| Entrez ID | Symbol | Replicates | Species | Organ | Tissue | Adj P-value | Log2FC | Malignancy |
| 6738 | RO60 | LZE2D | Human | Esophagus | HGIN | 3.64e-03 | 5.36e-01 | 0.0642 |
| 6738 | RO60 | LZE2T | Human | Esophagus | ESCC | 1.52e-08 | 6.52e-01 | 0.082 |
| 6738 | RO60 | LZE4T | Human | Esophagus | ESCC | 4.82e-28 | 6.45e-01 | 0.0811 |
| 6738 | RO60 | LZE5T | Human | Esophagus | ESCC | 1.40e-06 | 4.90e-01 | 0.0514 |
| 6738 | RO60 | LZE7T | Human | Esophagus | ESCC | 1.18e-25 | 1.20e+00 | 0.0667 |
| 6738 | RO60 | LZE8T | Human | Esophagus | ESCC | 3.51e-22 | 5.07e-01 | 0.067 |
| 6738 | RO60 | LZE20T | Human | Esophagus | ESCC | 8.11e-14 | 4.18e-01 | 0.0662 |
| 6738 | RO60 | LZE22D1 | Human | Esophagus | HGIN | 4.30e-07 | 3.26e-01 | 0.0595 |
| 6738 | RO60 | LZE22T | Human | Esophagus | ESCC | 5.52e-13 | 7.37e-01 | 0.068 |
| 6738 | RO60 | LZE24T | Human | Esophagus | ESCC | 1.43e-40 | 8.72e-01 | 0.0596 |
| 6738 | RO60 | LZE21T | Human | Esophagus | ESCC | 2.27e-11 | 5.47e-01 | 0.0655 |
| 6738 | RO60 | LZE6T | Human | Esophagus | ESCC | 1.16e-11 | 4.10e-01 | 0.0845 |
| Page: 1 |
| Tissue | Expression Dynamics | Abbreviation |
| Esophagus | 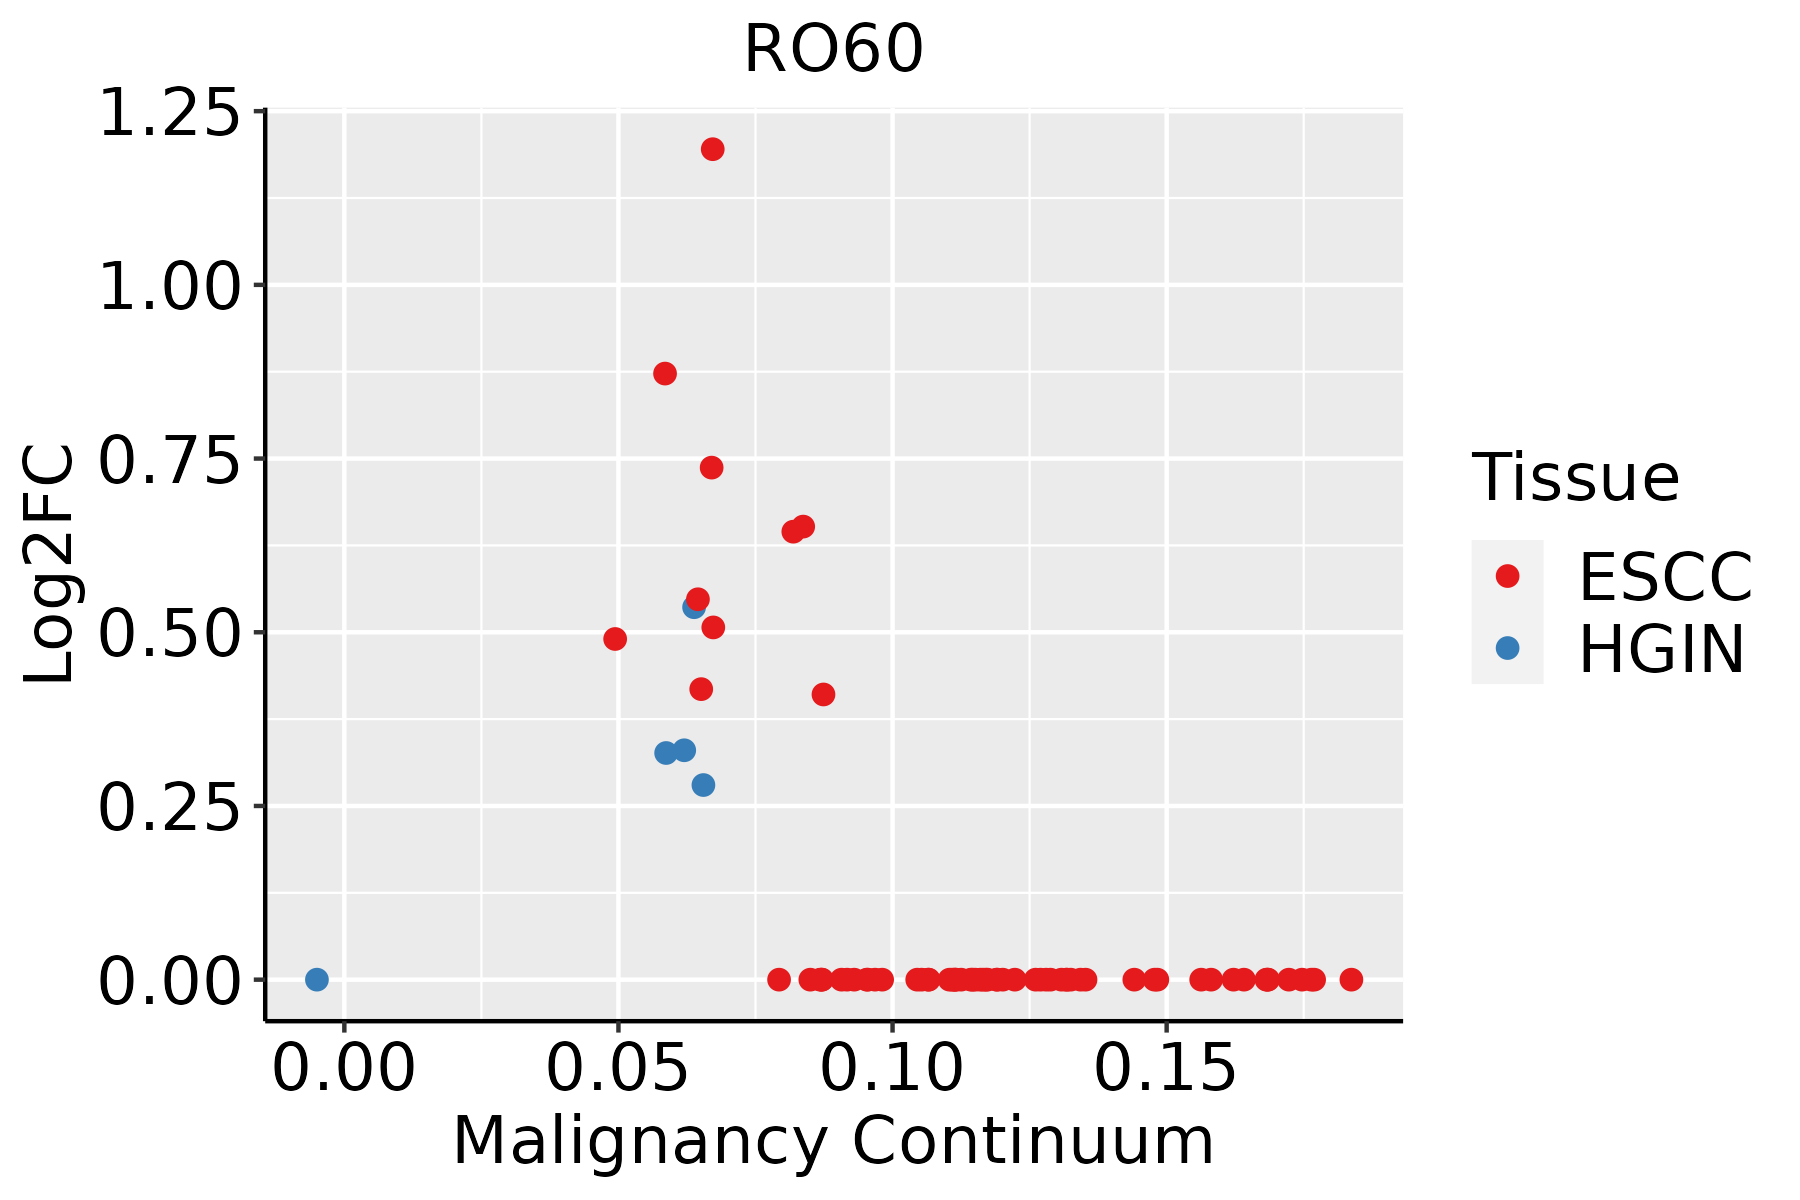 | ESCC: Esophageal squamous cell carcinoma |
| HGIN: High-grade intraepithelial neoplasias | ||
| LGIN: Low-grade intraepithelial neoplasias |
| ∗log2FC in expression of this searched gene in stem-like cells from each diseased tissue sample relative to stem-like cells in normal samples in each tissue plotted against the malignancy continuum. Samples are colored based on if they are from different disease stage. |
Top |
Malignant transformation related pathway analysis |
| Find out the enriched GO biological processes and KEGG pathways involved in transition from healthy to precancer to cancer |
| Tissue | Disease Stage | Enriched GO biological Processes |
| Colorectum | AD |  |
| Colorectum | SER |  |
| Colorectum | MSS |  |
| Colorectum | MSI-H |  |
| Colorectum | FAP |  |
| ∗Top 15 enriched GO BP terms are showed in the bar plot of each disease state in each tissue. Each row represents a significant GO biological process which is colored according to the -log10(p.adjust). |
| Page: 1 2 3 4 5 6 7 8 9 |
| GO ID | Tissue | Disease Stage | Description | Gene Ratio | Bg Ratio | pvalue | p.adjust | Count |
| GO:000931418 | Esophagus | HGIN | response to radiation | 88/2587 | 456/18723 | 6.26e-04 | 8.65e-03 | 88 |
| GO:00094115 | Esophagus | HGIN | response to UV | 35/2587 | 149/18723 | 9.71e-04 | 1.22e-02 | 35 |
| GO:00094165 | Esophagus | HGIN | response to light stimulus | 61/2587 | 320/18723 | 5.20e-03 | 4.30e-02 | 61 |
| GO:000941113 | Esophagus | ESCC | response to UV | 115/8552 | 149/18723 | 3.29e-15 | 1.93e-13 | 115 |
| GO:000931419 | Esophagus | ESCC | response to radiation | 277/8552 | 456/18723 | 4.42e-11 | 1.43e-09 | 277 |
| GO:00063833 | Esophagus | ESCC | transcription by RNA polymerase III | 41/8552 | 46/18723 | 7.69e-10 | 1.90e-08 | 41 |
| GO:000941611 | Esophagus | ESCC | response to light stimulus | 183/8552 | 320/18723 | 2.03e-05 | 1.76e-04 | 183 |
| GO:00354555 | Esophagus | ESCC | response to interferon-alpha | 17/8552 | 21/18723 | 1.03e-03 | 5.19e-03 | 17 |
| Page: 1 |
| Pathway ID | Tissue | Disease Stage | Description | Gene Ratio | Bg Ratio | pvalue | p.adjust | qvalue | Count |
| Page: 1 |
Top |
Cell-cell communication analysis |
| Identification of potential cell-cell interactions between two cell types and their ligand-receptor pairs for different disease states |
| Ligand | Receptor | LRpair | Pathway | Tissue | Disease Stage |
| Page: 1 |
Top |
Single-cell gene regulatory network inference analysis |
| Find out the significant the regulons (TFs) and the target genes of each regulon across cell types for different disease states |
| TF | Cell Type | Tissue | Disease Stage | Target Gene | RSS | Regulon Activity |
| ∗The dot plots of a searched regulon are shown for all cell subpopulations in each disease state of each tissue based on the regulon specific score inferred using pySCENIC and by calculating the average expression. |
| Page: 1 |
Top |
Somatic mutation of malignant transformation related genes |
| Annotation of somatic variants for genes involved in malignant transformation |
| Hugo Symbol | Variant Class | Variant Classification | dbSNP RS | HGVSc | HGVSp | HGVSp Short | SWISSPROT | BIOTYPE | SIFT | PolyPhen | Tumor Sample Barcode | Tissue | Histology | Sex | Age | Stage | Therapy Types | Drugs | Outcome |
| Page: 1 |
Top |
Related drugs of malignant transformation related genes |
| Identification of chemicals and drugs interact with genes involved in malignant transfromation |
| (DGIdb 4.0) |
| Entrez ID | Symbol | Category | Interaction Types | Drug Claim Name | Drug Name | PMIDs |
| Page: 1 |

Copyright 2023-Present -The University of Texas Health Science Center at Houston |