
|
|||||
|
 | |
| |
| |
| |
| |
| |
|
Gene: RNPC3 |
Gene summary for RNPC3 |
| Gene information | Species | Human | Gene symbol | RNPC3 | Gene ID | 55599 |
| Gene name | RNA binding region (RNP1, RRM) containing 3 | |
| Gene Alias | IGHD5 | |
| Cytomap | 1p21.1 | |
| Gene Type | protein-coding | GO ID | GO:0000375 | UniProtAcc | Q96LT9 |
Top |
Malignant transformation analysis |
| Identification of the aberrant gene expression in precancerous and cancerous lesions by comparing the gene expression of stem-like cells in diseased tissues with normal stem cells |
| Entrez ID | Symbol | Replicates | Species | Organ | Tissue | Adj P-value | Log2FC | Malignancy |
| 55599 | RNPC3 | LZE4T | Human | Esophagus | ESCC | 1.29e-02 | 7.12e-02 | 0.0811 |
| 55599 | RNPC3 | LZE7T | Human | Esophagus | ESCC | 8.39e-04 | 1.53e-01 | 0.0667 |
| 55599 | RNPC3 | LZE20T | Human | Esophagus | ESCC | 3.04e-07 | 1.69e-01 | 0.0662 |
| 55599 | RNPC3 | LZE24T | Human | Esophagus | ESCC | 1.08e-04 | 1.11e-01 | 0.0596 |
| 55599 | RNPC3 | LZE21T | Human | Esophagus | ESCC | 2.02e-02 | 2.62e-01 | 0.0655 |
| 55599 | RNPC3 | P1T-E | Human | Esophagus | ESCC | 2.28e-13 | 6.50e-01 | 0.0875 |
| 55599 | RNPC3 | P2T-E | Human | Esophagus | ESCC | 2.20e-20 | 2.14e-01 | 0.1177 |
| 55599 | RNPC3 | P4T-E | Human | Esophagus | ESCC | 8.72e-12 | 1.88e-01 | 0.1323 |
| 55599 | RNPC3 | P5T-E | Human | Esophagus | ESCC | 1.57e-22 | 3.67e-01 | 0.1327 |
| 55599 | RNPC3 | P8T-E | Human | Esophagus | ESCC | 4.28e-16 | 3.32e-01 | 0.0889 |
| 55599 | RNPC3 | P9T-E | Human | Esophagus | ESCC | 2.19e-14 | 2.30e-01 | 0.1131 |
| 55599 | RNPC3 | P10T-E | Human | Esophagus | ESCC | 2.55e-25 | 3.83e-01 | 0.116 |
| 55599 | RNPC3 | P11T-E | Human | Esophagus | ESCC | 7.01e-07 | 1.77e-01 | 0.1426 |
| 55599 | RNPC3 | P12T-E | Human | Esophagus | ESCC | 1.94e-23 | 4.46e-01 | 0.1122 |
| 55599 | RNPC3 | P15T-E | Human | Esophagus | ESCC | 3.34e-06 | 8.03e-02 | 0.1149 |
| 55599 | RNPC3 | P16T-E | Human | Esophagus | ESCC | 1.11e-08 | 1.38e-01 | 0.1153 |
| 55599 | RNPC3 | P17T-E | Human | Esophagus | ESCC | 4.23e-07 | 1.94e-01 | 0.1278 |
| 55599 | RNPC3 | P19T-E | Human | Esophagus | ESCC | 1.11e-03 | 1.90e-01 | 0.1662 |
| 55599 | RNPC3 | P20T-E | Human | Esophagus | ESCC | 1.31e-16 | 3.19e-01 | 0.1124 |
| 55599 | RNPC3 | P21T-E | Human | Esophagus | ESCC | 1.25e-07 | 9.60e-02 | 0.1617 |
| Page: 1 2 3 4 |
| Tissue | Expression Dynamics | Abbreviation |
| Esophagus | 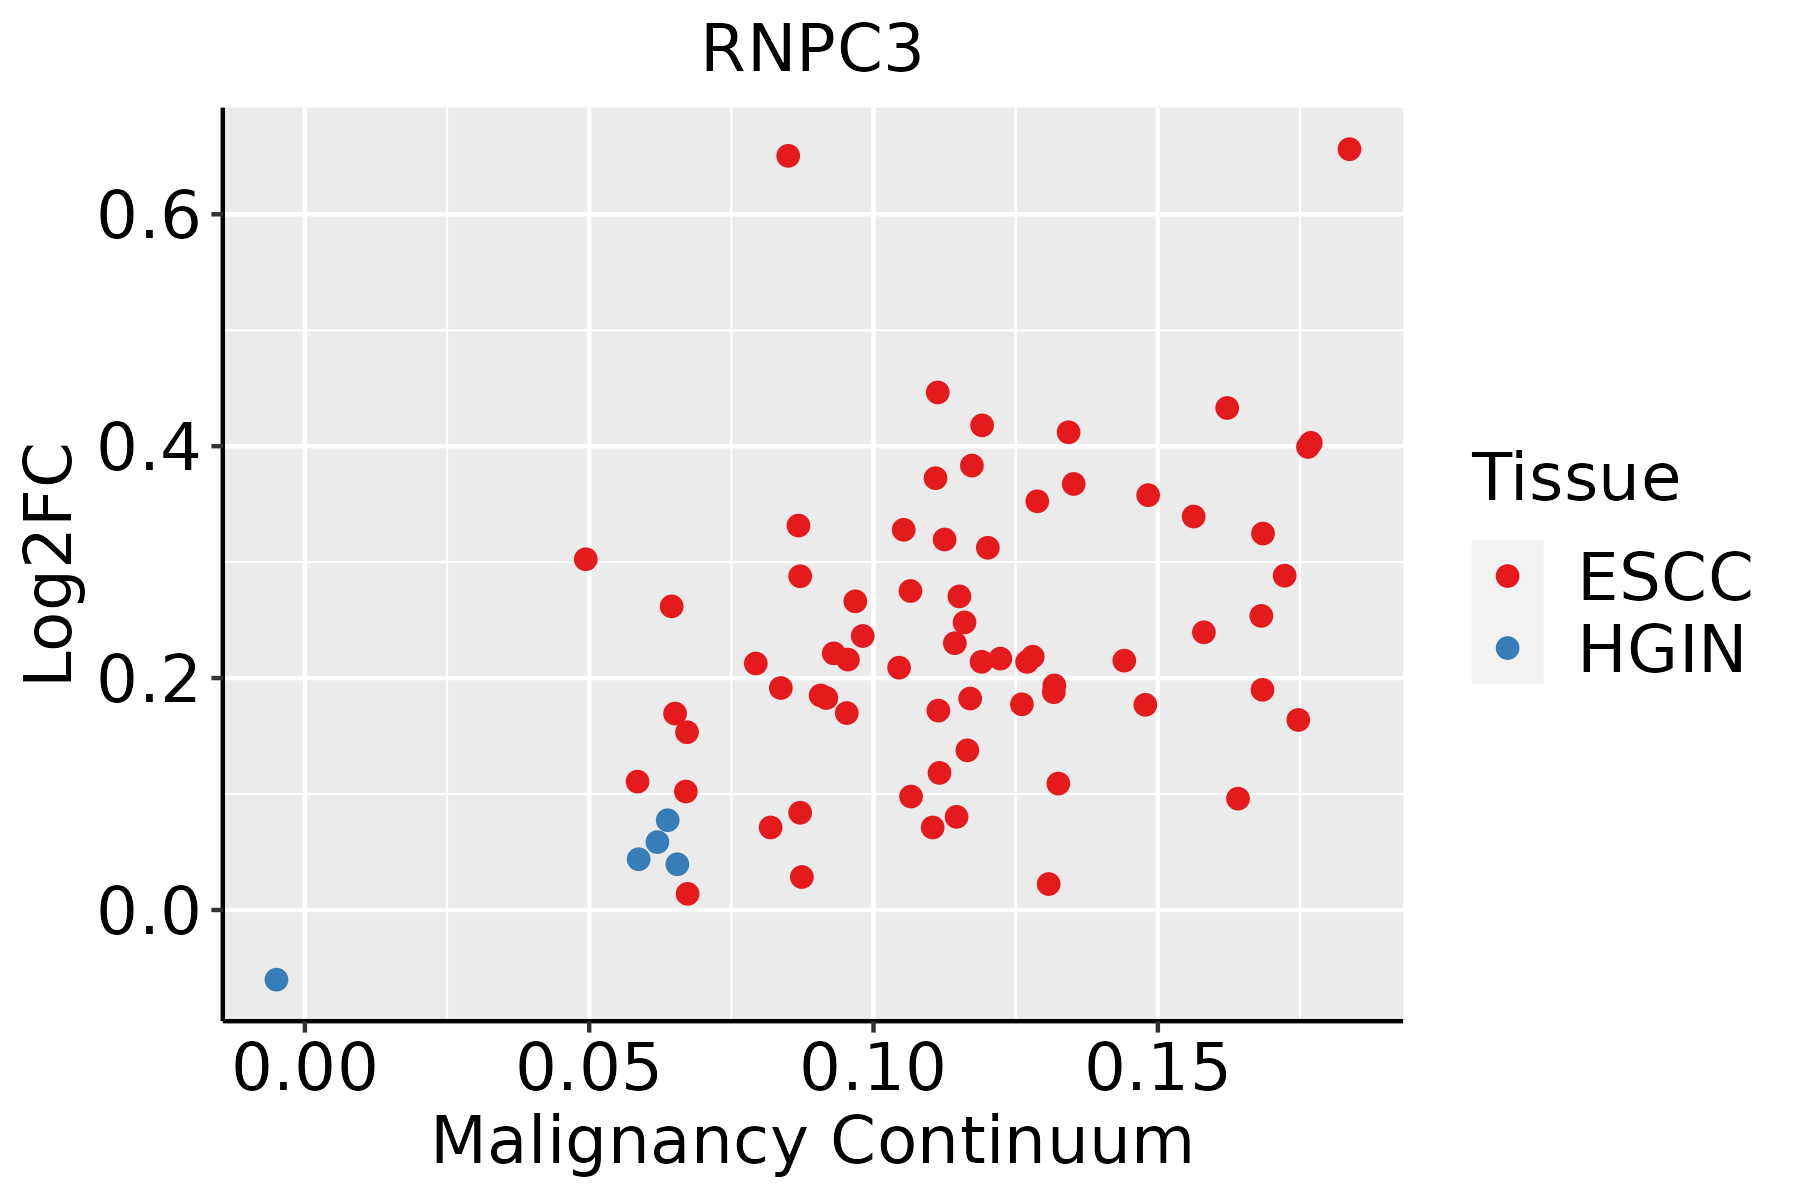 | ESCC: Esophageal squamous cell carcinoma |
| HGIN: High-grade intraepithelial neoplasias | ||
| LGIN: Low-grade intraepithelial neoplasias | ||
| Lung |  | AAH: Atypical adenomatous hyperplasia |
| AIS: Adenocarcinoma in situ | ||
| IAC: Invasive lung adenocarcinoma | ||
| MIA: Minimally invasive adenocarcinoma | ||
| Thyroid | 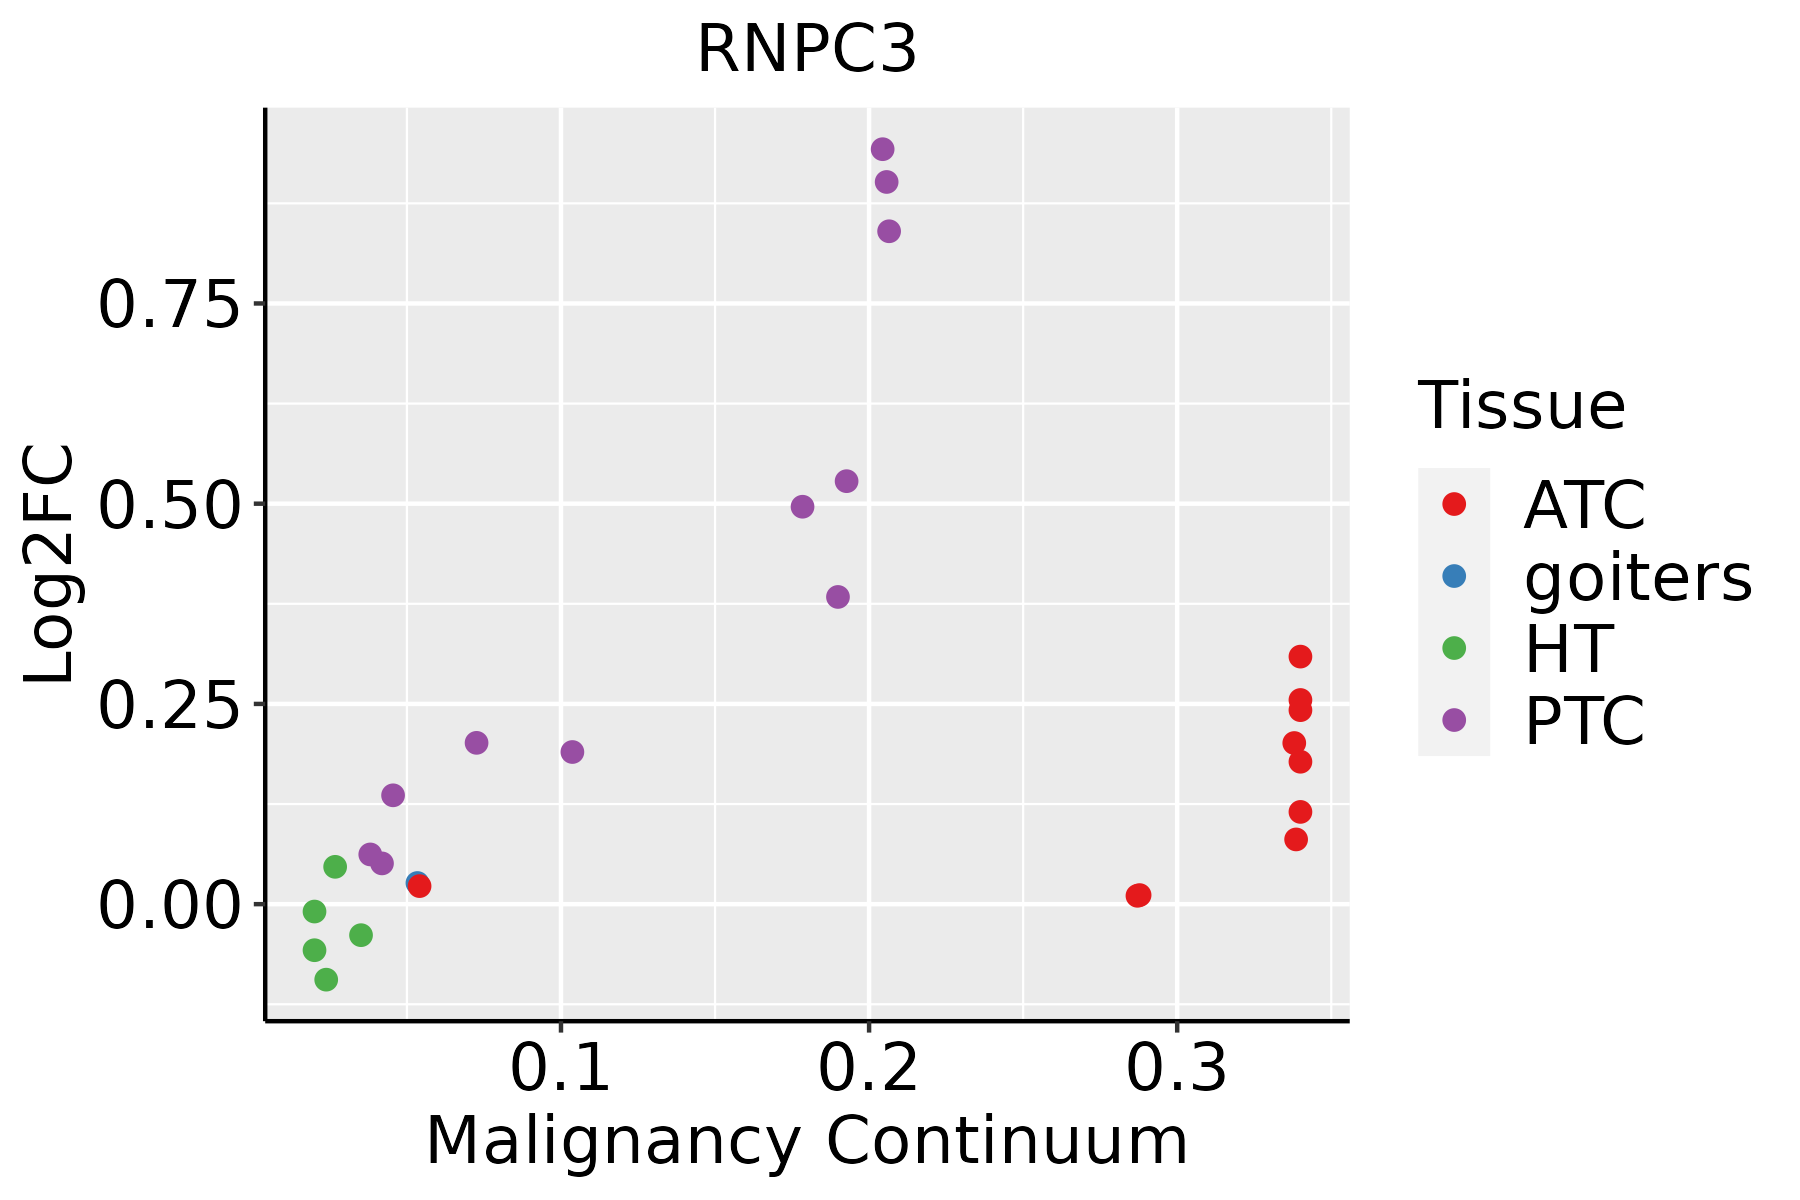 | ATC: Anaplastic thyroid cancer |
| HT: Hashimoto's thyroiditis | ||
| PTC: Papillary thyroid cancer |
| ∗log2FC in expression of this searched gene in stem-like cells from each diseased tissue sample relative to stem-like cells in normal samples in each tissue plotted against the malignancy continuum. Samples are colored based on if they are from different disease stage. |
Top |
Malignant transformation related pathway analysis |
| Find out the enriched GO biological processes and KEGG pathways involved in transition from healthy to precancer to cancer |
| Tissue | Disease Stage | Enriched GO biological Processes |
| Colorectum | AD |  |
| Colorectum | SER |  |
| Colorectum | MSS |  |
| Colorectum | MSI-H |  |
| Colorectum | FAP |  |
| ∗Top 15 enriched GO BP terms are showed in the bar plot of each disease state in each tissue. Each row represents a significant GO biological process which is colored according to the -log10(p.adjust). |
| Page: 1 2 3 4 5 6 7 8 9 |
| GO ID | Tissue | Disease Stage | Description | Gene Ratio | Bg Ratio | pvalue | p.adjust | Count |
| GO:0008380111 | Esophagus | ESCC | RNA splicing | 336/8552 | 434/18723 | 1.74e-42 | 3.67e-39 | 336 |
| GO:0000375111 | Esophagus | ESCC | RNA splicing, via transesterification reactions | 248/8552 | 324/18723 | 3.05e-30 | 1.49e-27 | 248 |
| GO:0000377111 | Esophagus | ESCC | RNA splicing, via transesterification reactions with bulged adenosine as nucleophile | 244/8552 | 320/18723 | 2.52e-29 | 1.07e-26 | 244 |
| GO:0000398111 | Esophagus | ESCC | mRNA splicing, via spliceosome | 244/8552 | 320/18723 | 2.52e-29 | 1.07e-26 | 244 |
| GO:000838013 | Lung | AIS | RNA splicing | 68/1849 | 434/18723 | 8.50e-05 | 2.11e-03 | 68 |
| GO:000037713 | Lung | AIS | RNA splicing, via transesterification reactions with bulged adenosine as nucleophile | 49/1849 | 320/18723 | 1.30e-03 | 1.63e-02 | 49 |
| GO:000039813 | Lung | AIS | mRNA splicing, via spliceosome | 49/1849 | 320/18723 | 1.30e-03 | 1.63e-02 | 49 |
| GO:000037513 | Lung | AIS | RNA splicing, via transesterification reactions | 49/1849 | 324/18723 | 1.69e-03 | 1.93e-02 | 49 |
| GO:0008380113 | Thyroid | PTC | RNA splicing | 273/5968 | 434/18723 | 4.44e-41 | 1.40e-37 | 273 |
| GO:0000375113 | Thyroid | PTC | RNA splicing, via transesterification reactions | 202/5968 | 324/18723 | 6.81e-30 | 3.91e-27 | 202 |
| GO:0000377113 | Thyroid | PTC | RNA splicing, via transesterification reactions with bulged adenosine as nucleophile | 199/5968 | 320/18723 | 2.96e-29 | 1.44e-26 | 199 |
| GO:0000398113 | Thyroid | PTC | mRNA splicing, via spliceosome | 199/5968 | 320/18723 | 2.96e-29 | 1.44e-26 | 199 |
| GO:000838034 | Thyroid | ATC | RNA splicing | 270/6293 | 434/18723 | 7.50e-35 | 1.19e-31 | 270 |
| GO:000037534 | Thyroid | ATC | RNA splicing, via transesterification reactions | 200/6293 | 324/18723 | 1.75e-25 | 7.39e-23 | 200 |
| GO:000037734 | Thyroid | ATC | RNA splicing, via transesterification reactions with bulged adenosine as nucleophile | 197/6293 | 320/18723 | 6.54e-25 | 2.18e-22 | 197 |
| GO:000039834 | Thyroid | ATC | mRNA splicing, via spliceosome | 197/6293 | 320/18723 | 6.54e-25 | 2.18e-22 | 197 |
| Page: 1 |
| Pathway ID | Tissue | Disease Stage | Description | Gene Ratio | Bg Ratio | pvalue | p.adjust | qvalue | Count |
| Page: 1 |
Top |
Cell-cell communication analysis |
| Identification of potential cell-cell interactions between two cell types and their ligand-receptor pairs for different disease states |
| Ligand | Receptor | LRpair | Pathway | Tissue | Disease Stage |
| Page: 1 |
Top |
Single-cell gene regulatory network inference analysis |
| Find out the significant the regulons (TFs) and the target genes of each regulon across cell types for different disease states |
| TF | Cell Type | Tissue | Disease Stage | Target Gene | RSS | Regulon Activity |
| ∗The dot plots of a searched regulon are shown for all cell subpopulations in each disease state of each tissue based on the regulon specific score inferred using pySCENIC and by calculating the average expression. |
| Page: 1 |
Top |
Somatic mutation of malignant transformation related genes |
| Annotation of somatic variants for genes involved in malignant transformation |
| Hugo Symbol | Variant Class | Variant Classification | dbSNP RS | HGVSc | HGVSp | HGVSp Short | SWISSPROT | BIOTYPE | SIFT | PolyPhen | Tumor Sample Barcode | Tissue | Histology | Sex | Age | Stage | Therapy Types | Drugs | Outcome |
| RNPC3 | SNV | Missense_Mutation | c.285N>T | p.Leu95Phe | p.L95F | Q96LT9 | protein_coding | deleterious(0.04) | probably_damaging(0.999) | TCGA-AN-A0XW-01 | Breast | breast invasive carcinoma | Female | <65 | III/IV | Unknown | Unknown | SD | |
| RNPC3 | SNV | Missense_Mutation | c.151N>C | p.Gly51Arg | p.G51R | Q96LT9 | protein_coding | deleterious(0) | probably_damaging(0.994) | TCGA-AO-A124-01 | Breast | breast invasive carcinoma | Female | <65 | I/II | Chemotherapy | doxorubicin | SD | |
| RNPC3 | SNV | Missense_Mutation | novel | c.1406N>G | p.Ala469Gly | p.A469G | Q96LT9 | protein_coding | deleterious(0) | probably_damaging(0.999) | TCGA-AR-A5QQ-01 | Breast | breast invasive carcinoma | Female | >=65 | III/IV | Chemotherapy | carboplatin | PD |
| RNPC3 | SNV | Missense_Mutation | novel | c.374T>C | p.Val125Ala | p.V125A | Q96LT9 | protein_coding | tolerated(0.34) | benign(0.014) | TCGA-2W-A8YY-01 | Cervix | cervical & endocervical cancer | Female | <65 | I/II | Chemotherapy | cisplatin | CR |
| RNPC3 | SNV | Missense_Mutation | rs753288069 | c.1030N>A | p.Glu344Lys | p.E344K | Q96LT9 | protein_coding | tolerated(0.22) | benign(0.045) | TCGA-C5-A2LZ-01 | Cervix | cervical & endocervical cancer | Female | >=65 | III/IV | Unknown | Unknown | PD |
| RNPC3 | SNV | Missense_Mutation | novel | c.10C>T | p.Pro4Ser | p.P4S | Q96LT9 | protein_coding | deleterious_low_confidence(0) | benign(0.003) | TCGA-AA-A00N-01 | Colorectum | colon adenocarcinoma | Male | >=65 | I/II | Unknown | Unknown | PD |
| RNPC3 | SNV | Missense_Mutation | novel | c.1478N>A | p.Gly493Glu | p.G493E | Q96LT9 | protein_coding | tolerated(0.42) | benign(0.076) | TCGA-AM-5820-01 | Colorectum | colon adenocarcinoma | Female | <65 | I/II | Unknown | Unknown | SD |
| RNPC3 | SNV | Missense_Mutation | c.1004N>G | p.Lys335Arg | p.K335R | Q96LT9 | protein_coding | tolerated(0.47) | benign(0) | TCGA-AG-A026-01 | Colorectum | rectum adenocarcinoma | Male | >=65 | I/II | Unknown | Unknown | PD | |
| RNPC3 | SNV | Missense_Mutation | novel | c.539N>A | p.Pro180His | p.P180H | Q96LT9 | protein_coding | deleterious(0) | probably_damaging(0.999) | TCGA-A5-A0G1-01 | Endometrium | uterine corpus endometrioid carcinoma | Female | >=65 | I/II | Unknown | Unknown | SD |
| RNPC3 | SNV | Missense_Mutation | novel | c.1547N>T | p.Lys516Met | p.K516M | Q96LT9 | protein_coding | deleterious_low_confidence(0) | probably_damaging(0.956) | TCGA-A5-A0G1-01 | Endometrium | uterine corpus endometrioid carcinoma | Female | >=65 | I/II | Unknown | Unknown | SD |
| Page: 1 2 3 |
Top |
Related drugs of malignant transformation related genes |
| Identification of chemicals and drugs interact with genes involved in malignant transfromation |
| (DGIdb 4.0) |
| Entrez ID | Symbol | Category | Interaction Types | Drug Claim Name | Drug Name | PMIDs |
| Page: 1 |

Copyright 2023-Present -The University of Texas Health Science Center at Houston |