
|
|||||
|
 | |
| |
| |
| |
| |
| |
|
Gene: RNFT1 |
Gene summary for RNFT1 |
| Gene information | Species | Human | Gene symbol | RNFT1 | Gene ID | 51136 |
| Gene name | ring finger protein, transmembrane 1 | |
| Gene Alias | PTD016 | |
| Cytomap | 17q23.1 | |
| Gene Type | protein-coding | GO ID | GO:0006464 | UniProtAcc | Q5M7Z0 |
Top |
Malignant transformation analysis |
| Identification of the aberrant gene expression in precancerous and cancerous lesions by comparing the gene expression of stem-like cells in diseased tissues with normal stem cells |
| Entrez ID | Symbol | Replicates | Species | Organ | Tissue | Adj P-value | Log2FC | Malignancy |
| 51136 | RNFT1 | LZE4T | Human | Esophagus | ESCC | 7.17e-07 | 2.41e-01 | 0.0811 |
| 51136 | RNFT1 | LZE24T | Human | Esophagus | ESCC | 7.34e-34 | 7.49e-01 | 0.0596 |
| 51136 | RNFT1 | LZE21T | Human | Esophagus | ESCC | 8.92e-03 | 1.86e-01 | 0.0655 |
| 51136 | RNFT1 | LZE6T | Human | Esophagus | ESCC | 1.24e-02 | 1.68e-01 | 0.0845 |
| 51136 | RNFT1 | P1T-E | Human | Esophagus | ESCC | 5.72e-04 | 2.39e-01 | 0.0875 |
| 51136 | RNFT1 | P2T-E | Human | Esophagus | ESCC | 3.47e-16 | 3.24e-01 | 0.1177 |
| 51136 | RNFT1 | P4T-E | Human | Esophagus | ESCC | 2.63e-06 | 2.02e-01 | 0.1323 |
| 51136 | RNFT1 | P5T-E | Human | Esophagus | ESCC | 2.59e-03 | 5.28e-02 | 0.1327 |
| 51136 | RNFT1 | P8T-E | Human | Esophagus | ESCC | 2.66e-07 | 1.93e-01 | 0.0889 |
| 51136 | RNFT1 | P9T-E | Human | Esophagus | ESCC | 6.00e-08 | 1.81e-01 | 0.1131 |
| 51136 | RNFT1 | P10T-E | Human | Esophagus | ESCC | 8.17e-09 | 1.67e-01 | 0.116 |
| 51136 | RNFT1 | P11T-E | Human | Esophagus | ESCC | 2.46e-09 | 3.29e-01 | 0.1426 |
| 51136 | RNFT1 | P12T-E | Human | Esophagus | ESCC | 2.95e-17 | 3.94e-01 | 0.1122 |
| 51136 | RNFT1 | P15T-E | Human | Esophagus | ESCC | 4.52e-05 | 1.60e-01 | 0.1149 |
| 51136 | RNFT1 | P16T-E | Human | Esophagus | ESCC | 5.51e-18 | 4.13e-01 | 0.1153 |
| 51136 | RNFT1 | P20T-E | Human | Esophagus | ESCC | 2.14e-17 | 3.54e-01 | 0.1124 |
| 51136 | RNFT1 | P21T-E | Human | Esophagus | ESCC | 2.78e-12 | 2.88e-01 | 0.1617 |
| 51136 | RNFT1 | P22T-E | Human | Esophagus | ESCC | 2.22e-22 | 3.73e-01 | 0.1236 |
| 51136 | RNFT1 | P23T-E | Human | Esophagus | ESCC | 1.32e-30 | 6.37e-01 | 0.108 |
| 51136 | RNFT1 | P24T-E | Human | Esophagus | ESCC | 7.47e-04 | 1.32e-01 | 0.1287 |
| Page: 1 2 3 4 |
| Tissue | Expression Dynamics | Abbreviation |
| Esophagus | 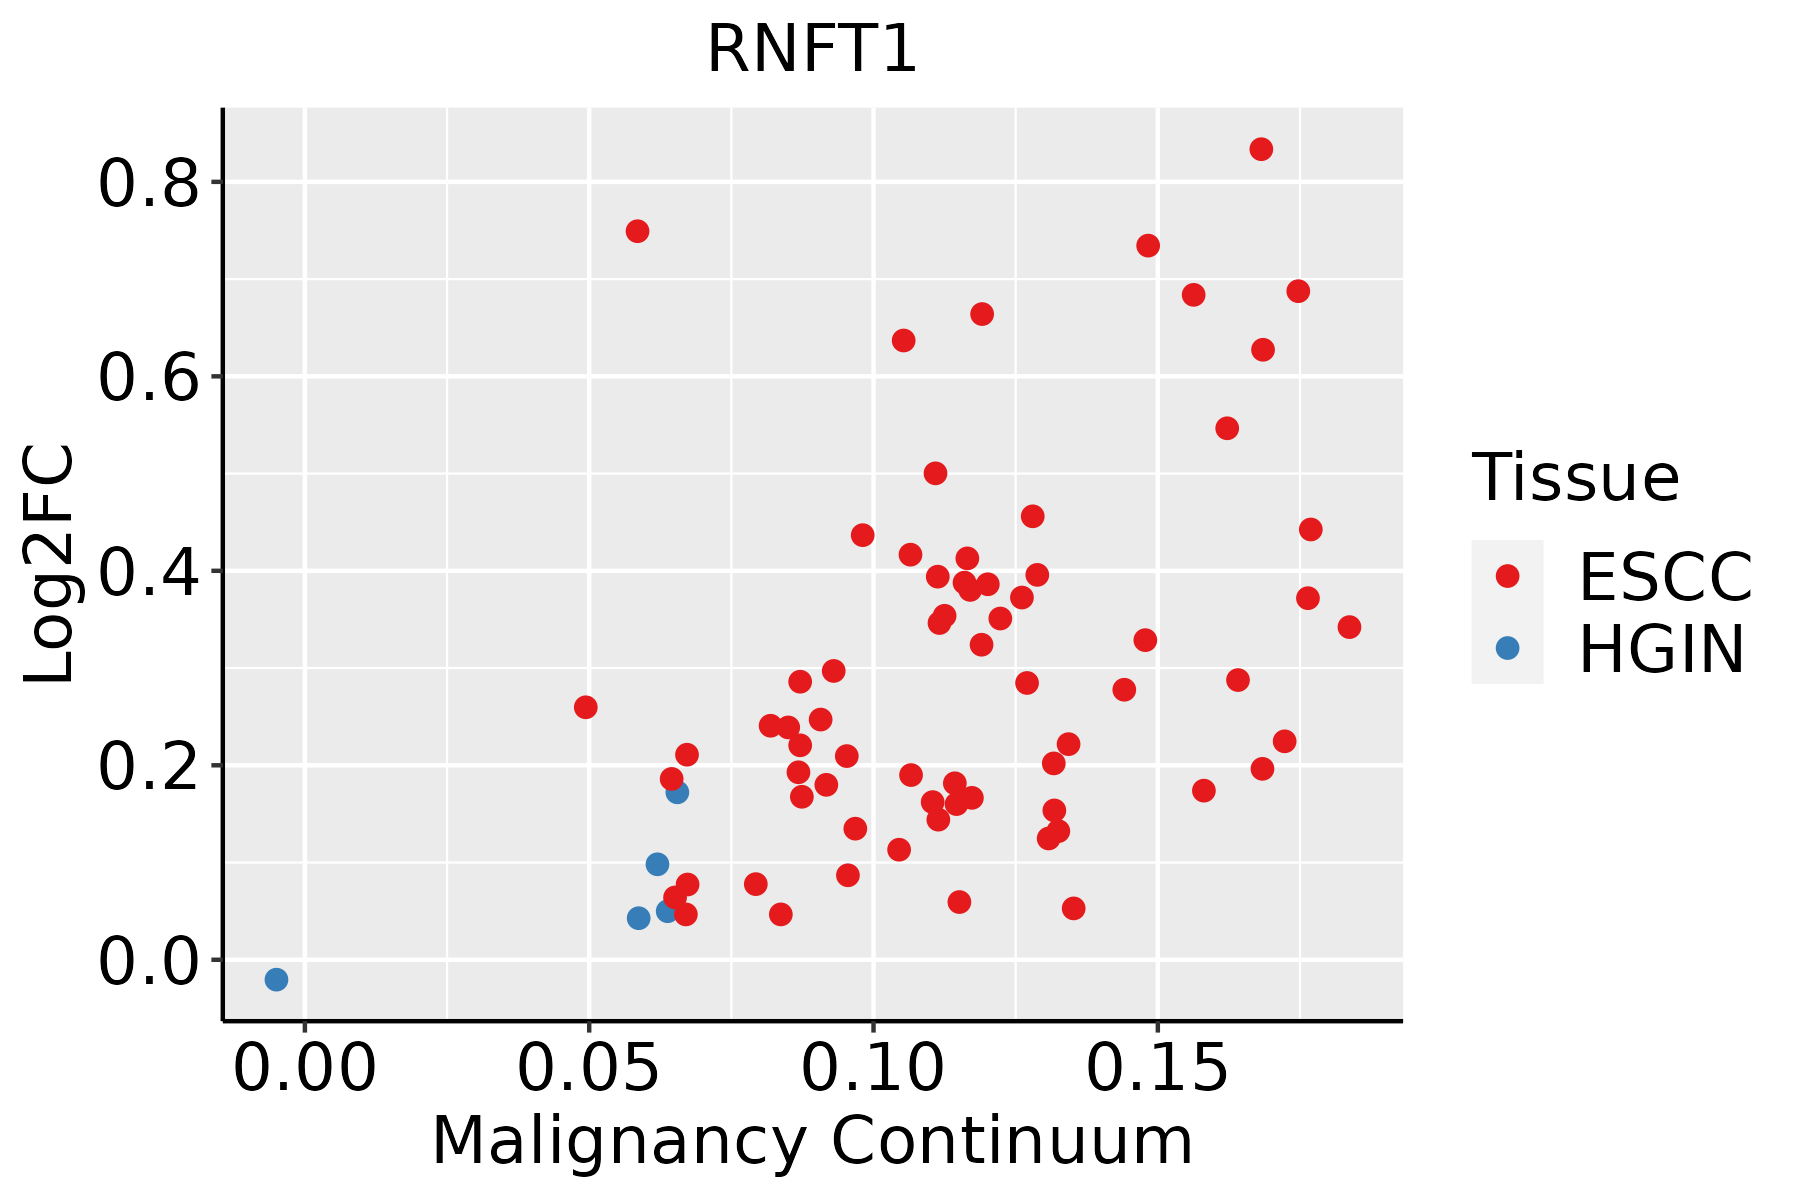 | ESCC: Esophageal squamous cell carcinoma |
| HGIN: High-grade intraepithelial neoplasias | ||
| LGIN: Low-grade intraepithelial neoplasias | ||
| Liver | 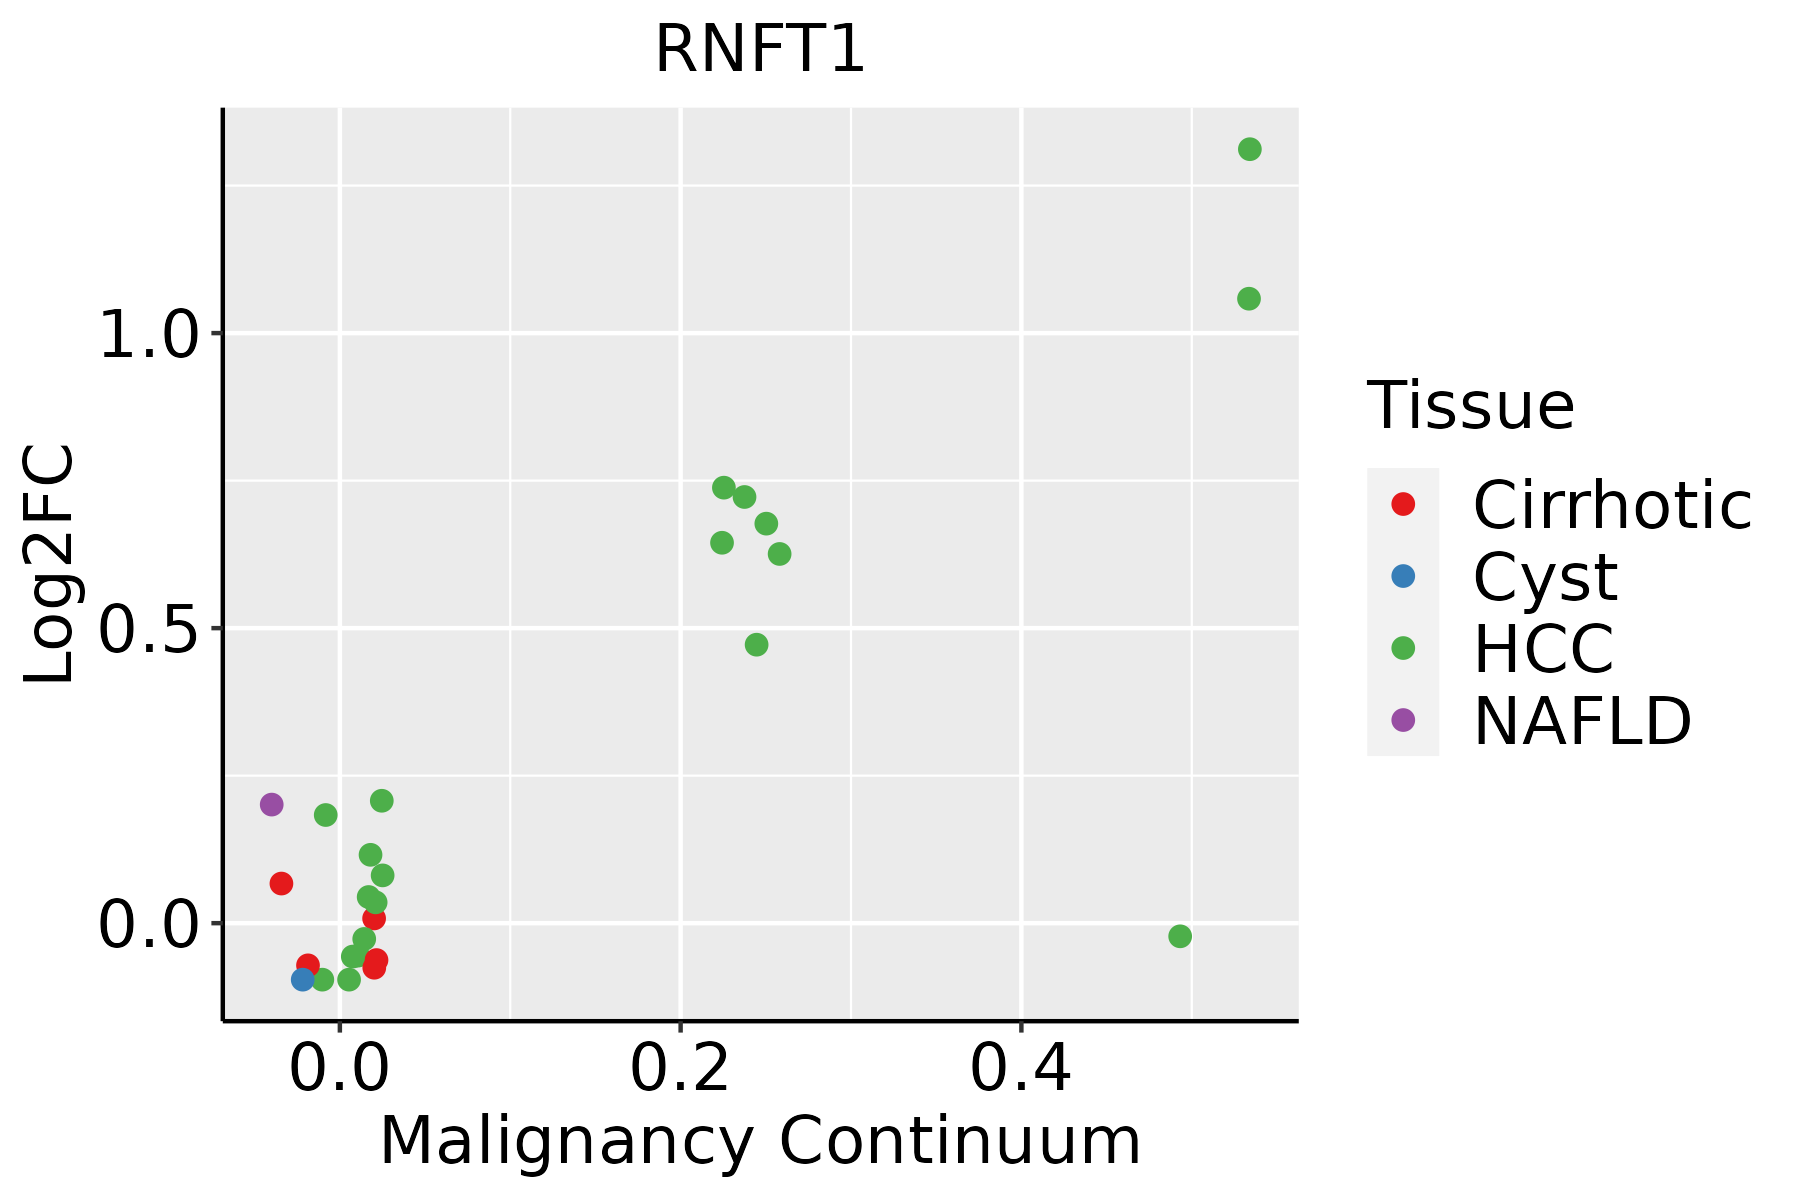 | HCC: Hepatocellular carcinoma |
| NAFLD: Non-alcoholic fatty liver disease |
| ∗log2FC in expression of this searched gene in stem-like cells from each diseased tissue sample relative to stem-like cells in normal samples in each tissue plotted against the malignancy continuum. Samples are colored based on if they are from different disease stage. |
Top |
Malignant transformation related pathway analysis |
| Find out the enriched GO biological processes and KEGG pathways involved in transition from healthy to precancer to cancer |
| Tissue | Disease Stage | Enriched GO biological Processes |
| Colorectum | AD |  |
| Colorectum | SER |  |
| Colorectum | MSS |  |
| Colorectum | MSI-H |  |
| Colorectum | FAP |  |
| ∗Top 15 enriched GO BP terms are showed in the bar plot of each disease state in each tissue. Each row represents a significant GO biological process which is colored according to the -log10(p.adjust). |
| Page: 1 2 3 4 5 6 7 8 9 |
| GO ID | Tissue | Disease Stage | Description | Gene Ratio | Bg Ratio | pvalue | p.adjust | Count |
| GO:0010498111 | Esophagus | ESCC | proteasomal protein catabolic process | 369/8552 | 490/18723 | 1.13e-41 | 1.80e-38 | 369 |
| GO:0042176111 | Esophagus | ESCC | regulation of protein catabolic process | 280/8552 | 391/18723 | 8.65e-26 | 2.39e-23 | 280 |
| GO:0009896111 | Esophagus | ESCC | positive regulation of catabolic process | 332/8552 | 492/18723 | 4.36e-23 | 9.22e-21 | 332 |
| GO:0034976111 | Esophagus | ESCC | response to endoplasmic reticulum stress | 192/8552 | 256/18723 | 7.15e-22 | 1.30e-19 | 192 |
| GO:0031331111 | Esophagus | ESCC | positive regulation of cellular catabolic process | 292/8552 | 427/18723 | 8.67e-22 | 1.53e-19 | 292 |
| GO:1903362111 | Esophagus | ESCC | regulation of cellular protein catabolic process | 188/8552 | 255/18723 | 5.12e-20 | 6.62e-18 | 188 |
| GO:0045862111 | Esophagus | ESCC | positive regulation of proteolysis | 256/8552 | 372/18723 | 7.88e-20 | 9.43e-18 | 256 |
| GO:1903050111 | Esophagus | ESCC | regulation of proteolysis involved in cellular protein catabolic process | 163/8552 | 221/18723 | 1.44e-17 | 1.27e-15 | 163 |
| GO:0061136111 | Esophagus | ESCC | regulation of proteasomal protein catabolic process | 142/8552 | 187/18723 | 2.40e-17 | 2.00e-15 | 142 |
| GO:0045732111 | Esophagus | ESCC | positive regulation of protein catabolic process | 167/8552 | 231/18723 | 1.47e-16 | 1.14e-14 | 167 |
| GO:1903364111 | Esophagus | ESCC | positive regulation of cellular protein catabolic process | 117/8552 | 155/18723 | 3.25e-14 | 1.66e-12 | 117 |
| GO:1901800110 | Esophagus | ESCC | positive regulation of proteasomal protein catabolic process | 91/8552 | 114/18723 | 6.74e-14 | 3.34e-12 | 91 |
| GO:1903052110 | Esophagus | ESCC | positive regulation of proteolysis involved in cellular protein catabolic process | 101/8552 | 133/18723 | 9.58e-13 | 4.19e-11 | 101 |
| GO:003650315 | Esophagus | ESCC | ERAD pathway | 82/8552 | 107/18723 | 5.80e-11 | 1.84e-09 | 82 |
| GO:1905897111 | Esophagus | ESCC | regulation of response to endoplasmic reticulum stress | 63/8552 | 82/18723 | 8.16e-09 | 1.66e-07 | 63 |
| GO:190589813 | Esophagus | ESCC | positive regulation of response to endoplasmic reticulum stress | 29/8552 | 35/18723 | 6.61e-06 | 6.75e-05 | 29 |
| GO:19042943 | Esophagus | ESCC | positive regulation of ERAD pathway | 13/8552 | 14/18723 | 3.02e-04 | 1.81e-03 | 13 |
| GO:00518658 | Esophagus | ESCC | protein autoubiquitination | 47/8552 | 73/18723 | 9.72e-04 | 4.93e-03 | 47 |
| GO:19042922 | Esophagus | ESCC | regulation of ERAD pathway | 16/8552 | 20/18723 | 1.85e-03 | 8.40e-03 | 16 |
| GO:001049822 | Liver | HCC | proteasomal protein catabolic process | 351/7958 | 490/18723 | 6.92e-40 | 1.46e-36 | 351 |
| Page: 1 2 |
| Pathway ID | Tissue | Disease Stage | Description | Gene Ratio | Bg Ratio | pvalue | p.adjust | qvalue | Count |
| Page: 1 |
Top |
Cell-cell communication analysis |
| Identification of potential cell-cell interactions between two cell types and their ligand-receptor pairs for different disease states |
| Ligand | Receptor | LRpair | Pathway | Tissue | Disease Stage |
| Page: 1 |
Top |
Single-cell gene regulatory network inference analysis |
| Find out the significant the regulons (TFs) and the target genes of each regulon across cell types for different disease states |
| TF | Cell Type | Tissue | Disease Stage | Target Gene | RSS | Regulon Activity |
| ∗The dot plots of a searched regulon are shown for all cell subpopulations in each disease state of each tissue based on the regulon specific score inferred using pySCENIC and by calculating the average expression. |
| Page: 1 |
Top |
Somatic mutation of malignant transformation related genes |
| Annotation of somatic variants for genes involved in malignant transformation |
| Hugo Symbol | Variant Class | Variant Classification | dbSNP RS | HGVSc | HGVSp | HGVSp Short | SWISSPROT | BIOTYPE | SIFT | PolyPhen | Tumor Sample Barcode | Tissue | Histology | Sex | Age | Stage | Therapy Types | Drugs | Outcome |
| RNFT1 | SNV | Missense_Mutation | novel | c.515N>A | p.Gly172Glu | p.G172E | Q5M7Z0 | protein_coding | deleterious(0) | probably_damaging(0.989) | TCGA-AN-A046-01 | Breast | breast invasive carcinoma | Female | >=65 | I/II | Unknown | Unknown | SD |
| RNFT1 | SNV | Missense_Mutation | c.1095N>C | p.Lys365Asn | p.K365N | Q5M7Z0 | protein_coding | tolerated(0.13) | possibly_damaging(0.543) | TCGA-BH-A0DZ-01 | Breast | breast invasive carcinoma | Female | <65 | I/II | Chemotherapy | docetaxel | SD | |
| RNFT1 | SNV | Missense_Mutation | c.98N>G | p.Lys33Arg | p.K33R | Q5M7Z0 | protein_coding | tolerated(0.29) | benign(0.037) | TCGA-BH-A18G-01 | Breast | breast invasive carcinoma | Female | >=65 | I/II | Unknown | Unknown | SD | |
| RNFT1 | SNV | Missense_Mutation | novel | c.1205G>T | p.Trp402Leu | p.W402L | Q5M7Z0 | protein_coding | deleterious(0) | possibly_damaging(0.783) | TCGA-LL-A5YN-01 | Breast | breast invasive carcinoma | Female | <65 | I/II | Chemotherapy | carboplatin | SD |
| RNFT1 | insertion | Nonsense_Mutation | novel | c.168_169insCAAACTTGTTATGCAGCATATAACAGGTAGG | p.Ala57GlnfsTer10 | p.A57Qfs*10 | Q5M7Z0 | protein_coding | TCGA-A8-A08H-01 | Breast | breast invasive carcinoma | Female | >=65 | I/II | Unknown | Unknown | SD | ||
| RNFT1 | insertion | In_Frame_Ins | novel | c.1181_1182insGAA | p.Phe394delinsLeuAsn | p.F394delinsLN | Q5M7Z0 | protein_coding | TCGA-BH-A0H7-01 | Breast | breast invasive carcinoma | Female | >=65 | III/IV | Chemotherapy | doxorubicin | SD | ||
| RNFT1 | insertion | Nonsense_Mutation | novel | c.1180_1181insAAGACAAAAGCTAAACTAGCAAA | p.Phe394Ter | p.F394* | Q5M7Z0 | protein_coding | TCGA-BH-A0H7-01 | Breast | breast invasive carcinoma | Female | >=65 | III/IV | Chemotherapy | doxorubicin | SD | ||
| RNFT1 | SNV | Missense_Mutation | novel | c.91N>A | p.Glu31Lys | p.E31K | Q5M7Z0 | protein_coding | tolerated(0.62) | benign(0) | TCGA-HM-A4S6-01 | Cervix | cervical & endocervical cancer | Female | <65 | III/IV | Chemotherapy | cisplatin | CR |
| RNFT1 | SNV | Missense_Mutation | c.557N>T | p.Ala186Val | p.A186V | Q5M7Z0 | protein_coding | tolerated(0.22) | benign(0.152) | TCGA-A6-6650-01 | Colorectum | colon adenocarcinoma | Female | >=65 | I/II | Unknown | Unknown | SD | |
| RNFT1 | SNV | Missense_Mutation | c.121A>G | p.Asn41Asp | p.N41D | Q5M7Z0 | protein_coding | tolerated(0.33) | benign(0.003) | TCGA-AA-3821-01 | Colorectum | colon adenocarcinoma | Female | >=65 | I/II | Unknown | Unknown | SD |
| Page: 1 2 3 4 |
Top |
Related drugs of malignant transformation related genes |
| Identification of chemicals and drugs interact with genes involved in malignant transfromation |
| (DGIdb 4.0) |
| Entrez ID | Symbol | Category | Interaction Types | Drug Claim Name | Drug Name | PMIDs |
| Page: 1 |

Copyright 2023-Present -The University of Texas Health Science Center at Houston |