
|
|||||
|
 | |
| |
| |
| |
| |
| |
|
Gene: RNF8 |
Gene summary for RNF8 |
| Gene information | Species | Human | Gene symbol | RNF8 | Gene ID | 9025 |
| Gene name | ring finger protein 8 | |
| Gene Alias | hRNF8 | |
| Cytomap | 6p21.2 | |
| Gene Type | protein-coding | GO ID | GO:0000003 | UniProtAcc | O76064 |
Top |
Malignant transformation analysis |
| Identification of the aberrant gene expression in precancerous and cancerous lesions by comparing the gene expression of stem-like cells in diseased tissues with normal stem cells |
| Entrez ID | Symbol | Replicates | Species | Organ | Tissue | Adj P-value | Log2FC | Malignancy |
| 9025 | RNF8 | LZE2T | Human | Esophagus | ESCC | 4.03e-05 | 9.02e-01 | 0.082 |
| 9025 | RNF8 | LZE4T | Human | Esophagus | ESCC | 6.98e-10 | 3.77e-01 | 0.0811 |
| 9025 | RNF8 | LZE7T | Human | Esophagus | ESCC | 1.26e-06 | 3.82e-01 | 0.0667 |
| 9025 | RNF8 | LZE8T | Human | Esophagus | ESCC | 1.23e-03 | 1.04e-01 | 0.067 |
| 9025 | RNF8 | LZE20T | Human | Esophagus | ESCC | 3.03e-07 | 1.76e-01 | 0.0662 |
| 9025 | RNF8 | LZE24T | Human | Esophagus | ESCC | 7.56e-16 | 3.57e-01 | 0.0596 |
| 9025 | RNF8 | LZE6T | Human | Esophagus | ESCC | 7.59e-07 | 3.05e-01 | 0.0845 |
| 9025 | RNF8 | P1T-E | Human | Esophagus | ESCC | 2.24e-06 | 3.18e-01 | 0.0875 |
| 9025 | RNF8 | P2T-E | Human | Esophagus | ESCC | 1.07e-36 | 6.15e-01 | 0.1177 |
| 9025 | RNF8 | P4T-E | Human | Esophagus | ESCC | 1.00e-26 | 6.46e-01 | 0.1323 |
| 9025 | RNF8 | P5T-E | Human | Esophagus | ESCC | 7.10e-14 | 1.98e-01 | 0.1327 |
| 9025 | RNF8 | P8T-E | Human | Esophagus | ESCC | 2.46e-14 | 2.55e-01 | 0.0889 |
| 9025 | RNF8 | P9T-E | Human | Esophagus | ESCC | 1.13e-14 | 2.92e-01 | 0.1131 |
| 9025 | RNF8 | P10T-E | Human | Esophagus | ESCC | 1.34e-16 | 2.07e-01 | 0.116 |
| 9025 | RNF8 | P11T-E | Human | Esophagus | ESCC | 7.43e-14 | 5.10e-01 | 0.1426 |
| 9025 | RNF8 | P12T-E | Human | Esophagus | ESCC | 3.38e-26 | 5.36e-01 | 0.1122 |
| 9025 | RNF8 | P15T-E | Human | Esophagus | ESCC | 1.00e-07 | 2.36e-01 | 0.1149 |
| 9025 | RNF8 | P16T-E | Human | Esophagus | ESCC | 4.14e-12 | 3.06e-01 | 0.1153 |
| 9025 | RNF8 | P17T-E | Human | Esophagus | ESCC | 2.31e-06 | 2.21e-01 | 0.1278 |
| 9025 | RNF8 | P20T-E | Human | Esophagus | ESCC | 1.23e-13 | 1.81e-01 | 0.1124 |
| Page: 1 2 3 4 5 |
| Tissue | Expression Dynamics | Abbreviation |
| Esophagus | 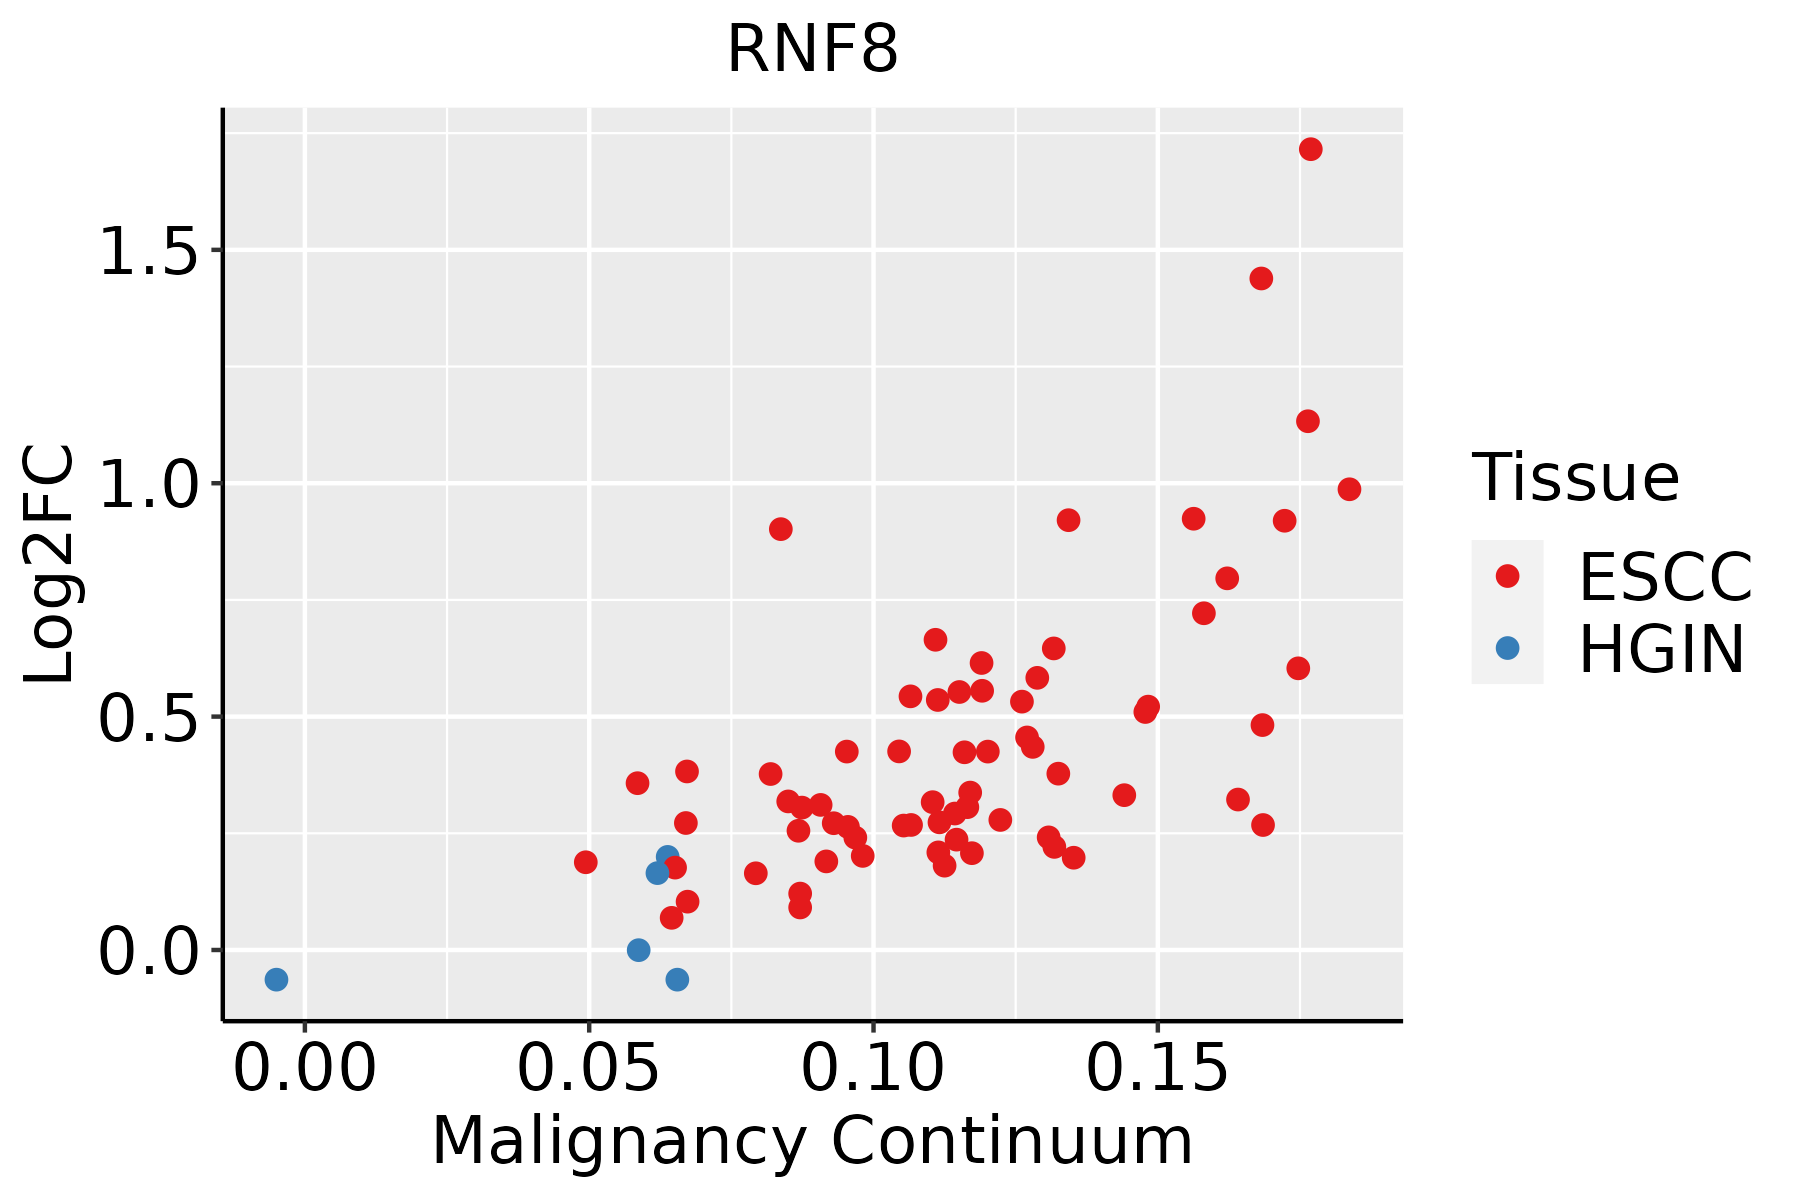 | ESCC: Esophageal squamous cell carcinoma |
| HGIN: High-grade intraepithelial neoplasias | ||
| LGIN: Low-grade intraepithelial neoplasias | ||
| Oral Cavity | 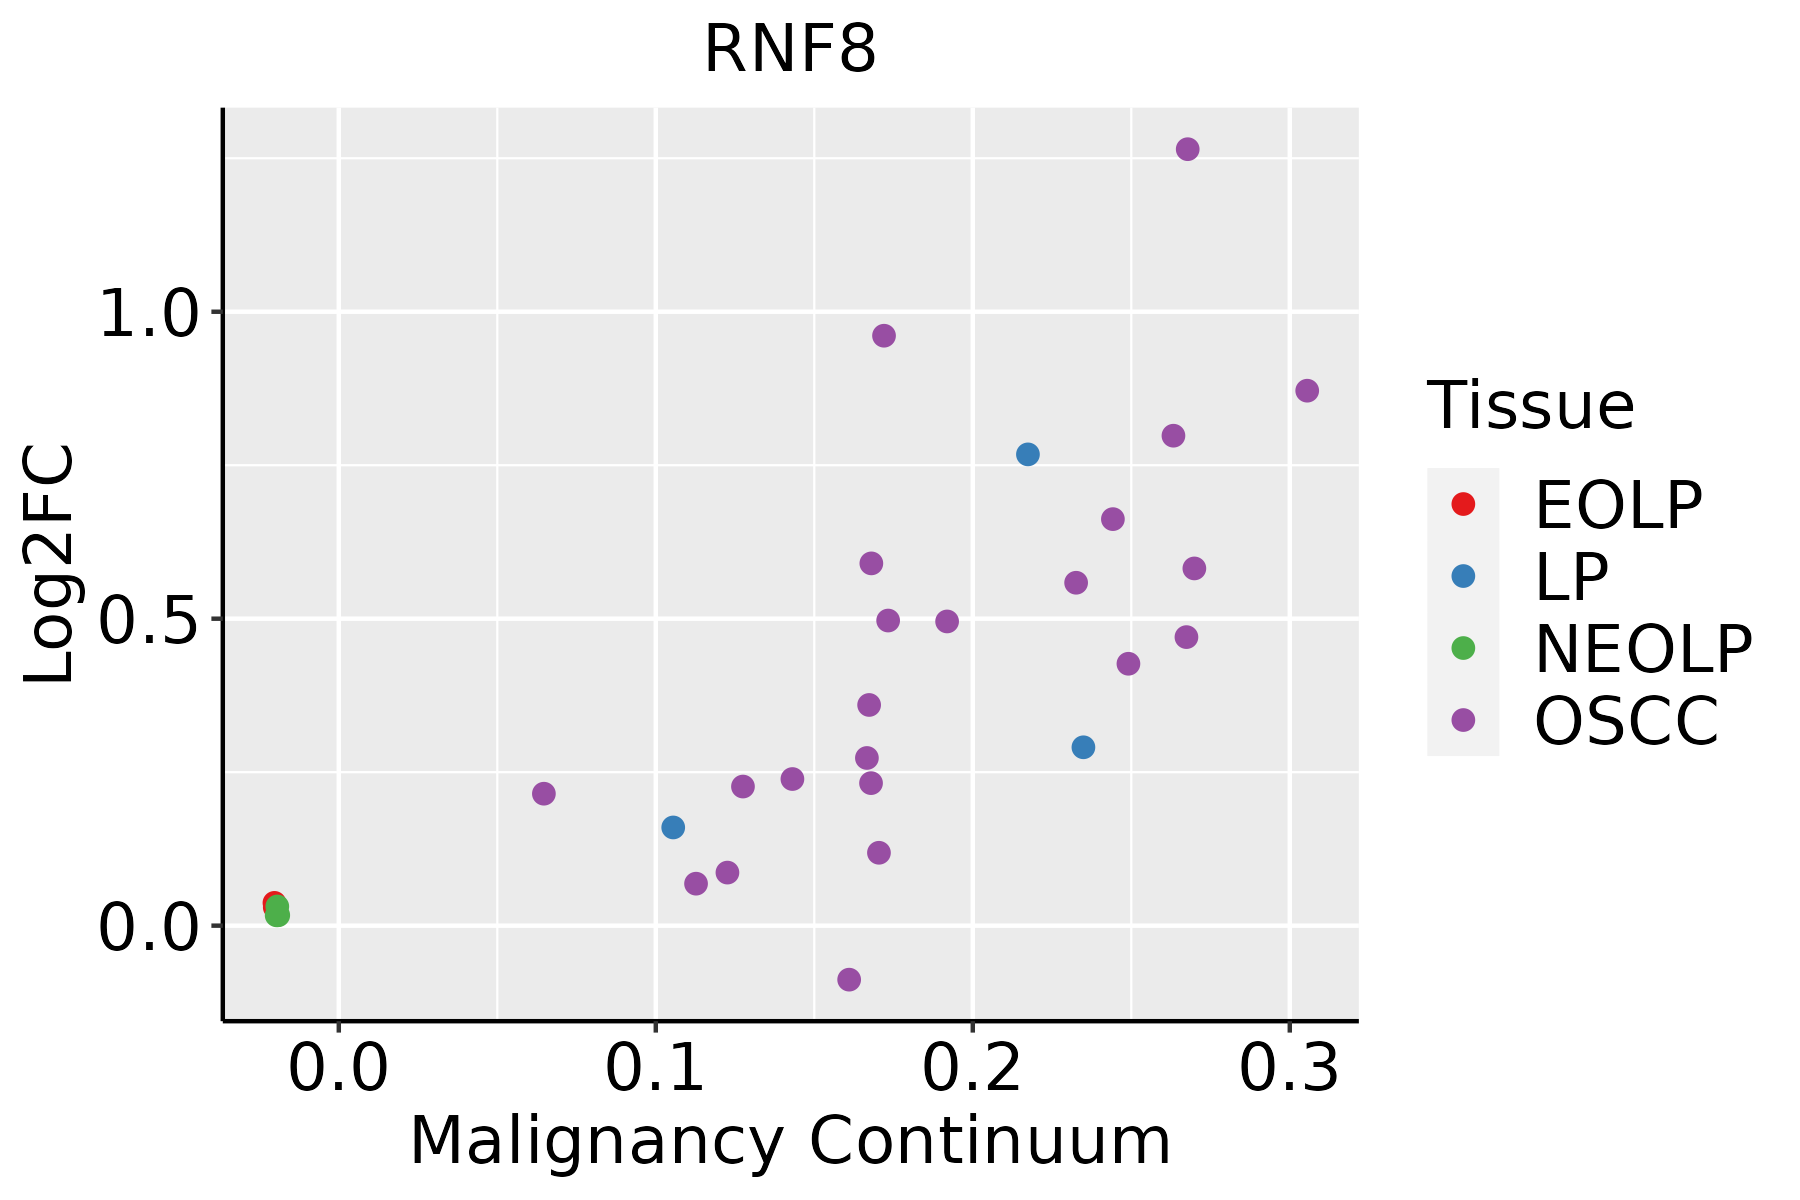 | EOLP: Erosive Oral lichen planus |
| LP: leukoplakia | ||
| NEOLP: Non-erosive oral lichen planus | ||
| OSCC: Oral squamous cell carcinoma | ||
| Skin |  | AK: Actinic keratosis |
| cSCC: Cutaneous squamous cell carcinoma | ||
| SCCIS:squamous cell carcinoma in situ | ||
| Thyroid |  | ATC: Anaplastic thyroid cancer |
| HT: Hashimoto's thyroiditis | ||
| PTC: Papillary thyroid cancer |
| ∗log2FC in expression of this searched gene in stem-like cells from each diseased tissue sample relative to stem-like cells in normal samples in each tissue plotted against the malignancy continuum. Samples are colored based on if they are from different disease stage. |
Top |
Malignant transformation related pathway analysis |
| Find out the enriched GO biological processes and KEGG pathways involved in transition from healthy to precancer to cancer |
| Tissue | Disease Stage | Enriched GO biological Processes |
| Colorectum | AD |  |
| Colorectum | SER |  |
| Colorectum | MSS |  |
| Colorectum | MSI-H |  |
| Colorectum | FAP |  |
| ∗Top 15 enriched GO BP terms are showed in the bar plot of each disease state in each tissue. Each row represents a significant GO biological process which is colored according to the -log10(p.adjust). |
| Page: 1 2 3 4 5 6 7 8 9 |
| GO ID | Tissue | Disease Stage | Description | Gene Ratio | Bg Ratio | pvalue | p.adjust | Count |
| GO:001657015 | Esophagus | ESCC | histone modification | 323/8552 | 463/18723 | 2.61e-26 | 7.88e-24 | 323 |
| GO:000020917 | Esophagus | ESCC | protein polyubiquitination | 170/8552 | 236/18723 | 1.40e-16 | 1.09e-14 | 170 |
| GO:000635414 | Esophagus | ESCC | DNA-templated transcription, elongation | 76/8552 | 91/18723 | 8.35e-14 | 4.11e-12 | 76 |
| GO:005105215 | Esophagus | ESCC | regulation of DNA metabolic process | 232/8552 | 359/18723 | 2.40e-13 | 1.13e-11 | 232 |
| GO:001021217 | Esophagus | ESCC | response to ionizing radiation | 110/8552 | 148/18723 | 1.11e-12 | 4.78e-11 | 110 |
| GO:005105417 | Esophagus | ESCC | positive regulation of DNA metabolic process | 139/8552 | 201/18723 | 1.20e-11 | 4.33e-10 | 139 |
| GO:000931419 | Esophagus | ESCC | response to radiation | 277/8552 | 456/18723 | 4.42e-11 | 1.43e-09 | 277 |
| GO:007093617 | Esophagus | ESCC | protein K48-linked ubiquitination | 55/8552 | 65/18723 | 8.42e-11 | 2.58e-09 | 55 |
| GO:000699713 | Esophagus | ESCC | nucleus organization | 96/8552 | 133/18723 | 4.66e-10 | 1.21e-08 | 96 |
| GO:2001020110 | Esophagus | ESCC | regulation of response to DNA damage stimulus | 145/8552 | 219/18723 | 5.97e-10 | 1.50e-08 | 145 |
| GO:000636814 | Esophagus | ESCC | transcription elongation from RNA polymerase II promoter | 56/8552 | 69/18723 | 1.40e-09 | 3.30e-08 | 56 |
| GO:003278412 | Esophagus | ESCC | regulation of DNA-templated transcription, elongation | 45/8552 | 53/18723 | 3.64e-09 | 7.61e-08 | 45 |
| GO:001657414 | Esophagus | ESCC | histone ubiquitination | 40/8552 | 47/18723 | 2.40e-08 | 4.55e-07 | 40 |
| GO:000632517 | Esophagus | ESCC | chromatin organization | 240/8552 | 409/18723 | 6.52e-08 | 1.14e-06 | 240 |
| GO:007053413 | Esophagus | ESCC | protein K63-linked ubiquitination | 44/8552 | 56/18723 | 4.84e-07 | 6.50e-06 | 44 |
| GO:003424312 | Esophagus | ESCC | regulation of transcription elongation from RNA polymerase II promoter | 28/8552 | 32/18723 | 1.02e-06 | 1.29e-05 | 28 |
| GO:00063024 | Esophagus | ESCC | double-strand break repair | 152/8552 | 251/18723 | 1.33e-06 | 1.62e-05 | 152 |
| GO:003352213 | Esophagus | ESCC | histone H2A ubiquitination | 23/8552 | 26/18723 | 6.82e-06 | 6.90e-05 | 23 |
| GO:20010228 | Esophagus | ESCC | positive regulation of response to DNA damage stimulus | 69/8552 | 105/18723 | 2.66e-05 | 2.22e-04 | 69 |
| GO:00062826 | Esophagus | ESCC | regulation of DNA repair | 82/8552 | 130/18723 | 4.65e-05 | 3.66e-04 | 82 |
| Page: 1 2 3 4 5 6 7 8 |
| Pathway ID | Tissue | Disease Stage | Description | Gene Ratio | Bg Ratio | pvalue | p.adjust | qvalue | Count |
| Page: 1 |
Top |
Cell-cell communication analysis |
| Identification of potential cell-cell interactions between two cell types and their ligand-receptor pairs for different disease states |
| Ligand | Receptor | LRpair | Pathway | Tissue | Disease Stage |
| Page: 1 |
Top |
Single-cell gene regulatory network inference analysis |
| Find out the significant the regulons (TFs) and the target genes of each regulon across cell types for different disease states |
| TF | Cell Type | Tissue | Disease Stage | Target Gene | RSS | Regulon Activity |
| ∗The dot plots of a searched regulon are shown for all cell subpopulations in each disease state of each tissue based on the regulon specific score inferred using pySCENIC and by calculating the average expression. |
| Page: 1 |
Top |
Somatic mutation of malignant transformation related genes |
| Annotation of somatic variants for genes involved in malignant transformation |
| Hugo Symbol | Variant Class | Variant Classification | dbSNP RS | HGVSc | HGVSp | HGVSp Short | SWISSPROT | BIOTYPE | SIFT | PolyPhen | Tumor Sample Barcode | Tissue | Histology | Sex | Age | Stage | Therapy Types | Drugs | Outcome |
| RNF8 | SNV | Missense_Mutation | novel | c.544G>A | p.Glu182Lys | p.E182K | O76064 | protein_coding | tolerated(0.16) | benign(0.003) | TCGA-3C-AALI-01 | Breast | breast invasive carcinoma | Female | <65 | I/II | Unspecific | Poly E | Complete Response |
| RNF8 | SNV | Missense_Mutation | novel | c.575A>G | p.Lys192Arg | p.K192R | O76064 | protein_coding | tolerated(0.41) | benign(0) | TCGA-AN-A046-01 | Breast | breast invasive carcinoma | Female | >=65 | I/II | Unknown | Unknown | SD |
| RNF8 | SNV | Missense_Mutation | c.1199N>G | p.Glu400Gly | p.E400G | O76064 | protein_coding | deleterious(0) | probably_damaging(0.997) | TCGA-D8-A1XQ-01 | Breast | breast invasive carcinoma | Female | >=65 | I/II | Unknown | Unknown | SD | |
| RNF8 | SNV | Missense_Mutation | rs149686329 | c.272G>A | p.Arg91His | p.R91H | O76064 | protein_coding | deleterious(0) | probably_damaging(0.919) | TCGA-2W-A8YY-01 | Cervix | cervical & endocervical cancer | Female | <65 | I/II | Chemotherapy | cisplatin | CR |
| RNF8 | SNV | Missense_Mutation | novel | c.497N>T | p.Ala166Val | p.A166V | O76064 | protein_coding | tolerated(0.07) | benign(0.01) | TCGA-JX-A5QV-01 | Cervix | cervical & endocervical cancer | Female | <65 | I/II | Unknown | Unknown | SD |
| RNF8 | SNV | Missense_Mutation | c.849N>T | p.Lys283Asn | p.K283N | O76064 | protein_coding | tolerated(0.11) | benign(0.012) | TCGA-AA-3510-01 | Colorectum | colon adenocarcinoma | Male | >=65 | I/II | Unknown | Unknown | SD | |
| RNF8 | SNV | Missense_Mutation | novel | c.1076A>C | p.Lys359Thr | p.K359T | O76064 | protein_coding | deleterious(0.02) | benign(0.154) | TCGA-AA-3949-01 | Colorectum | colon adenocarcinoma | Female | >=65 | III/IV | Unknown | Unknown | SD |
| RNF8 | SNV | Missense_Mutation | c.229N>G | p.Met77Val | p.M77V | O76064 | protein_coding | deleterious(0.03) | benign(0.034) | TCGA-AA-A010-01 | Colorectum | colon adenocarcinoma | Female | <65 | I/II | Chemotherapy | folinic | CR | |
| RNF8 | SNV | Missense_Mutation | c.370G>A | p.Val124Ile | p.V124I | O76064 | protein_coding | deleterious(0.02) | benign(0.255) | TCGA-AA-A02R-01 | Colorectum | colon adenocarcinoma | Female | >=65 | I/II | Unknown | Unknown | PD | |
| RNF8 | SNV | Missense_Mutation | rs759453955 | c.503N>A | p.Gly168Asp | p.G168D | O76064 | protein_coding | tolerated(0.06) | benign(0.142) | TCGA-AZ-4315-01 | Colorectum | colon adenocarcinoma | Male | <65 | I/II | Unknown | Unknown | SD |
| Page: 1 2 3 4 5 |
Top |
Related drugs of malignant transformation related genes |
| Identification of chemicals and drugs interact with genes involved in malignant transfromation |
| (DGIdb 4.0) |
| Entrez ID | Symbol | Category | Interaction Types | Drug Claim Name | Drug Name | PMIDs |
| 9025 | RNF8 | KINASE, ENZYME | carboplatin | CARBOPLATIN | 30071039 | |
| 9025 | RNF8 | KINASE, ENZYME | docetaxel | DOCETAXEL | 30071039 | |
| 9025 | RNF8 | KINASE, ENZYME | trastuzumab | TRASTUZUMAB | 30071039 |
| Page: 1 |

Copyright 2023-Present -The University of Texas Health Science Center at Houston |