
|
|||||
|
 | |
| |
| |
| |
| |
| |
|
Gene: RNF7 |
Gene summary for RNF7 |
| Gene information | Species | Human | Gene symbol | RNF7 | Gene ID | 9616 |
| Gene name | ring finger protein 7 | |
| Gene Alias | CKBBP1 | |
| Cytomap | 3q23 | |
| Gene Type | protein-coding | GO ID | GO:0006464 | UniProtAcc | Q9UBF6 |
Top |
Malignant transformation analysis |
| Identification of the aberrant gene expression in precancerous and cancerous lesions by comparing the gene expression of stem-like cells in diseased tissues with normal stem cells |
| Entrez ID | Symbol | Replicates | Species | Organ | Tissue | Adj P-value | Log2FC | Malignancy |
| 9616 | RNF7 | CA_HPV_1 | Human | Cervix | CC | 4.73e-08 | -1.47e-01 | 0.0264 |
| 9616 | RNF7 | CA_HPV_3 | Human | Cervix | CC | 4.06e-09 | 3.14e-01 | 0.0414 |
| 9616 | RNF7 | CCI_1 | Human | Cervix | CC | 2.16e-13 | -6.93e-01 | 0.528 |
| 9616 | RNF7 | CCI_2 | Human | Cervix | CC | 2.43e-12 | -6.93e-01 | 0.5249 |
| 9616 | RNF7 | CCI_3 | Human | Cervix | CC | 1.31e-17 | -6.93e-01 | 0.516 |
| 9616 | RNF7 | CCII_1 | Human | Cervix | CC | 4.93e-24 | -6.93e-01 | 0.3249 |
| 9616 | RNF7 | Tumor | Human | Cervix | CC | 7.86e-07 | 3.11e-01 | 0.1241 |
| 9616 | RNF7 | sample3 | Human | Cervix | CC | 2.17e-03 | 2.46e-01 | 0.1387 |
| 9616 | RNF7 | L1 | Human | Cervix | CC | 1.45e-05 | 2.41e-02 | 0.0802 |
| 9616 | RNF7 | AEH-subject1 | Human | Endometrium | AEH | 1.55e-13 | -3.51e-01 | -0.3059 |
| 9616 | RNF7 | AEH-subject2 | Human | Endometrium | AEH | 3.53e-13 | -3.51e-01 | -0.2525 |
| 9616 | RNF7 | AEH-subject3 | Human | Endometrium | AEH | 1.02e-12 | -4.01e-01 | -0.2576 |
| 9616 | RNF7 | AEH-subject4 | Human | Endometrium | AEH | 5.03e-11 | -3.43e-01 | -0.2657 |
| 9616 | RNF7 | EEC-subject1 | Human | Endometrium | EEC | 3.37e-07 | -2.93e-01 | -0.2682 |
| 9616 | RNF7 | EEC-subject2 | Human | Endometrium | EEC | 2.23e-19 | -4.56e-01 | -0.2607 |
| 9616 | RNF7 | EEC-subject3 | Human | Endometrium | EEC | 1.19e-55 | -4.16e-01 | -0.2525 |
| 9616 | RNF7 | EEC-subject4 | Human | Endometrium | EEC | 1.58e-03 | -1.10e-01 | -0.2571 |
| 9616 | RNF7 | EEC-subject5 | Human | Endometrium | EEC | 2.13e-07 | -1.28e-01 | -0.249 |
| 9616 | RNF7 | GSM5276934 | Human | Endometrium | EEC | 4.99e-04 | -2.63e-01 | -0.0913 |
| 9616 | RNF7 | GSM6177620_NYU_UCEC1_lib1_lib1 | Human | Endometrium | EEC | 1.10e-33 | -1.99e-01 | -0.1869 |
| Page: 1 2 3 4 5 6 7 8 9 |
| Tissue | Expression Dynamics | Abbreviation |
| Cervix |  | CC: Cervix cancer |
| HSIL_HPV: HPV-infected high-grade squamous intraepithelial lesions | ||
| N_HPV: HPV-infected normal cervix | ||
| Endometrium |  | AEH: Atypical endometrial hyperplasia |
| EEC: Endometrioid Cancer | ||
| Esophagus | 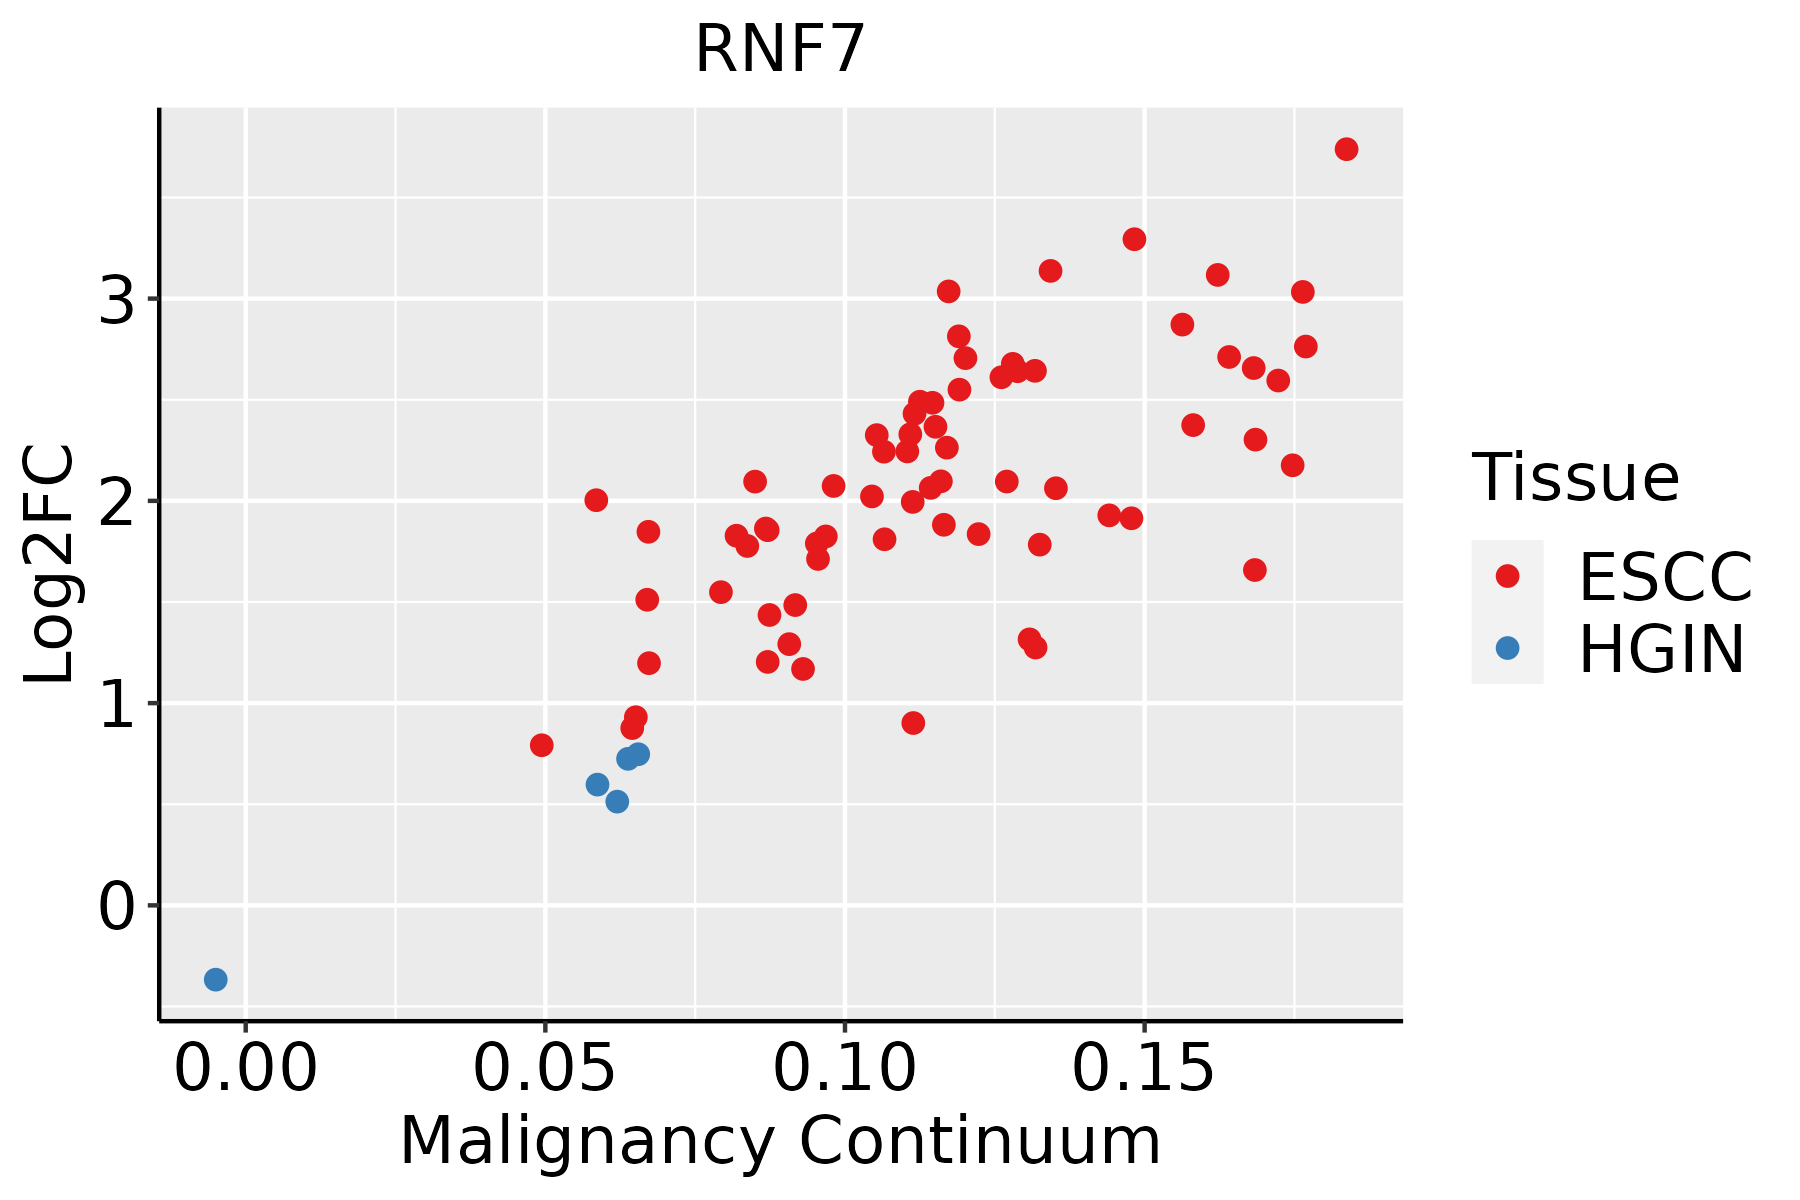 | ESCC: Esophageal squamous cell carcinoma |
| HGIN: High-grade intraepithelial neoplasias | ||
| LGIN: Low-grade intraepithelial neoplasias | ||
| Liver | 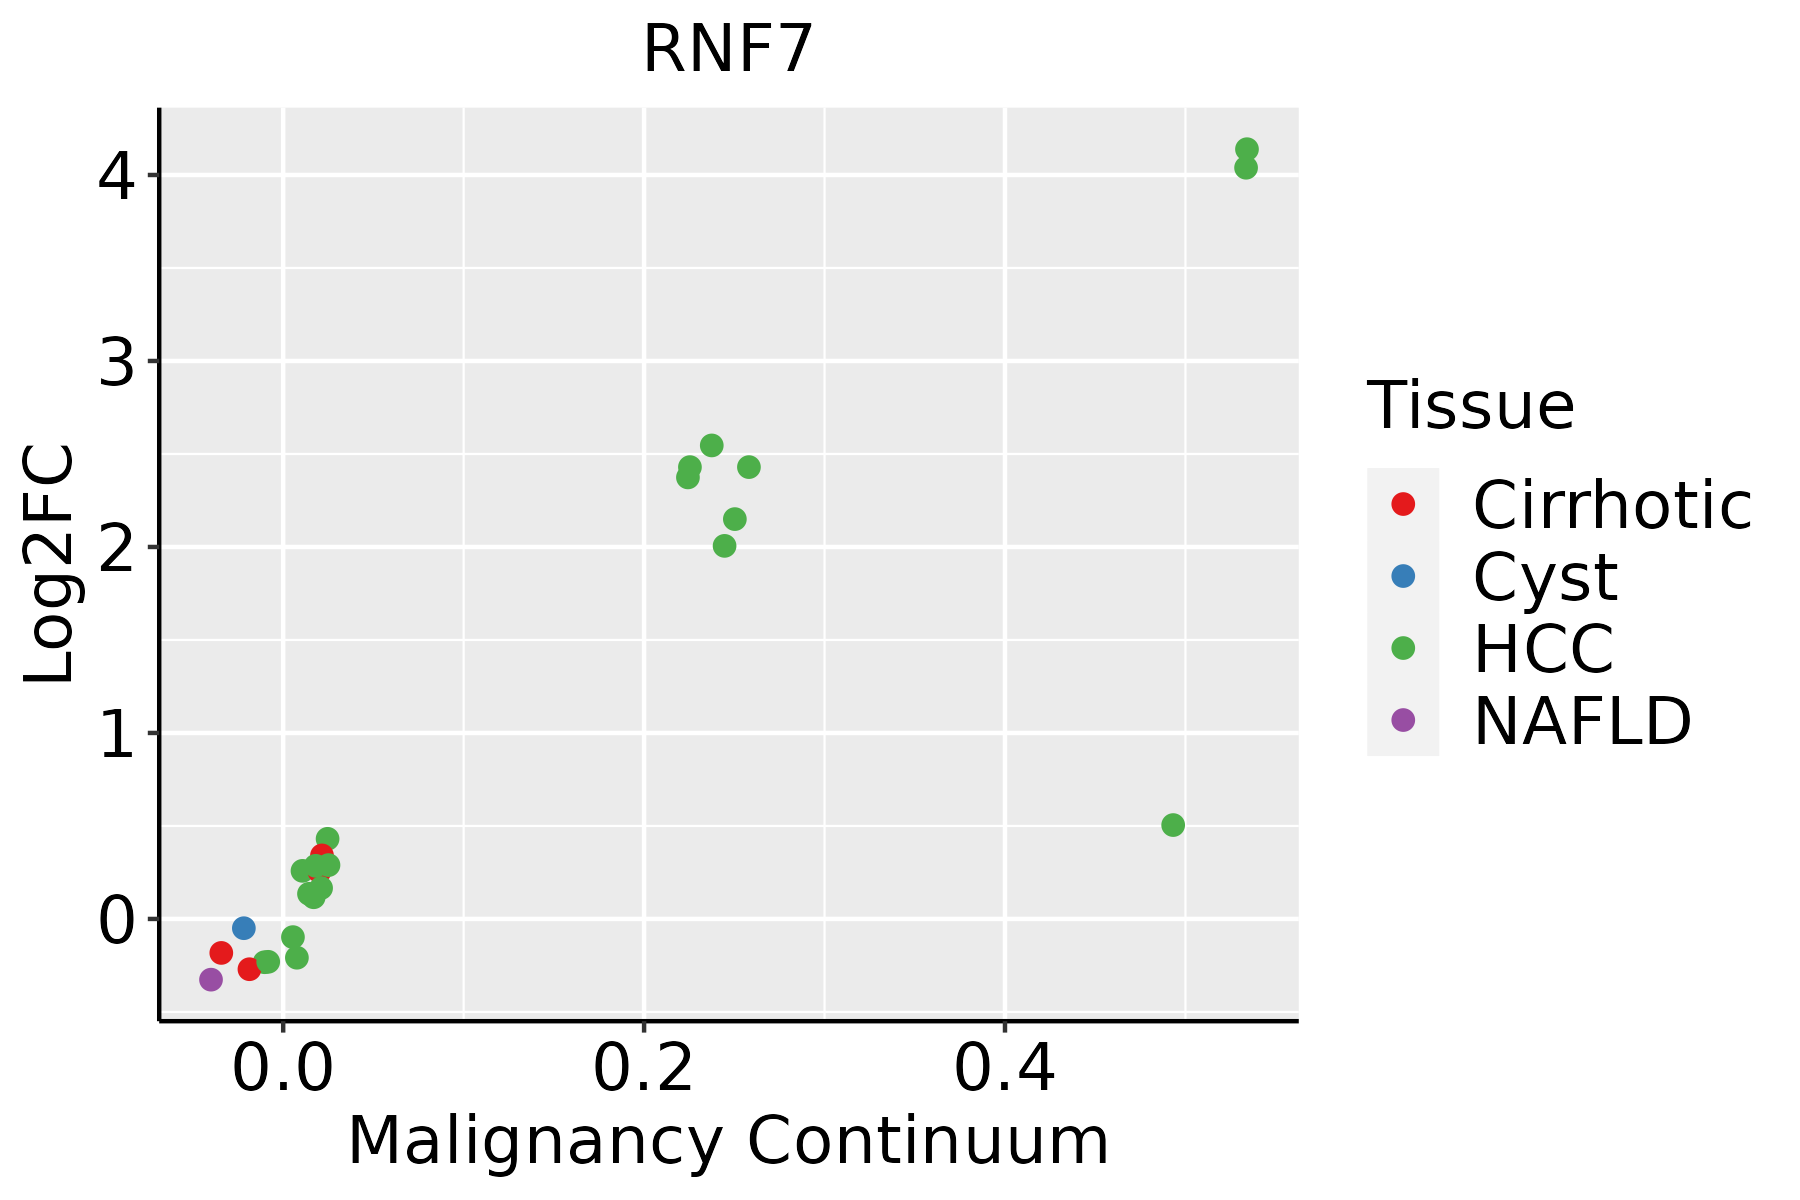 | HCC: Hepatocellular carcinoma |
| NAFLD: Non-alcoholic fatty liver disease | ||
| Oral Cavity | 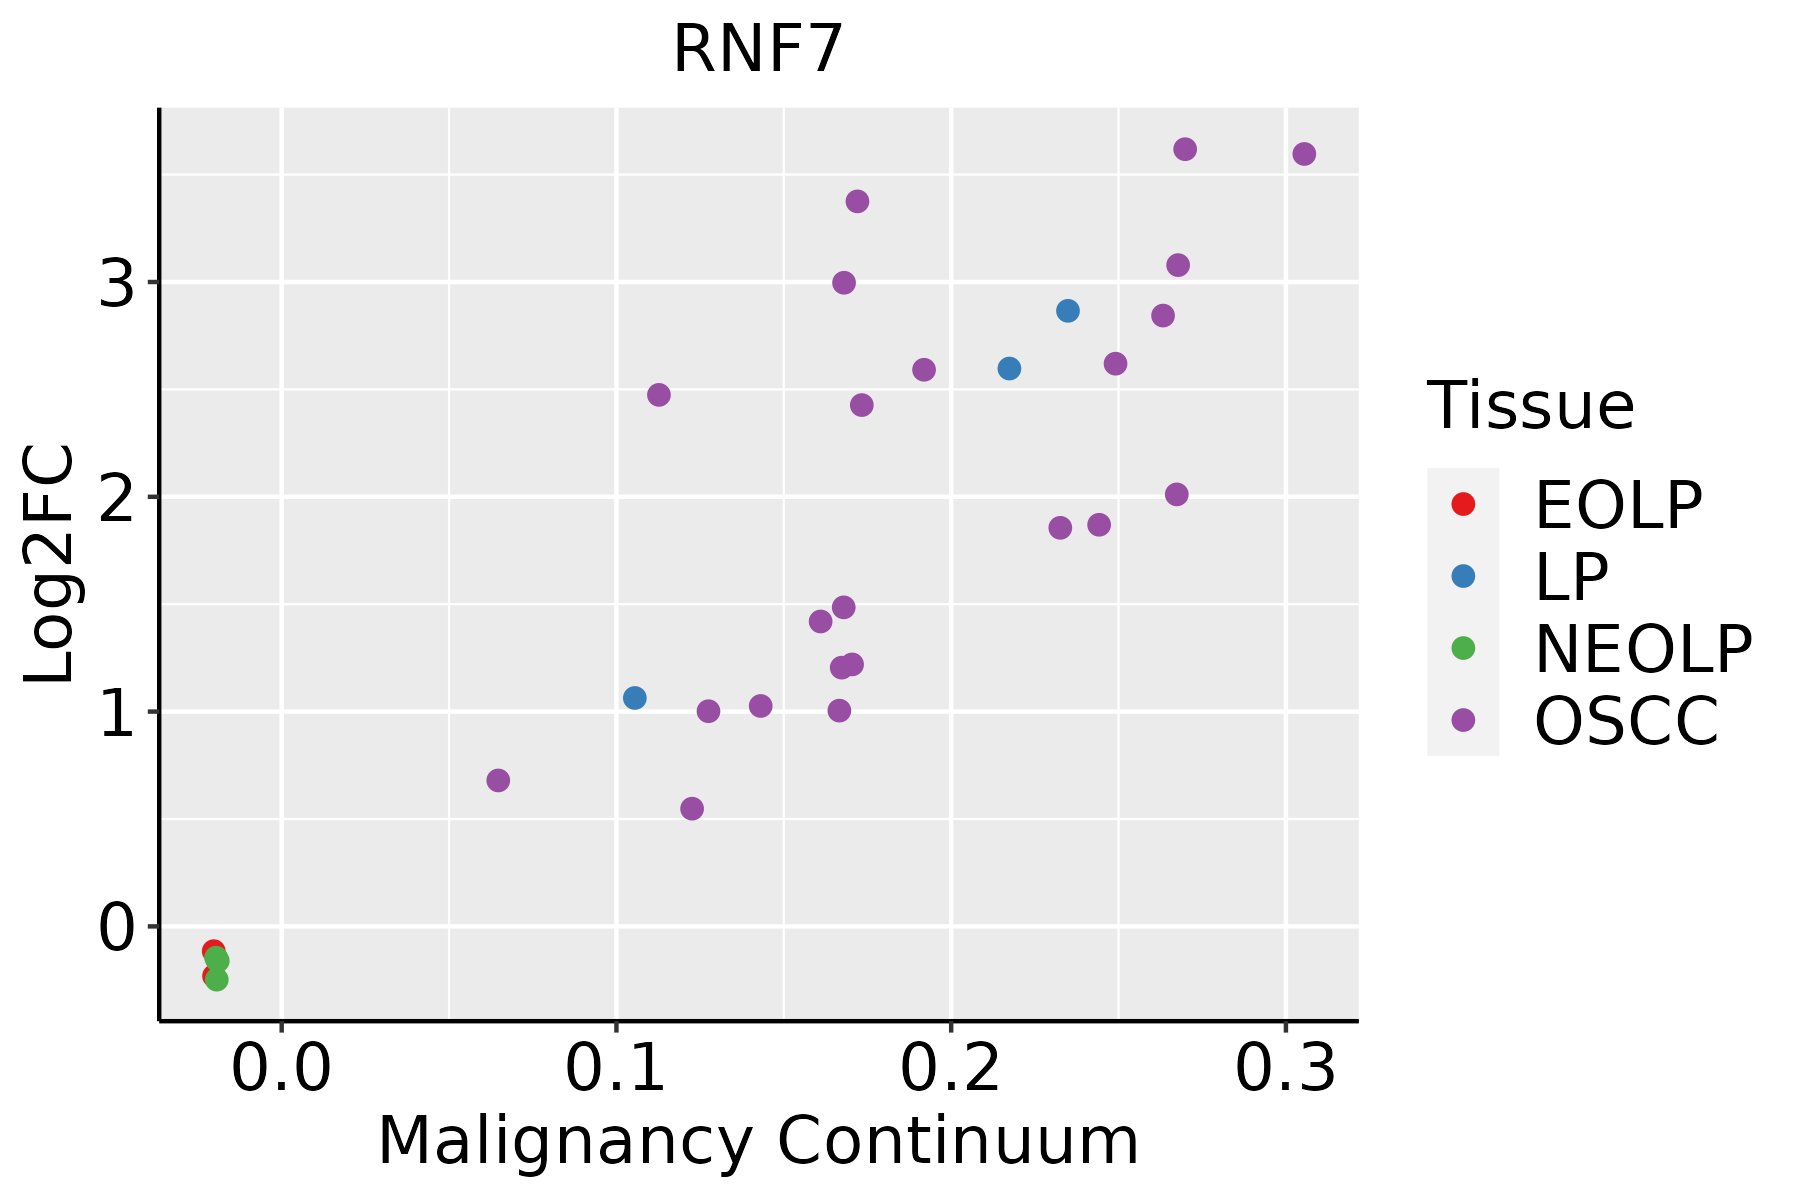 | EOLP: Erosive Oral lichen planus |
| LP: leukoplakia | ||
| NEOLP: Non-erosive oral lichen planus | ||
| OSCC: Oral squamous cell carcinoma | ||
| Prostate | 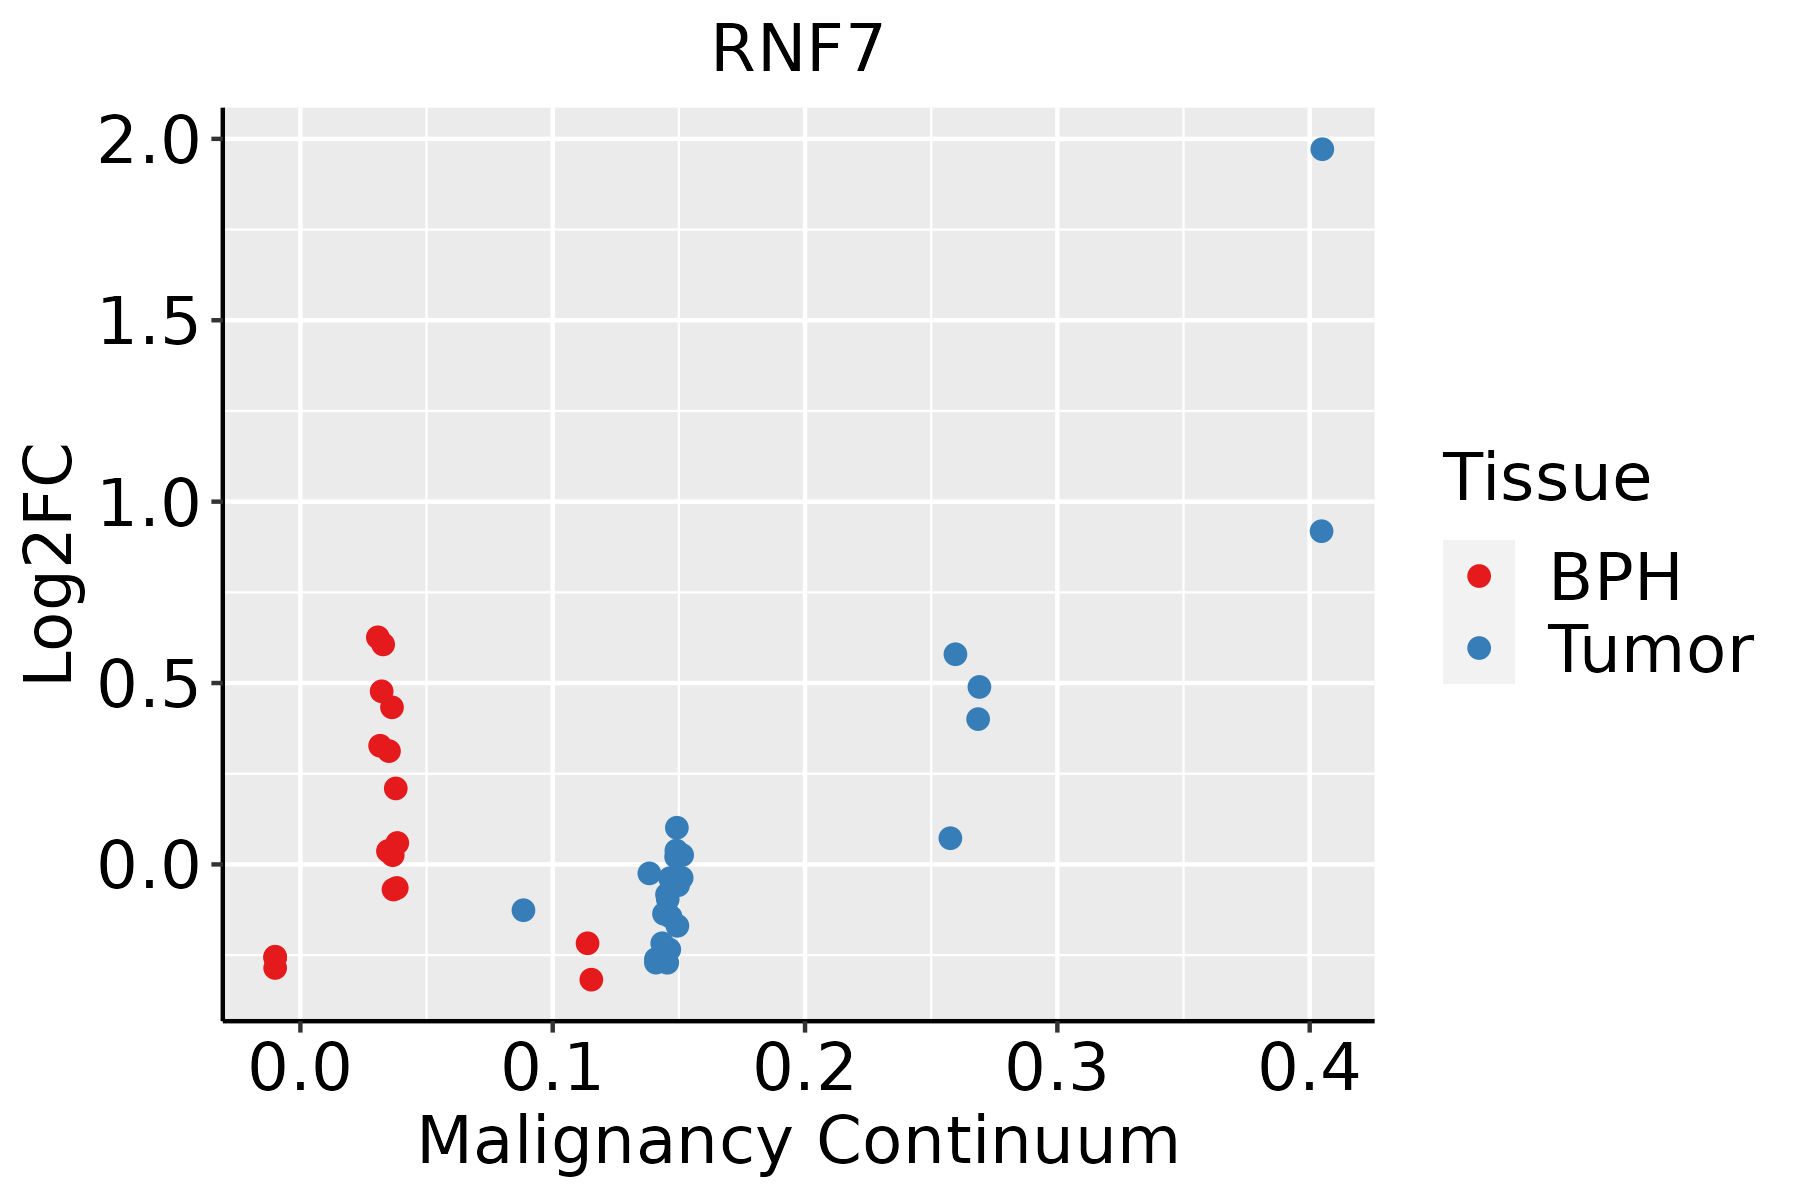 | BPH: Benign Prostatic Hyperplasia |
| Skin | 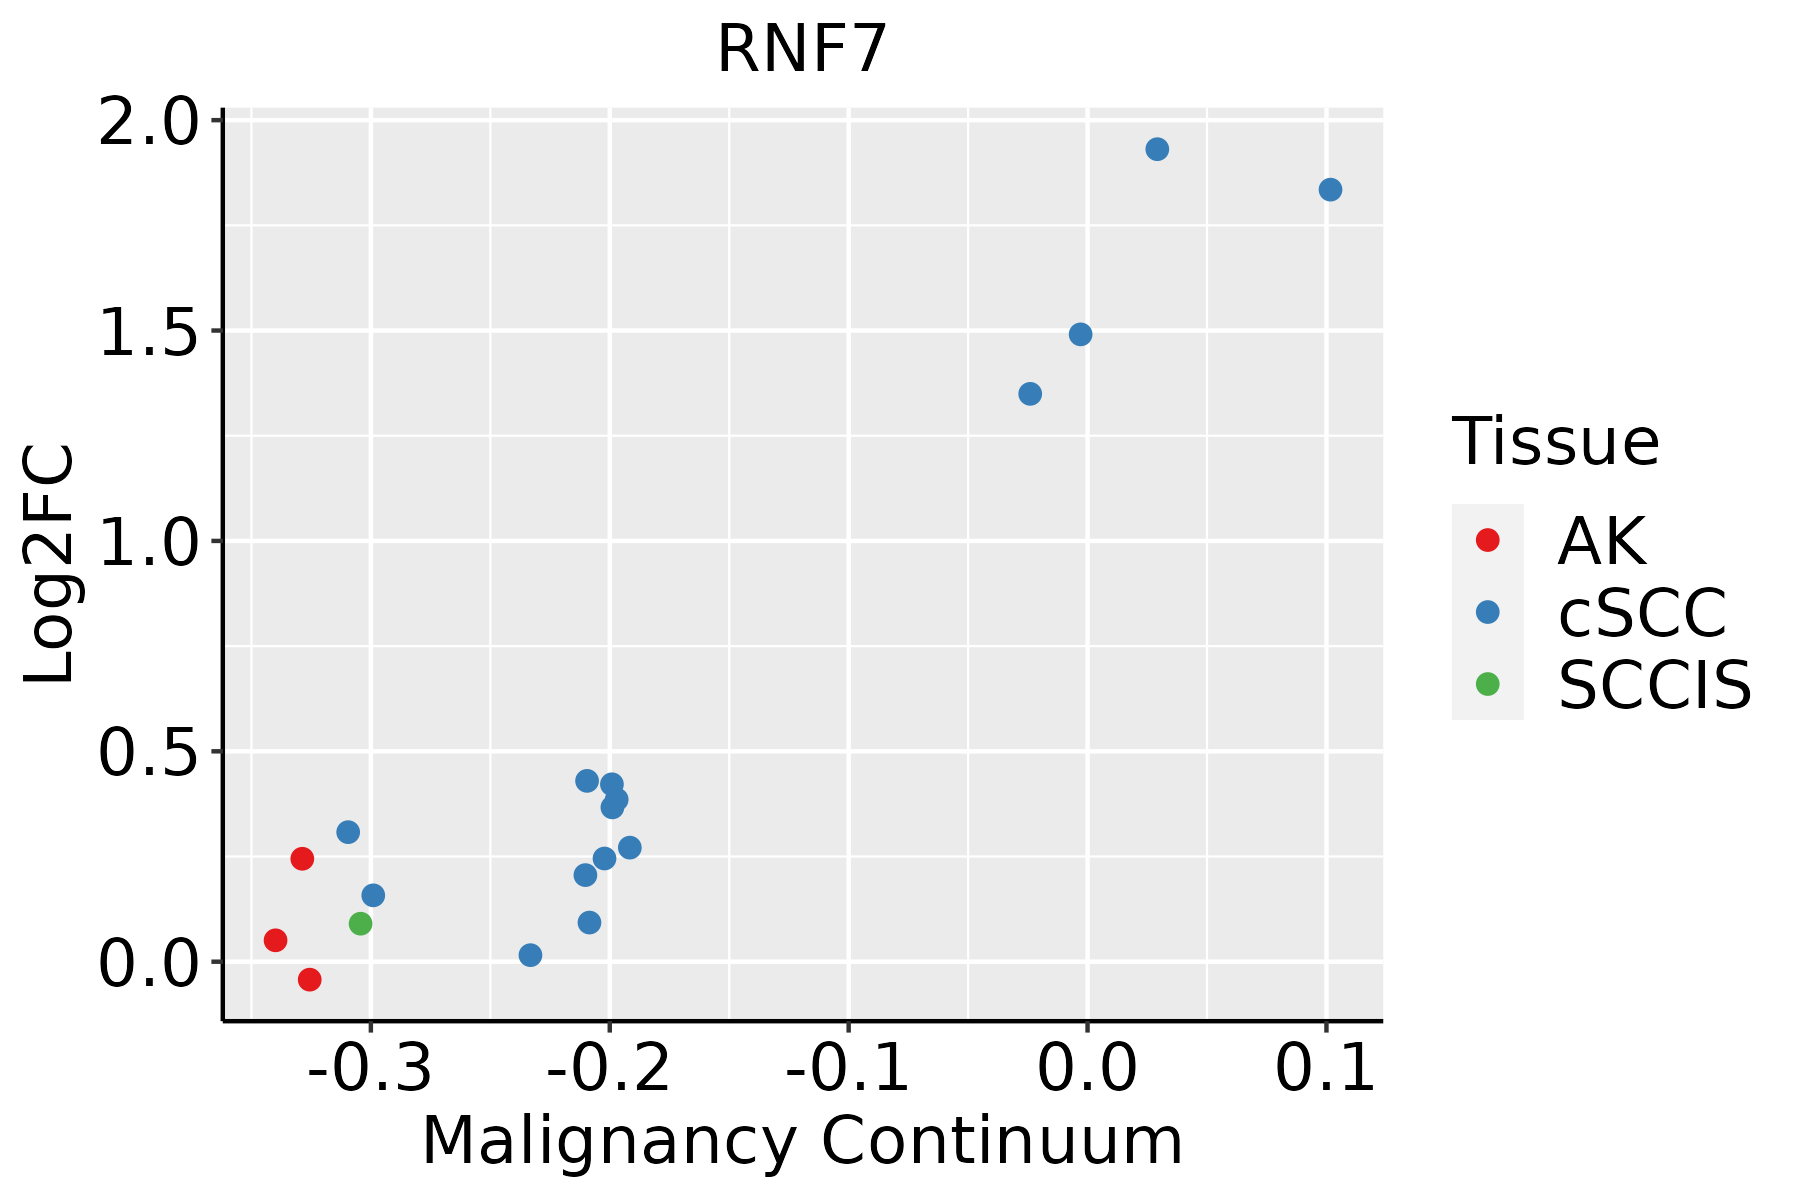 | AK: Actinic keratosis |
| cSCC: Cutaneous squamous cell carcinoma | ||
| SCCIS:squamous cell carcinoma in situ | ||
| Thyroid | 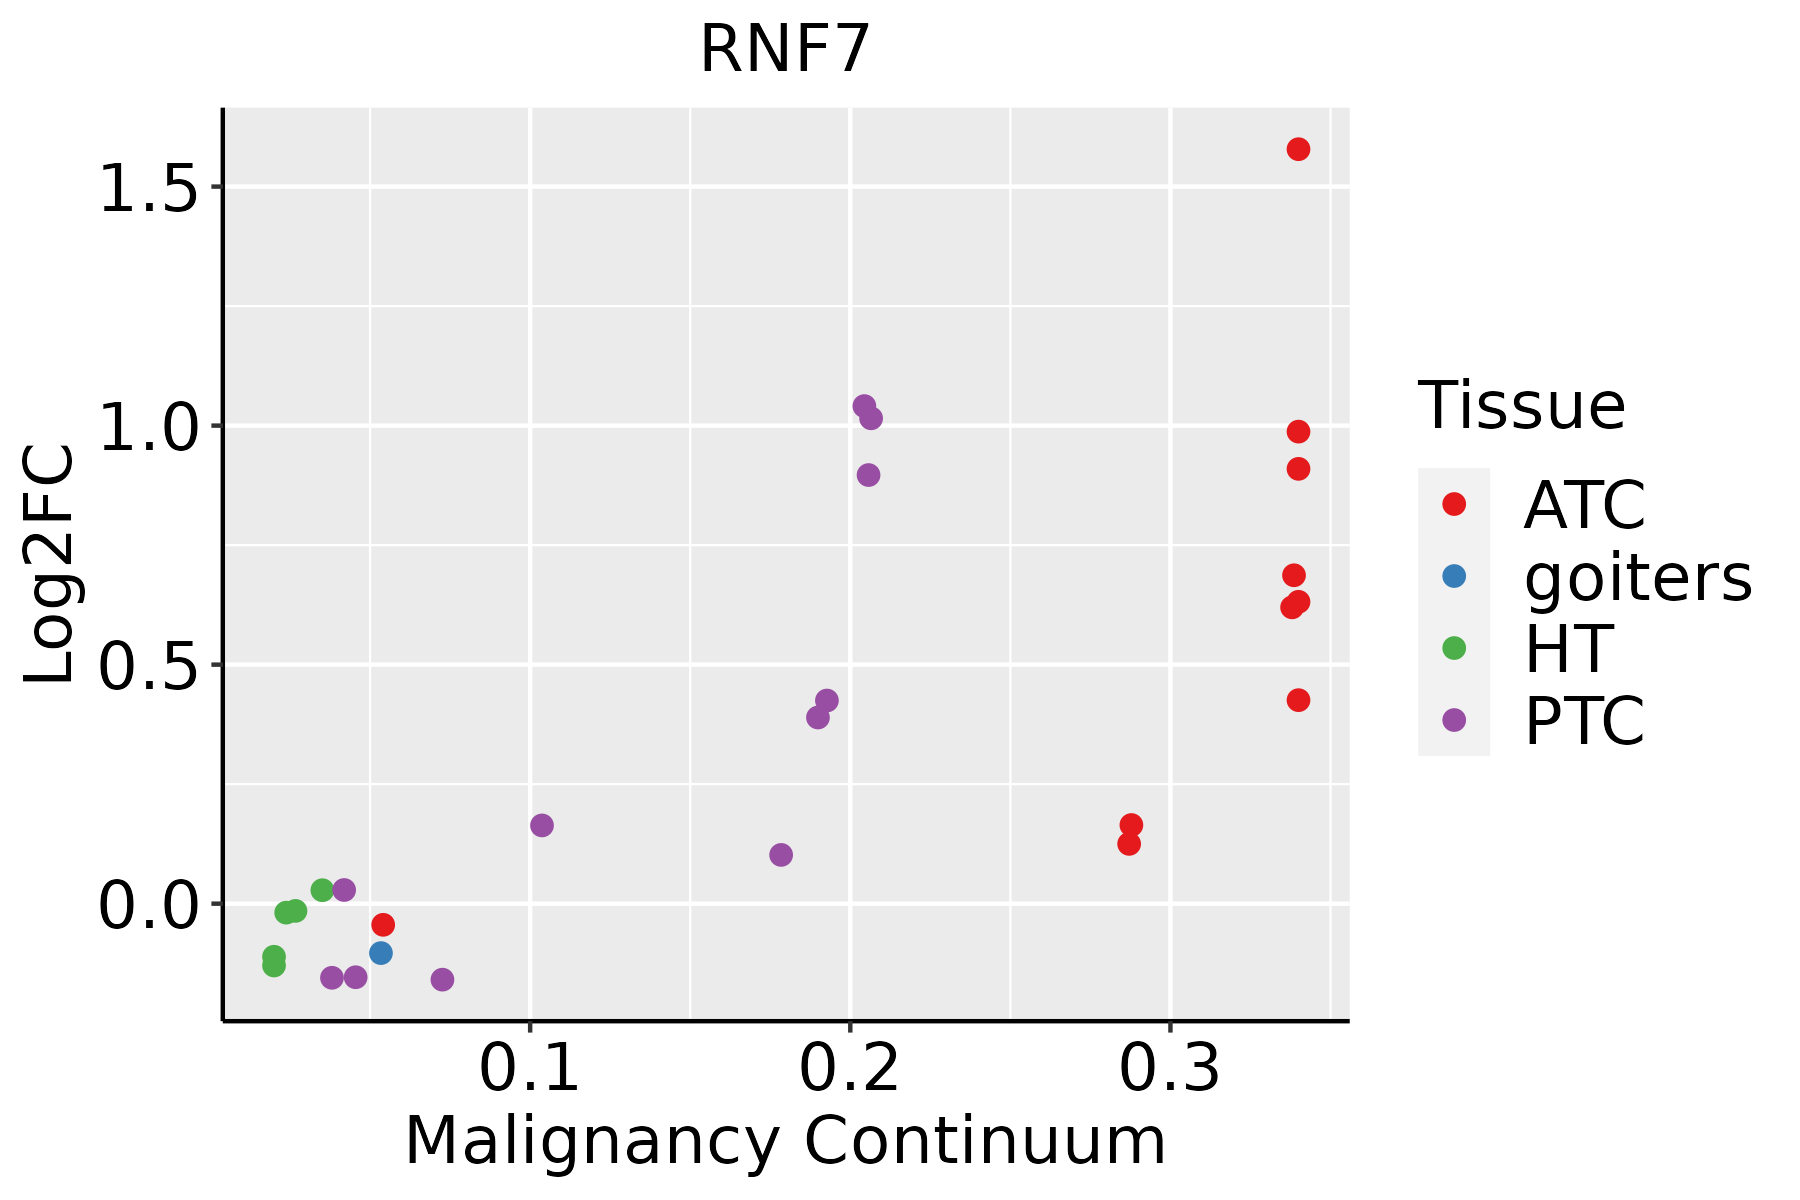 | ATC: Anaplastic thyroid cancer |
| HT: Hashimoto's thyroiditis | ||
| PTC: Papillary thyroid cancer |
| ∗log2FC in expression of this searched gene in stem-like cells from each diseased tissue sample relative to stem-like cells in normal samples in each tissue plotted against the malignancy continuum. Samples are colored based on if they are from different disease stage. |
Top |
Malignant transformation related pathway analysis |
| Find out the enriched GO biological processes and KEGG pathways involved in transition from healthy to precancer to cancer |
| Tissue | Disease Stage | Enriched GO biological Processes |
| Colorectum | AD |  |
| Colorectum | SER |  |
| Colorectum | MSS |  |
| Colorectum | MSI-H |  |
| Colorectum | FAP |  |
| ∗Top 15 enriched GO BP terms are showed in the bar plot of each disease state in each tissue. Each row represents a significant GO biological process which is colored according to the -log10(p.adjust). |
| Page: 1 2 3 4 5 6 7 8 9 |
| GO ID | Tissue | Disease Stage | Description | Gene Ratio | Bg Ratio | pvalue | p.adjust | Count |
| GO:00451162 | Cervix | CC | protein neddylation | 7/2311 | 18/18723 | 3.99e-03 | 2.48e-02 | 7 |
| GO:00451163 | Endometrium | AEH | protein neddylation | 7/2100 | 18/18723 | 2.29e-03 | 1.74e-02 | 7 |
| GO:004511611 | Endometrium | EEC | protein neddylation | 7/2168 | 18/18723 | 2.76e-03 | 1.97e-02 | 7 |
| GO:004511614 | Esophagus | ESCC | protein neddylation | 15/8552 | 18/18723 | 1.20e-03 | 5.88e-03 | 15 |
| GO:0045116 | Liver | Cirrhotic | protein neddylation | 11/4634 | 18/18723 | 1.13e-03 | 7.73e-03 | 11 |
| GO:00451161 | Liver | HCC | protein neddylation | 15/7958 | 18/18723 | 4.74e-04 | 3.12e-03 | 15 |
| GO:0051775 | Liver | HCC | response to redox state | 12/7958 | 15/18723 | 3.56e-03 | 1.59e-02 | 12 |
| GO:0043687 | Liver | HCC | post-translational protein modification | 24/7958 | 37/18723 | 5.03e-03 | 2.11e-02 | 24 |
| GO:00451165 | Oral cavity | OSCC | protein neddylation | 13/7305 | 18/18723 | 4.45e-03 | 1.79e-02 | 13 |
| GO:004511613 | Oral cavity | LP | protein neddylation | 11/4623 | 18/18723 | 1.11e-03 | 9.13e-03 | 11 |
| GO:004511621 | Oral cavity | NEOLP | protein neddylation | 7/2005 | 18/18723 | 1.75e-03 | 1.21e-02 | 7 |
| GO:00451164 | Prostate | BPH | protein neddylation | 10/3107 | 18/18723 | 1.87e-04 | 1.55e-03 | 10 |
| GO:00517752 | Prostate | BPH | response to redox state | 8/3107 | 15/18723 | 1.21e-03 | 7.41e-03 | 8 |
| GO:004511612 | Prostate | Tumor | protein neddylation | 10/3246 | 18/18723 | 2.72e-04 | 2.24e-03 | 10 |
| GO:00517751 | Prostate | Tumor | response to redox state | 8/3246 | 15/18723 | 1.63e-03 | 9.79e-03 | 8 |
| GO:00451167 | Skin | AK | protein neddylation | 7/1910 | 18/18723 | 1.31e-03 | 9.86e-03 | 7 |
| GO:004511615 | Skin | cSCC | protein neddylation | 14/4864 | 18/18723 | 6.37e-06 | 8.92e-05 | 14 |
| GO:004511616 | Thyroid | PTC | protein neddylation | 13/5968 | 18/18723 | 5.21e-04 | 3.37e-03 | 13 |
| GO:00517753 | Thyroid | PTC | response to redox state | 11/5968 | 15/18723 | 1.19e-03 | 6.84e-03 | 11 |
| GO:005177511 | Thyroid | ATC | response to redox state | 12/6293 | 15/18723 | 3.10e-04 | 1.94e-03 | 12 |
| Page: 1 2 |
| Pathway ID | Tissue | Disease Stage | Description | Gene Ratio | Bg Ratio | pvalue | p.adjust | qvalue | Count |
| hsa0412014 | Cervix | CC | Ubiquitin mediated proteolysis | 49/1267 | 142/8465 | 4.26e-09 | 7.68e-08 | 4.54e-08 | 49 |
| hsa0517016 | Cervix | CC | Human immunodeficiency virus 1 infection | 55/1267 | 212/8465 | 1.80e-05 | 1.42e-04 | 8.40e-05 | 55 |
| hsa0412015 | Cervix | CC | Ubiquitin mediated proteolysis | 49/1267 | 142/8465 | 4.26e-09 | 7.68e-08 | 4.54e-08 | 49 |
| hsa0517017 | Cervix | CC | Human immunodeficiency virus 1 infection | 55/1267 | 212/8465 | 1.80e-05 | 1.42e-04 | 8.40e-05 | 55 |
| hsa0412016 | Endometrium | AEH | Ubiquitin mediated proteolysis | 41/1197 | 142/8465 | 3.42e-06 | 4.27e-05 | 3.13e-05 | 41 |
| hsa0517018 | Endometrium | AEH | Human immunodeficiency virus 1 infection | 43/1197 | 212/8465 | 8.19e-03 | 4.22e-02 | 3.09e-02 | 43 |
| hsa0412017 | Endometrium | AEH | Ubiquitin mediated proteolysis | 41/1197 | 142/8465 | 3.42e-06 | 4.27e-05 | 3.13e-05 | 41 |
| hsa0517019 | Endometrium | AEH | Human immunodeficiency virus 1 infection | 43/1197 | 212/8465 | 8.19e-03 | 4.22e-02 | 3.09e-02 | 43 |
| hsa0412023 | Endometrium | EEC | Ubiquitin mediated proteolysis | 41/1237 | 142/8465 | 7.86e-06 | 9.58e-05 | 7.14e-05 | 41 |
| hsa0517025 | Endometrium | EEC | Human immunodeficiency virus 1 infection | 44/1237 | 212/8465 | 8.86e-03 | 4.05e-02 | 3.02e-02 | 44 |
| hsa0412033 | Endometrium | EEC | Ubiquitin mediated proteolysis | 41/1237 | 142/8465 | 7.86e-06 | 9.58e-05 | 7.14e-05 | 41 |
| hsa0517035 | Endometrium | EEC | Human immunodeficiency virus 1 infection | 44/1237 | 212/8465 | 8.86e-03 | 4.05e-02 | 3.02e-02 | 44 |
| hsa0412027 | Esophagus | ESCC | Ubiquitin mediated proteolysis | 122/4205 | 142/8465 | 6.53e-20 | 7.29e-18 | 3.74e-18 | 122 |
| hsa05170210 | Esophagus | ESCC | Human immunodeficiency virus 1 infection | 147/4205 | 212/8465 | 3.37e-09 | 3.53e-08 | 1.81e-08 | 147 |
| hsa0412036 | Esophagus | ESCC | Ubiquitin mediated proteolysis | 122/4205 | 142/8465 | 6.53e-20 | 7.29e-18 | 3.74e-18 | 122 |
| hsa0517038 | Esophagus | ESCC | Human immunodeficiency virus 1 infection | 147/4205 | 212/8465 | 3.37e-09 | 3.53e-08 | 1.81e-08 | 147 |
| hsa0412021 | Liver | Cirrhotic | Ubiquitin mediated proteolysis | 72/2530 | 142/8465 | 1.32e-07 | 1.97e-06 | 1.21e-06 | 72 |
| hsa0412031 | Liver | Cirrhotic | Ubiquitin mediated proteolysis | 72/2530 | 142/8465 | 1.32e-07 | 1.97e-06 | 1.21e-06 | 72 |
| hsa0412041 | Liver | HCC | Ubiquitin mediated proteolysis | 110/4020 | 142/8465 | 1.67e-13 | 3.74e-12 | 2.08e-12 | 110 |
| hsa051709 | Liver | HCC | Human immunodeficiency virus 1 infection | 125/4020 | 212/8465 | 4.51e-04 | 1.94e-03 | 1.08e-03 | 125 |
| Page: 1 2 3 |
Top |
Cell-cell communication analysis |
| Identification of potential cell-cell interactions between two cell types and their ligand-receptor pairs for different disease states |
| Ligand | Receptor | LRpair | Pathway | Tissue | Disease Stage |
| Page: 1 |
Top |
Single-cell gene regulatory network inference analysis |
| Find out the significant the regulons (TFs) and the target genes of each regulon across cell types for different disease states |
| TF | Cell Type | Tissue | Disease Stage | Target Gene | RSS | Regulon Activity |
| ∗The dot plots of a searched regulon are shown for all cell subpopulations in each disease state of each tissue based on the regulon specific score inferred using pySCENIC and by calculating the average expression. |
| Page: 1 |
Top |
Somatic mutation of malignant transformation related genes |
| Annotation of somatic variants for genes involved in malignant transformation |
| Hugo Symbol | Variant Class | Variant Classification | dbSNP RS | HGVSc | HGVSp | HGVSp Short | SWISSPROT | BIOTYPE | SIFT | PolyPhen | Tumor Sample Barcode | Tissue | Histology | Sex | Age | Stage | Therapy Types | Drugs | Outcome |
| RNF7 | SNV | Missense_Mutation | novel | c.293N>A | p.Arg98His | p.R98H | Q9UBF6 | protein_coding | tolerated(0.1) | benign(0.196) | TCGA-AN-A046-01 | Breast | breast invasive carcinoma | Female | >=65 | I/II | Unknown | Unknown | SD |
| RNF7 | SNV | Missense_Mutation | c.296N>C | p.Cys99Ser | p.C99S | Q9UBF6 | protein_coding | deleterious(0) | probably_damaging(0.999) | TCGA-DS-A1OC-01 | Cervix | cervical & endocervical cancer | Female | <65 | I/II | Chemotherapy | gemcitabine | SD | |
| RNF7 | SNV | Missense_Mutation | c.116N>T | p.Ala39Val | p.A39V | Q9UBF6 | protein_coding | deleterious(0) | probably_damaging(0.914) | TCGA-DM-A28M-01 | Colorectum | colon adenocarcinoma | Male | <65 | I/II | Unknown | Unknown | SD | |
| RNF7 | SNV | Missense_Mutation | novel | c.319G>A | p.Val107Met | p.V107M | Q9UBF6 | protein_coding | tolerated(0.06) | benign(0.045) | TCGA-AX-A06F-01 | Endometrium | uterine corpus endometrioid carcinoma | Female | <65 | III/IV | Chemotherapy | carboplatin | SD |
| RNF7 | SNV | Missense_Mutation | novel | c.119N>C | p.Met40Thr | p.M40T | Q9UBF6 | protein_coding | tolerated(0.06) | benign(0.028) | TCGA-FI-A2F9-01 | Endometrium | uterine corpus endometrioid carcinoma | Female | >=65 | I/II | Unknown | Unknown | SD |
| RNF7 | SNV | Missense_Mutation | c.131N>G | p.Asp44Gly | p.D44G | Q9UBF6 | protein_coding | deleterious(0) | probably_damaging(1) | TCGA-55-8094-01 | Lung | lung adenocarcinoma | Male | <65 | III/IV | Unknown | Unknown | SD | |
| RNF7 | SNV | Missense_Mutation | c.57N>G | p.Ser19Arg | p.S19R | Q9UBF6 | protein_coding | tolerated(0.1) | benign(0.023) | TCGA-67-3771-01 | Lung | lung adenocarcinoma | Female | >=65 | I/II | Unknown | Unknown | SD | |
| RNF7 | SNV | Missense_Mutation | novel | c.65N>A | p.Ser22Tyr | p.S22Y | Q9UBF6 | protein_coding | deleterious(0.01) | benign(0.276) | TCGA-VQ-A924-01 | Stomach | stomach adenocarcinoma | Male | >=65 | I/II | Unknown | Unknown | PD |
| RNF7 | SNV | Missense_Mutation | c.185T>G | p.Leu62Arg | p.L62R | Q9UBF6 | protein_coding | deleterious(0) | probably_damaging(0.991) | TCGA-ET-A3BT-01 | Thyroid | thyroid carcinoma | Female | <65 | I/II | Unknown | Unknown | PD |
| Page: 1 |
Top |
Related drugs of malignant transformation related genes |
| Identification of chemicals and drugs interact with genes involved in malignant transfromation |
| (DGIdb 4.0) |
| Entrez ID | Symbol | Category | Interaction Types | Drug Claim Name | Drug Name | PMIDs |
| Page: 1 |

Copyright 2023-Present -The University of Texas Health Science Center at Houston |