
|
|||||
|
 | |
| |
| |
| |
| |
| |
|
Gene: RNF5 |
Gene summary for RNF5 |
| Gene information | Species | Human | Gene symbol | RNF5 | Gene ID | 6048 |
| Gene name | ring finger protein 5 | |
| Gene Alias | RING5 | |
| Cytomap | 6p21.32 | |
| Gene Type | protein-coding | GO ID | GO:0000045 | UniProtAcc | A0A024RCQ4 |
Top |
Malignant transformation analysis |
| Identification of the aberrant gene expression in precancerous and cancerous lesions by comparing the gene expression of stem-like cells in diseased tissues with normal stem cells |
| Entrez ID | Symbol | Replicates | Species | Organ | Tissue | Adj P-value | Log2FC | Malignancy |
| 6048 | RNF5 | HTA11_3410_2000001011 | Human | Colorectum | AD | 3.59e-16 | 4.00e-01 | 0.0155 |
| 6048 | RNF5 | HTA11_2487_2000001011 | Human | Colorectum | SER | 4.82e-28 | 7.82e-01 | -0.1808 |
| 6048 | RNF5 | HTA11_2951_2000001011 | Human | Colorectum | AD | 5.15e-06 | 6.06e-01 | 0.0216 |
| 6048 | RNF5 | HTA11_1938_2000001011 | Human | Colorectum | AD | 2.73e-13 | 6.59e-01 | -0.0811 |
| 6048 | RNF5 | HTA11_78_2000001011 | Human | Colorectum | AD | 8.25e-08 | 3.74e-01 | -0.1088 |
| 6048 | RNF5 | HTA11_347_2000001011 | Human | Colorectum | AD | 1.66e-49 | 9.76e-01 | -0.1954 |
| 6048 | RNF5 | HTA11_411_2000001011 | Human | Colorectum | SER | 3.31e-23 | 1.45e+00 | -0.2602 |
| 6048 | RNF5 | HTA11_2112_2000001011 | Human | Colorectum | SER | 1.23e-02 | 4.01e-01 | -0.2196 |
| 6048 | RNF5 | HTA11_3361_2000001011 | Human | Colorectum | AD | 3.07e-19 | 6.56e-01 | -0.1207 |
| 6048 | RNF5 | HTA11_83_2000001011 | Human | Colorectum | SER | 8.93e-22 | 7.75e-01 | -0.1526 |
| 6048 | RNF5 | HTA11_696_2000001011 | Human | Colorectum | AD | 9.86e-40 | 7.13e-01 | -0.1464 |
| 6048 | RNF5 | HTA11_866_2000001011 | Human | Colorectum | AD | 6.58e-23 | 5.29e-01 | -0.1001 |
| 6048 | RNF5 | HTA11_1391_2000001011 | Human | Colorectum | AD | 4.94e-36 | 9.84e-01 | -0.059 |
| 6048 | RNF5 | HTA11_2992_2000001011 | Human | Colorectum | SER | 1.12e-19 | 9.76e-01 | -0.1706 |
| 6048 | RNF5 | HTA11_5212_2000001011 | Human | Colorectum | AD | 1.04e-31 | 1.22e+00 | -0.2061 |
| 6048 | RNF5 | HTA11_5216_2000001011 | Human | Colorectum | SER | 2.66e-11 | 9.24e-01 | -0.1462 |
| 6048 | RNF5 | HTA11_546_2000001011 | Human | Colorectum | AD | 1.44e-13 | 6.59e-01 | -0.0842 |
| 6048 | RNF5 | HTA11_7862_2000001011 | Human | Colorectum | AD | 6.68e-10 | 5.33e-01 | -0.0179 |
| 6048 | RNF5 | HTA11_866_3004761011 | Human | Colorectum | AD | 6.42e-23 | 5.31e-01 | 0.096 |
| 6048 | RNF5 | HTA11_8622_2000001021 | Human | Colorectum | SER | 2.59e-11 | 5.20e-01 | 0.0528 |
| Page: 1 2 3 4 5 6 7 8 |
| Tissue | Expression Dynamics | Abbreviation |
| Colorectum (GSE201348) |  | FAP: Familial adenomatous polyposis |
| CRC: Colorectal cancer | ||
| Colorectum (HTA11) |  | AD: Adenomas |
| SER: Sessile serrated lesions | ||
| MSI-H: Microsatellite-high colorectal cancer | ||
| MSS: Microsatellite stable colorectal cancer | ||
| Esophagus |  | ESCC: Esophageal squamous cell carcinoma |
| HGIN: High-grade intraepithelial neoplasias | ||
| LGIN: Low-grade intraepithelial neoplasias | ||
| Liver |  | HCC: Hepatocellular carcinoma |
| NAFLD: Non-alcoholic fatty liver disease | ||
| Oral Cavity | 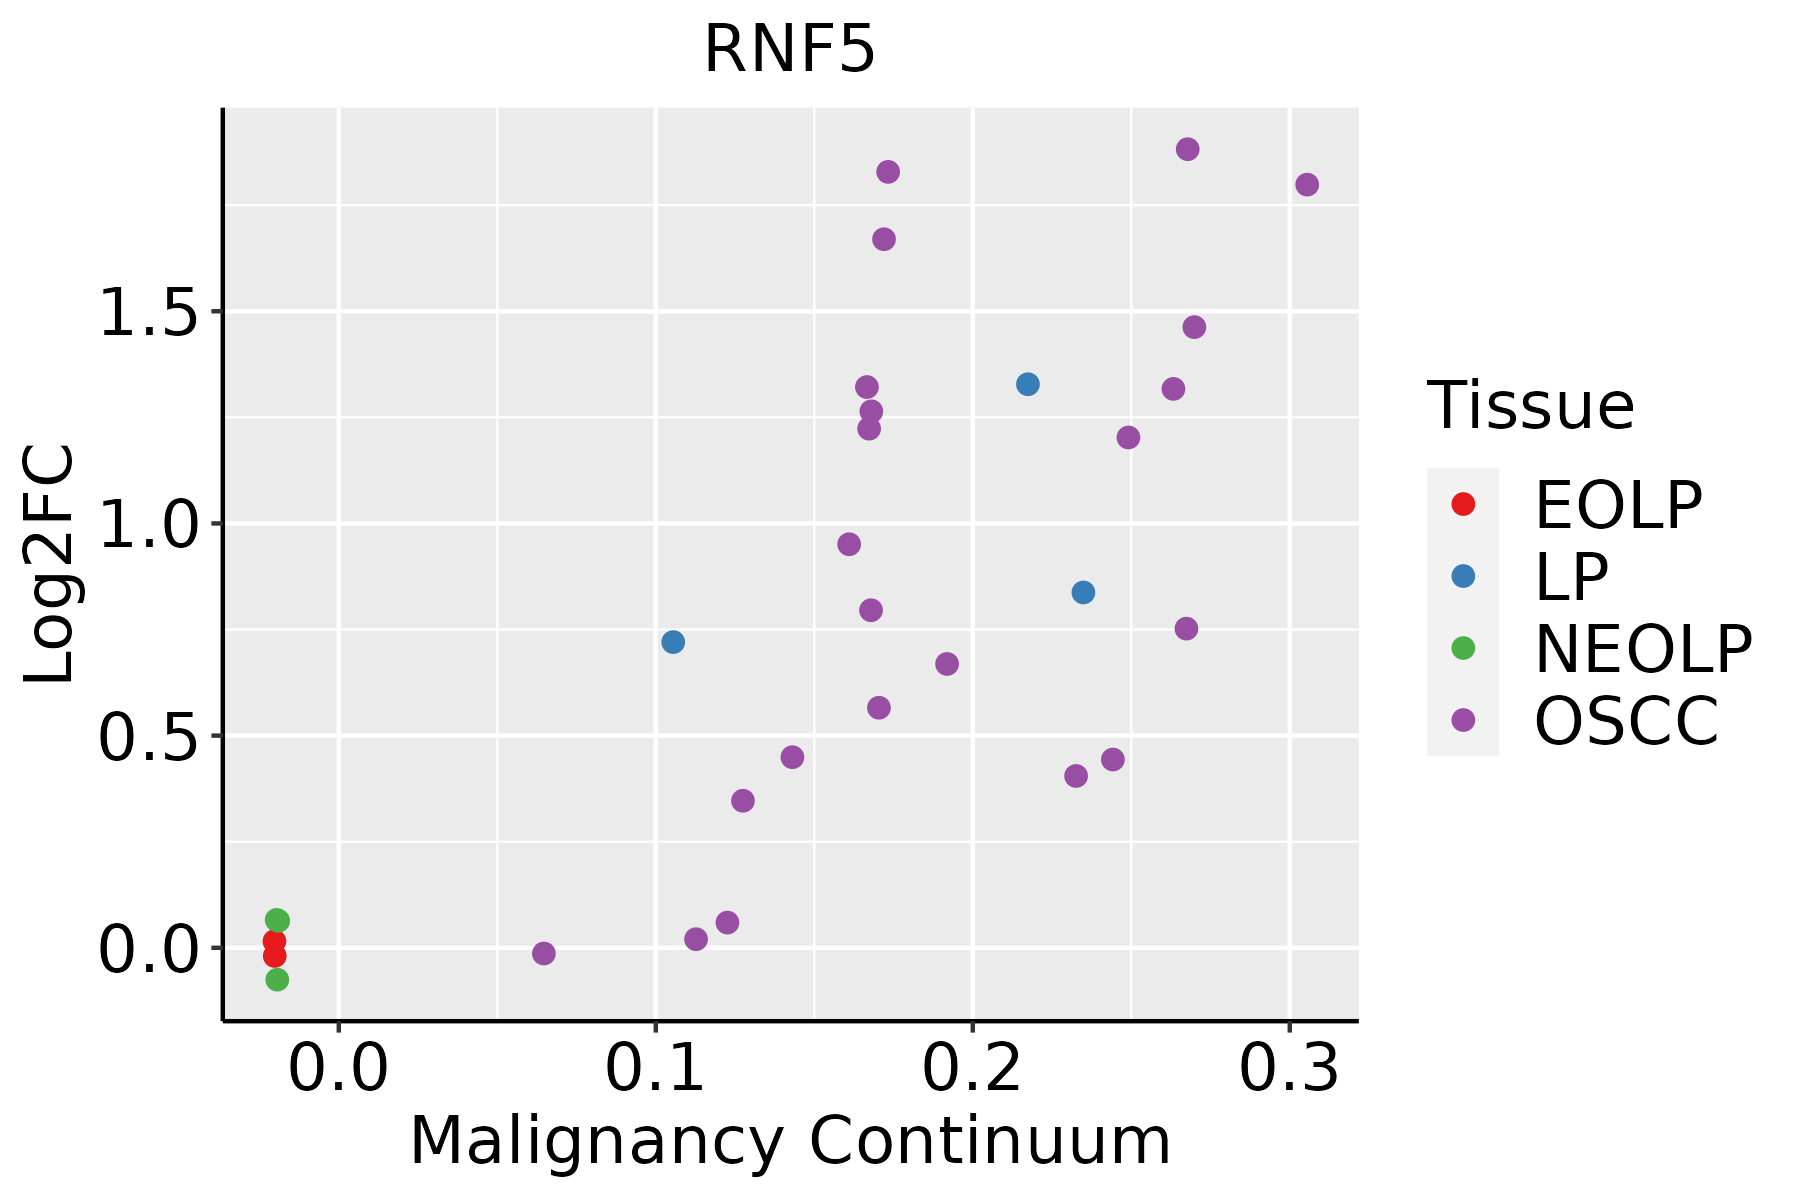 | EOLP: Erosive Oral lichen planus |
| LP: leukoplakia | ||
| NEOLP: Non-erosive oral lichen planus | ||
| OSCC: Oral squamous cell carcinoma | ||
| Skin | 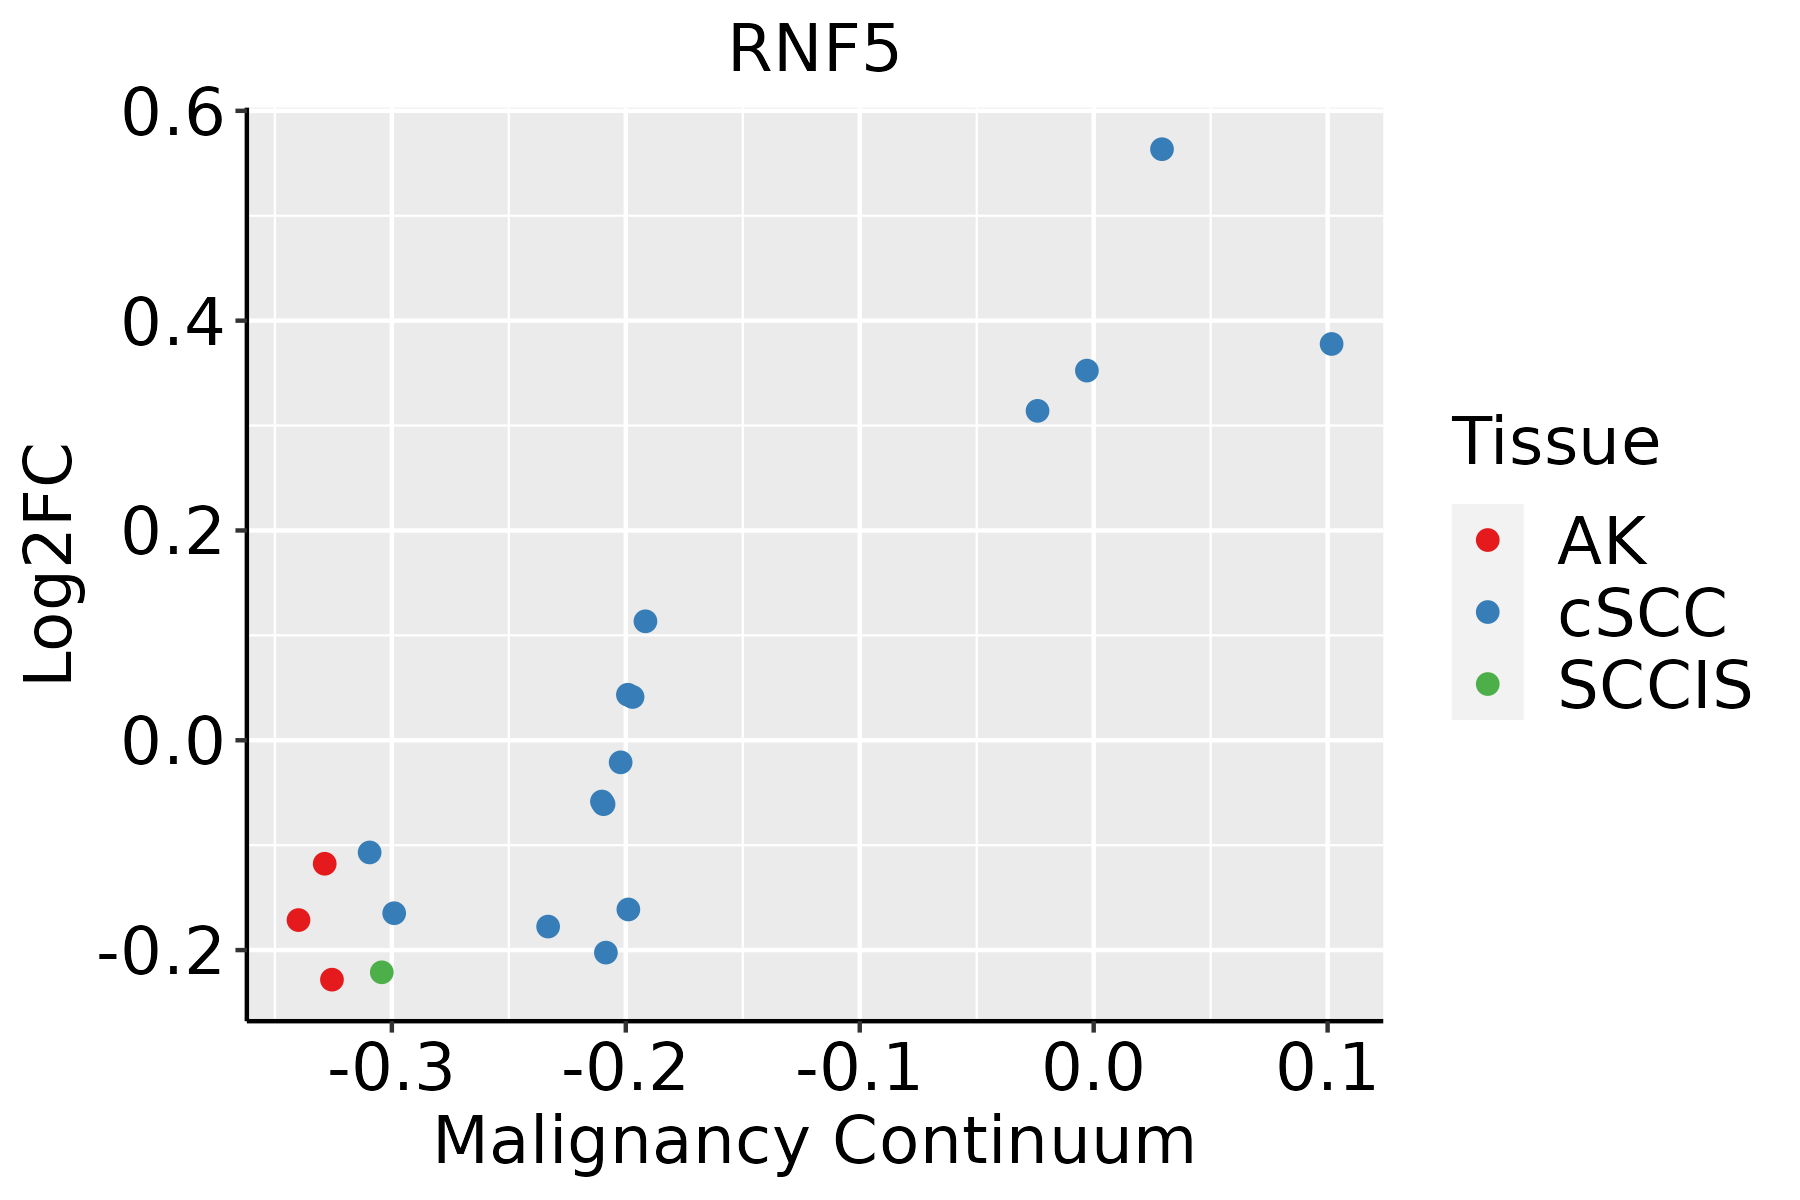 | AK: Actinic keratosis |
| cSCC: Cutaneous squamous cell carcinoma | ||
| SCCIS:squamous cell carcinoma in situ |
| ∗log2FC in expression of this searched gene in stem-like cells from each diseased tissue sample relative to stem-like cells in normal samples in each tissue plotted against the malignancy continuum. Samples are colored based on if they are from different disease stage. |
Top |
Malignant transformation related pathway analysis |
| Find out the enriched GO biological processes and KEGG pathways involved in transition from healthy to precancer to cancer |
| Tissue | Disease Stage | Enriched GO biological Processes |
| Colorectum | AD |  |
| Colorectum | SER |  |
| Colorectum | MSS |  |
| Colorectum | MSI-H |  |
| Colorectum | FAP |  |
| ∗Top 15 enriched GO BP terms are showed in the bar plot of each disease state in each tissue. Each row represents a significant GO biological process which is colored according to the -log10(p.adjust). |
| Page: 1 2 3 4 5 6 7 8 9 |
| GO ID | Tissue | Disease Stage | Description | Gene Ratio | Bg Ratio | pvalue | p.adjust | Count |
| GO:0010498 | Colorectum | AD | proteasomal protein catabolic process | 174/3918 | 490/18723 | 3.18e-14 | 7.66e-12 | 174 |
| GO:0009895 | Colorectum | AD | negative regulation of catabolic process | 124/3918 | 320/18723 | 1.66e-13 | 3.35e-11 | 124 |
| GO:0031330 | Colorectum | AD | negative regulation of cellular catabolic process | 104/3918 | 262/18723 | 2.66e-12 | 3.96e-10 | 104 |
| GO:0043161 | Colorectum | AD | proteasome-mediated ubiquitin-dependent protein catabolic process | 141/3918 | 412/18723 | 1.77e-10 | 1.68e-08 | 141 |
| GO:0031647 | Colorectum | AD | regulation of protein stability | 108/3918 | 298/18723 | 6.33e-10 | 5.08e-08 | 108 |
| GO:0010506 | Colorectum | AD | regulation of autophagy | 111/3918 | 317/18723 | 3.57e-09 | 2.35e-07 | 111 |
| GO:0016236 | Colorectum | AD | macroautophagy | 103/3918 | 291/18723 | 6.76e-09 | 4.15e-07 | 103 |
| GO:0034976 | Colorectum | AD | response to endoplasmic reticulum stress | 90/3918 | 256/18723 | 8.48e-08 | 4.28e-06 | 90 |
| GO:0000209 | Colorectum | AD | protein polyubiquitination | 78/3918 | 236/18723 | 8.71e-06 | 2.06e-04 | 78 |
| GO:0035966 | Colorectum | AD | response to topologically incorrect protein | 54/3918 | 159/18723 | 8.85e-05 | 1.36e-03 | 54 |
| GO:0035967 | Colorectum | AD | cellular response to topologically incorrect protein | 42/3918 | 116/18723 | 1.04e-04 | 1.56e-03 | 42 |
| GO:0070936 | Colorectum | AD | protein K48-linked ubiquitination | 27/3918 | 65/18723 | 1.31e-04 | 1.88e-03 | 27 |
| GO:0006515 | Colorectum | AD | protein quality control for misfolded or incompletely synthesized proteins | 14/3918 | 28/18723 | 6.01e-04 | 6.33e-03 | 14 |
| GO:0010507 | Colorectum | AD | negative regulation of autophagy | 31/3918 | 85/18723 | 6.91e-04 | 7.05e-03 | 31 |
| GO:0007033 | Colorectum | AD | vacuole organization | 53/3918 | 180/18723 | 4.18e-03 | 2.89e-02 | 53 |
| GO:0071712 | Colorectum | AD | ER-associated misfolded protein catabolic process | 7/3918 | 12/18723 | 5.09e-03 | 3.38e-02 | 7 |
| GO:0036503 | Colorectum | AD | ERAD pathway | 34/3918 | 107/18723 | 5.57e-03 | 3.63e-02 | 34 |
| GO:0070534 | Colorectum | AD | protein K63-linked ubiquitination | 20/3918 | 56/18723 | 7.57e-03 | 4.58e-02 | 20 |
| GO:00104981 | Colorectum | SER | proteasomal protein catabolic process | 132/2897 | 490/18723 | 3.08e-11 | 5.55e-09 | 132 |
| GO:00316471 | Colorectum | SER | regulation of protein stability | 86/2897 | 298/18723 | 2.56e-09 | 2.42e-07 | 86 |
| Page: 1 2 3 4 5 6 7 8 9 10 11 12 13 |
| Pathway ID | Tissue | Disease Stage | Description | Gene Ratio | Bg Ratio | pvalue | p.adjust | qvalue | Count |
| hsa04141 | Colorectum | AD | Protein processing in endoplasmic reticulum | 80/2092 | 174/8465 | 5.96e-10 | 1.25e-08 | 7.96e-09 | 80 |
| hsa041411 | Colorectum | AD | Protein processing in endoplasmic reticulum | 80/2092 | 174/8465 | 5.96e-10 | 1.25e-08 | 7.96e-09 | 80 |
| hsa041412 | Colorectum | SER | Protein processing in endoplasmic reticulum | 60/1580 | 174/8465 | 4.20e-07 | 7.33e-06 | 5.32e-06 | 60 |
| hsa041413 | Colorectum | SER | Protein processing in endoplasmic reticulum | 60/1580 | 174/8465 | 4.20e-07 | 7.33e-06 | 5.32e-06 | 60 |
| hsa041414 | Colorectum | MSS | Protein processing in endoplasmic reticulum | 75/1875 | 174/8465 | 3.78e-10 | 8.44e-09 | 5.17e-09 | 75 |
| hsa041415 | Colorectum | MSS | Protein processing in endoplasmic reticulum | 75/1875 | 174/8465 | 3.78e-10 | 8.44e-09 | 5.17e-09 | 75 |
| hsa041416 | Colorectum | MSI-H | Protein processing in endoplasmic reticulum | 46/797 | 174/8465 | 4.53e-11 | 9.78e-10 | 8.19e-10 | 46 |
| hsa041417 | Colorectum | MSI-H | Protein processing in endoplasmic reticulum | 46/797 | 174/8465 | 4.53e-11 | 9.78e-10 | 8.19e-10 | 46 |
| hsa0414139 | Esophagus | HGIN | Protein processing in endoplasmic reticulum | 67/1383 | 174/8465 | 1.06e-12 | 2.16e-11 | 1.72e-11 | 67 |
| hsa04141114 | Esophagus | HGIN | Protein processing in endoplasmic reticulum | 67/1383 | 174/8465 | 1.06e-12 | 2.16e-11 | 1.72e-11 | 67 |
| hsa04141211 | Esophagus | ESCC | Protein processing in endoplasmic reticulum | 147/4205 | 174/8465 | 3.29e-22 | 1.10e-19 | 5.64e-20 | 147 |
| hsa04141310 | Esophagus | ESCC | Protein processing in endoplasmic reticulum | 147/4205 | 174/8465 | 3.29e-22 | 1.10e-19 | 5.64e-20 | 147 |
| hsa0414114 | Liver | Cirrhotic | Protein processing in endoplasmic reticulum | 114/2530 | 174/8465 | 1.16e-22 | 9.67e-21 | 5.96e-21 | 114 |
| hsa0414115 | Liver | Cirrhotic | Protein processing in endoplasmic reticulum | 114/2530 | 174/8465 | 1.16e-22 | 9.67e-21 | 5.96e-21 | 114 |
| hsa0414122 | Liver | HCC | Protein processing in endoplasmic reticulum | 146/4020 | 174/8465 | 7.34e-24 | 2.46e-21 | 1.37e-21 | 146 |
| hsa0414132 | Liver | HCC | Protein processing in endoplasmic reticulum | 146/4020 | 174/8465 | 7.34e-24 | 2.46e-21 | 1.37e-21 | 146 |
| hsa0414130 | Oral cavity | OSCC | Protein processing in endoplasmic reticulum | 143/3704 | 174/8465 | 6.82e-26 | 2.28e-23 | 1.16e-23 | 143 |
| hsa04141113 | Oral cavity | OSCC | Protein processing in endoplasmic reticulum | 143/3704 | 174/8465 | 6.82e-26 | 2.28e-23 | 1.16e-23 | 143 |
| hsa04141210 | Oral cavity | LP | Protein processing in endoplasmic reticulum | 113/2418 | 174/8465 | 8.74e-24 | 5.82e-22 | 3.76e-22 | 113 |
| hsa0414138 | Oral cavity | LP | Protein processing in endoplasmic reticulum | 113/2418 | 174/8465 | 8.74e-24 | 5.82e-22 | 3.76e-22 | 113 |
| Page: 1 |
Top |
Cell-cell communication analysis |
| Identification of potential cell-cell interactions between two cell types and their ligand-receptor pairs for different disease states |
| Ligand | Receptor | LRpair | Pathway | Tissue | Disease Stage |
| Page: 1 |
Top |
Single-cell gene regulatory network inference analysis |
| Find out the significant the regulons (TFs) and the target genes of each regulon across cell types for different disease states |
| TF | Cell Type | Tissue | Disease Stage | Target Gene | RSS | Regulon Activity |
| ∗The dot plots of a searched regulon are shown for all cell subpopulations in each disease state of each tissue based on the regulon specific score inferred using pySCENIC and by calculating the average expression. |
| Page: 1 |
Top |
Somatic mutation of malignant transformation related genes |
| Annotation of somatic variants for genes involved in malignant transformation |
| Hugo Symbol | Variant Class | Variant Classification | dbSNP RS | HGVSc | HGVSp | HGVSp Short | SWISSPROT | BIOTYPE | SIFT | PolyPhen | Tumor Sample Barcode | Tissue | Histology | Sex | Age | Stage | Therapy Types | Drugs | Outcome |
| RNF5 | SNV | Missense_Mutation | rs200315442 | c.508G>A | p.Ala170Thr | p.A170T | Q99942 | protein_coding | deleterious(0) | probably_damaging(0.978) | TCGA-2W-A8YY-01 | Cervix | cervical & endocervical cancer | Female | <65 | I/II | Chemotherapy | cisplatin | CR |
| RNF5 | SNV | Missense_Mutation | c.466N>T | p.His156Tyr | p.H156Y | Q99942 | protein_coding | tolerated(0.87) | benign(0.029) | TCGA-IR-A3LL-01 | Cervix | cervical & endocervical cancer | Female | <65 | I/II | Chemotherapy | cisplatin | CR | |
| RNF5 | SNV | Missense_Mutation | novel | c.388C>G | p.Pro130Ala | p.P130A | Q99942 | protein_coding | deleterious(0.04) | possibly_damaging(0.831) | TCGA-AA-A00O-01 | Colorectum | colon adenocarcinoma | Female | >=65 | III/IV | Unknown | Unknown | SD |
| RNF5 | deletion | Frame_Shift_Del | rs758165894 | c.520delN | p.Trp176GlyfsTer22 | p.W176Gfs*22 | Q99942 | protein_coding | TCGA-AZ-6598-01 | Colorectum | colon adenocarcinoma | Female | >=65 | I/II | Unknown | Unknown | SD | ||
| RNF5 | SNV | Missense_Mutation | rs750217083 | c.409G>A | p.Val137Ile | p.V137I | Q99942 | protein_coding | tolerated(0.36) | benign(0.034) | TCGA-A5-A0GH-01 | Endometrium | uterine corpus endometrioid carcinoma | Female | <65 | I/II | Unknown | Unknown | SD |
| RNF5 | SNV | Missense_Mutation | c.85N>C | p.Ile29Leu | p.I29L | Q99942 | protein_coding | deleterious(0) | probably_damaging(0.971) | TCGA-A5-A0GP-01 | Endometrium | uterine corpus endometrioid carcinoma | Female | <65 | I/II | Unknown | Unknown | SD | |
| RNF5 | SNV | Missense_Mutation | rs752402980 | c.248N>A | p.Gly83Glu | p.G83E | Q99942 | protein_coding | deleterious(0) | probably_damaging(0.984) | TCGA-A5-A1OF-01 | Endometrium | uterine corpus endometrioid carcinoma | Female | <65 | I/II | Unknown | Unknown | SD |
| RNF5 | SNV | Missense_Mutation | rs768101414 | c.181C>T | p.Arg61Trp | p.R61W | Q99942 | protein_coding | deleterious(0) | probably_damaging(0.993) | TCGA-AJ-A3OK-01 | Endometrium | uterine corpus endometrioid carcinoma | Female | >=65 | I/II | Chemotherapy | carboplatin | CR |
| RNF5 | SNV | Missense_Mutation | novel | c.290G>A | p.Arg97His | p.R97H | Q99942 | protein_coding | deleterious(0) | probably_damaging(0.999) | TCGA-AP-A1DV-01 | Endometrium | uterine corpus endometrioid carcinoma | Female | <65 | I/II | Unknown | Unknown | SD |
| RNF5 | insertion | Frame_Shift_Ins | novel | c.526dupT | p.Trp176LeufsTer27 | p.W176Lfs*27 | Q99942 | protein_coding | TCGA-B5-A1MW-01 | Endometrium | uterine corpus endometrioid carcinoma | Female | <65 | I/II | Unknown | Unknown | PD |
| Page: 1 2 |
Top |
Related drugs of malignant transformation related genes |
| Identification of chemicals and drugs interact with genes involved in malignant transfromation |
| (DGIdb 4.0) |
| Entrez ID | Symbol | Category | Interaction Types | Drug Claim Name | Drug Name | PMIDs |
| Page: 1 |

Copyright 2023-Present -The University of Texas Health Science Center at Houston |