
|
|||||
|
 | |
| |
| |
| |
| |
| |
|
Gene: RNF44 |
Gene summary for RNF44 |
| Gene information | Species | Human | Gene symbol | RNF44 | Gene ID | 22838 |
| Gene name | ring finger protein 44 | |
| Gene Alias | RNF44 | |
| Cytomap | 5q35.2 | |
| Gene Type | protein-coding | GO ID | GO:0003674 | UniProtAcc | A0A024R7Q1 |
Top |
Malignant transformation analysis |
| Identification of the aberrant gene expression in precancerous and cancerous lesions by comparing the gene expression of stem-like cells in diseased tissues with normal stem cells |
| Entrez ID | Symbol | Replicates | Species | Organ | Tissue | Adj P-value | Log2FC | Malignancy |
| 22838 | RNF44 | LZE4T | Human | Esophagus | ESCC | 1.70e-05 | 1.38e-02 | 0.0811 |
| 22838 | RNF44 | LZE7T | Human | Esophagus | ESCC | 1.29e-02 | 7.76e-02 | 0.0667 |
| 22838 | RNF44 | LZE8T | Human | Esophagus | ESCC | 6.94e-08 | 9.02e-02 | 0.067 |
| 22838 | RNF44 | LZE24T | Human | Esophagus | ESCC | 1.91e-11 | 2.39e-01 | 0.0596 |
| 22838 | RNF44 | LZE21T | Human | Esophagus | ESCC | 1.55e-02 | 2.00e-02 | 0.0655 |
| 22838 | RNF44 | LZE6T | Human | Esophagus | ESCC | 8.73e-04 | -2.15e-02 | 0.0845 |
| 22838 | RNF44 | P1T-E | Human | Esophagus | ESCC | 3.63e-12 | 4.13e-01 | 0.0875 |
| 22838 | RNF44 | P2T-E | Human | Esophagus | ESCC | 7.28e-24 | 5.62e-01 | 0.1177 |
| 22838 | RNF44 | P4T-E | Human | Esophagus | ESCC | 6.87e-05 | -1.28e-01 | 0.1323 |
| 22838 | RNF44 | P5T-E | Human | Esophagus | ESCC | 2.28e-14 | -5.66e-02 | 0.1327 |
| 22838 | RNF44 | P8T-E | Human | Esophagus | ESCC | 1.05e-12 | 1.22e-01 | 0.0889 |
| 22838 | RNF44 | P9T-E | Human | Esophagus | ESCC | 3.34e-12 | -7.45e-02 | 0.1131 |
| 22838 | RNF44 | P10T-E | Human | Esophagus | ESCC | 1.68e-17 | 1.85e-01 | 0.116 |
| 22838 | RNF44 | P12T-E | Human | Esophagus | ESCC | 3.49e-16 | 6.32e-02 | 0.1122 |
| 22838 | RNF44 | P15T-E | Human | Esophagus | ESCC | 2.16e-26 | 2.51e-01 | 0.1149 |
| 22838 | RNF44 | P16T-E | Human | Esophagus | ESCC | 9.06e-20 | 5.59e-02 | 0.1153 |
| 22838 | RNF44 | P17T-E | Human | Esophagus | ESCC | 2.52e-07 | 1.58e-01 | 0.1278 |
| 22838 | RNF44 | P20T-E | Human | Esophagus | ESCC | 2.27e-12 | 1.91e-01 | 0.1124 |
| 22838 | RNF44 | P21T-E | Human | Esophagus | ESCC | 2.81e-18 | 7.77e-02 | 0.1617 |
| 22838 | RNF44 | P22T-E | Human | Esophagus | ESCC | 1.13e-09 | 9.70e-02 | 0.1236 |
| Page: 1 2 3 4 5 |
| Tissue | Expression Dynamics | Abbreviation |
| Esophagus | 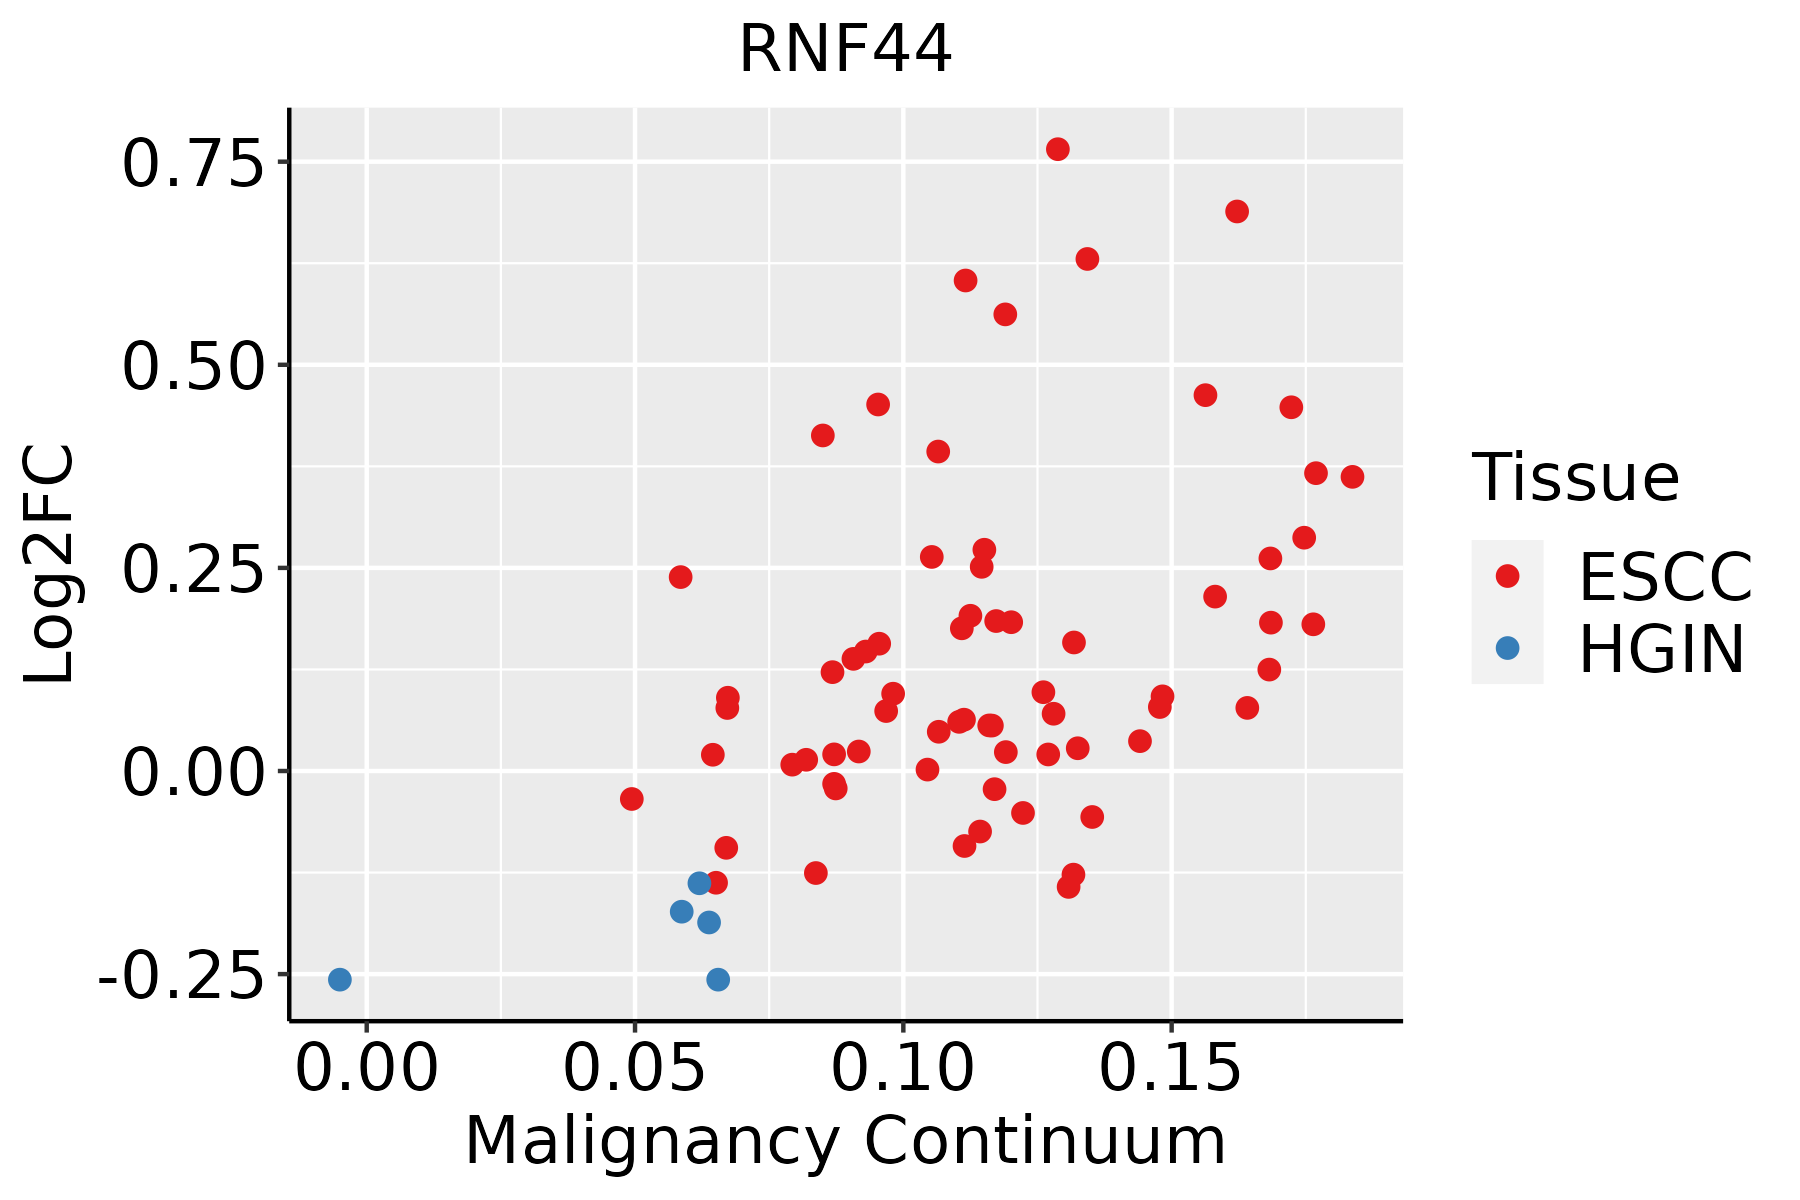 | ESCC: Esophageal squamous cell carcinoma |
| HGIN: High-grade intraepithelial neoplasias | ||
| LGIN: Low-grade intraepithelial neoplasias | ||
| Liver | 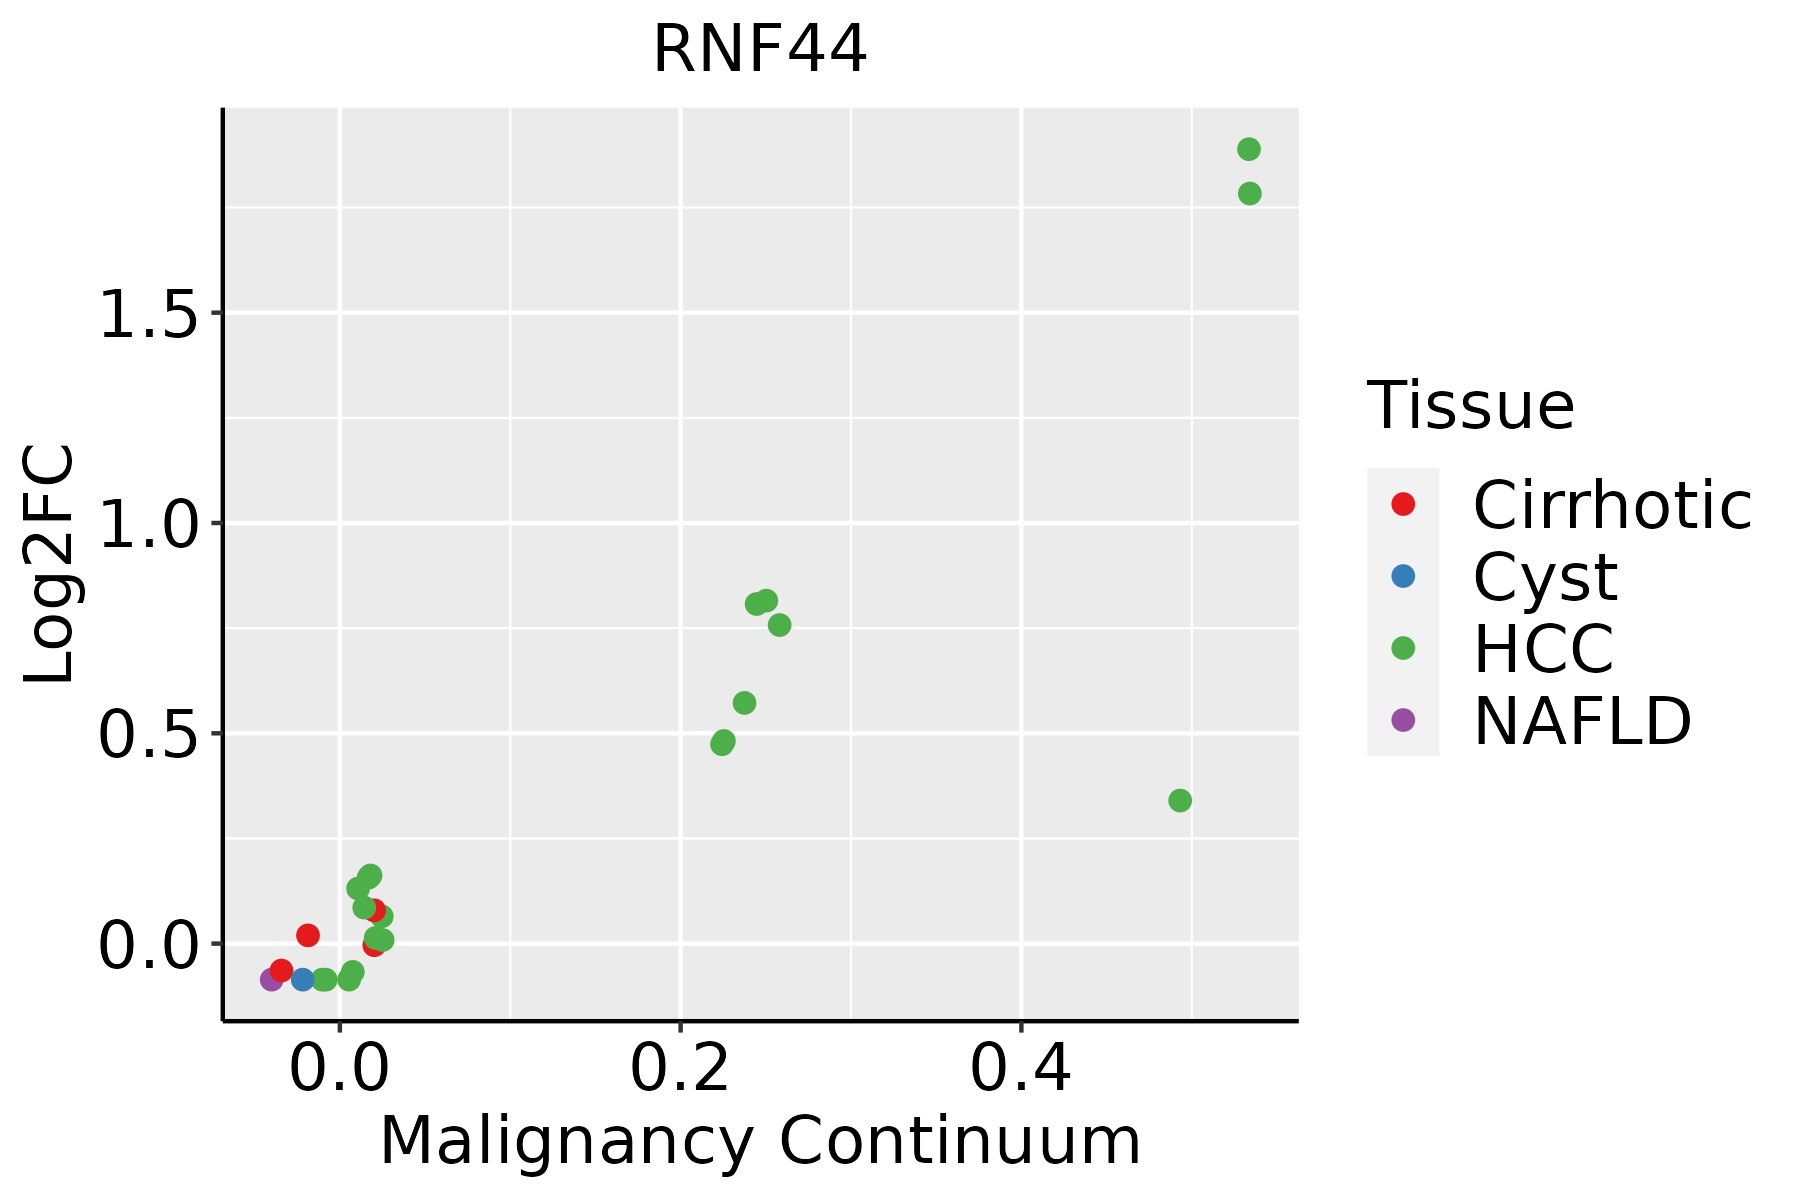 | HCC: Hepatocellular carcinoma |
| NAFLD: Non-alcoholic fatty liver disease | ||
| Oral Cavity | 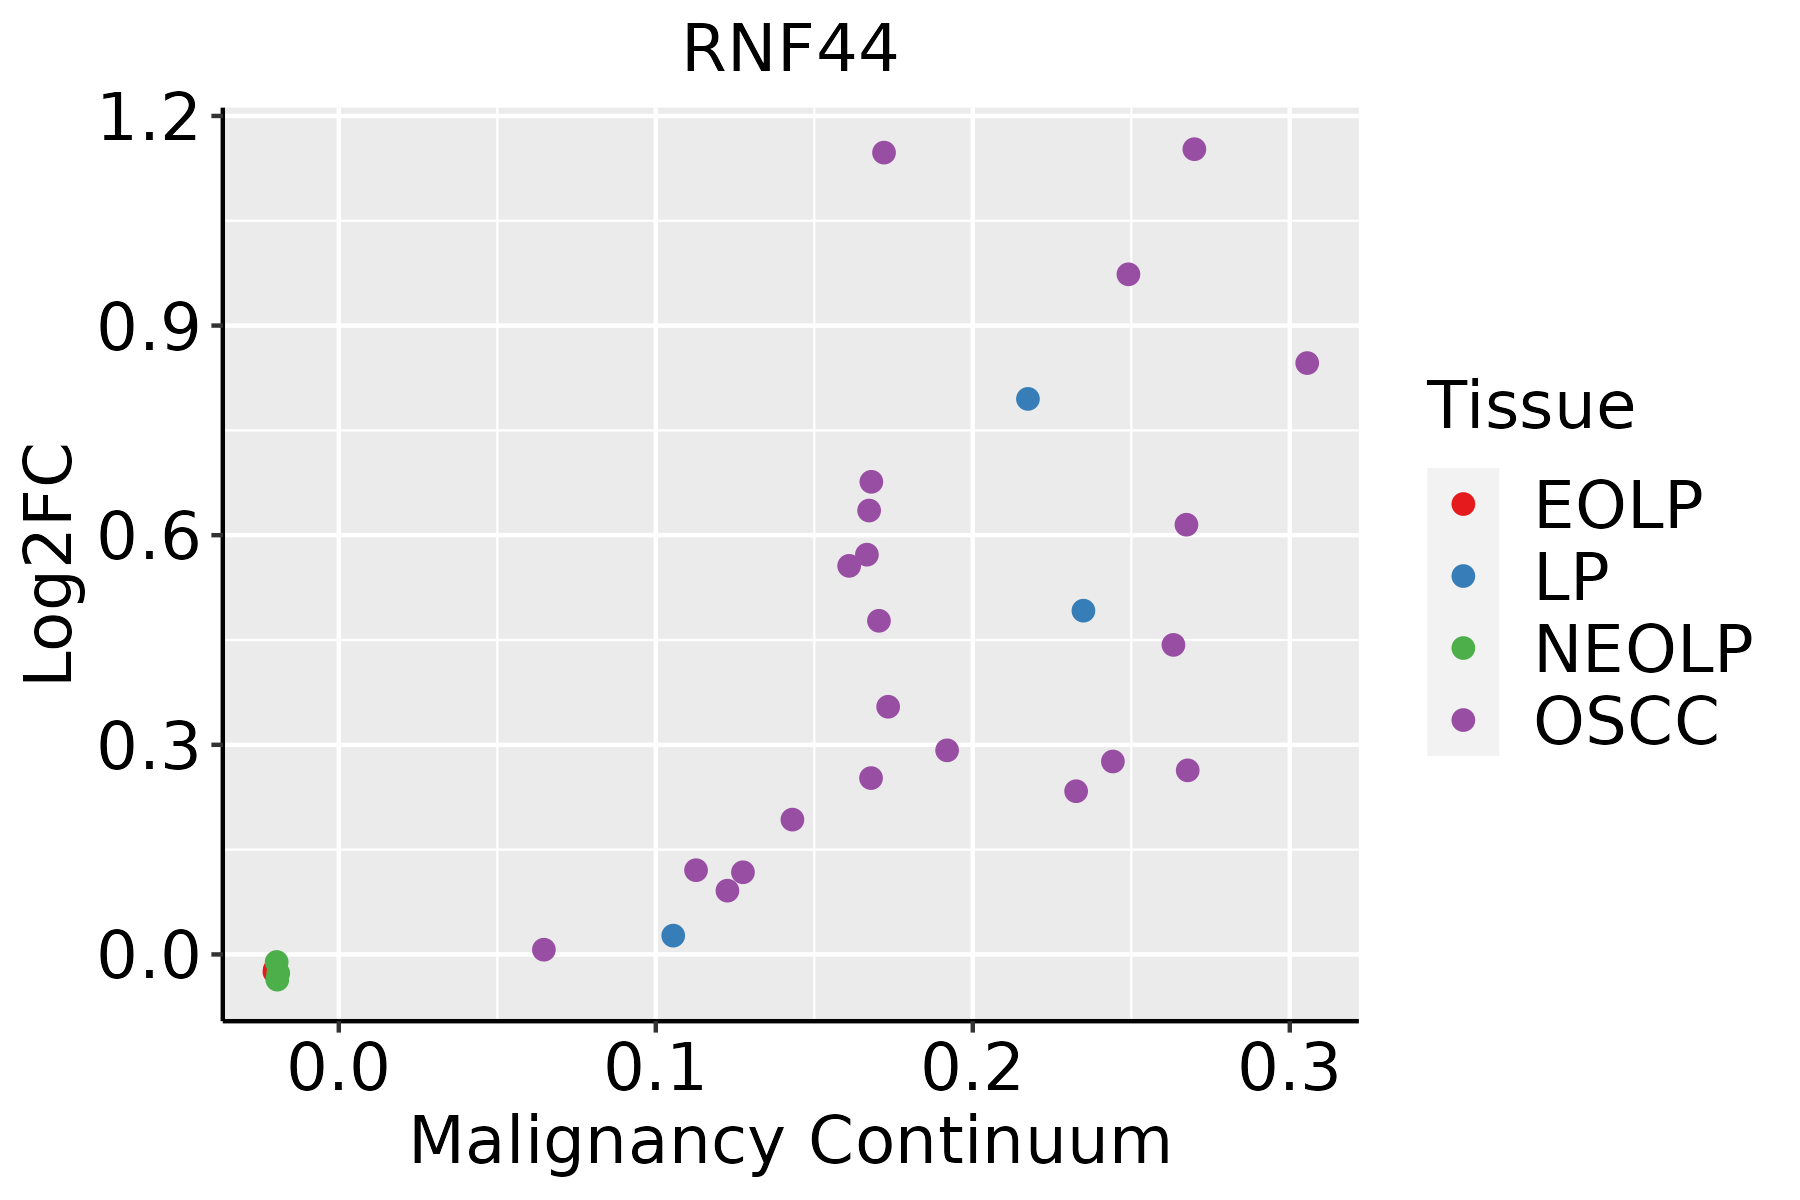 | EOLP: Erosive Oral lichen planus |
| LP: leukoplakia | ||
| NEOLP: Non-erosive oral lichen planus | ||
| OSCC: Oral squamous cell carcinoma |
| ∗log2FC in expression of this searched gene in stem-like cells from each diseased tissue sample relative to stem-like cells in normal samples in each tissue plotted against the malignancy continuum. Samples are colored based on if they are from different disease stage. |
Top |
Malignant transformation related pathway analysis |
| Find out the enriched GO biological processes and KEGG pathways involved in transition from healthy to precancer to cancer |
| Tissue | Disease Stage | Enriched GO biological Processes |
| Colorectum | AD |  |
| Colorectum | SER |  |
| Colorectum | MSS |  |
| Colorectum | MSI-H |  |
| Colorectum | FAP |  |
| ∗Top 15 enriched GO BP terms are showed in the bar plot of each disease state in each tissue. Each row represents a significant GO biological process which is colored according to the -log10(p.adjust). |
| Page: 1 2 3 4 5 6 7 8 9 |
| GO ID | Tissue | Disease Stage | Description | Gene Ratio | Bg Ratio | pvalue | p.adjust | Count |
| Page: 1 |
| Pathway ID | Tissue | Disease Stage | Description | Gene Ratio | Bg Ratio | pvalue | p.adjust | qvalue | Count |
| Page: 1 |
Top |
Cell-cell communication analysis |
| Identification of potential cell-cell interactions between two cell types and their ligand-receptor pairs for different disease states |
| Ligand | Receptor | LRpair | Pathway | Tissue | Disease Stage |
| Page: 1 |
Top |
Single-cell gene regulatory network inference analysis |
| Find out the significant the regulons (TFs) and the target genes of each regulon across cell types for different disease states |
| TF | Cell Type | Tissue | Disease Stage | Target Gene | RSS | Regulon Activity |
| ∗The dot plots of a searched regulon are shown for all cell subpopulations in each disease state of each tissue based on the regulon specific score inferred using pySCENIC and by calculating the average expression. |
| Page: 1 |
Top |
Somatic mutation of malignant transformation related genes |
| Annotation of somatic variants for genes involved in malignant transformation |
| Hugo Symbol | Variant Class | Variant Classification | dbSNP RS | HGVSc | HGVSp | HGVSp Short | SWISSPROT | BIOTYPE | SIFT | PolyPhen | Tumor Sample Barcode | Tissue | Histology | Sex | Age | Stage | Therapy Types | Drugs | Outcome |
| RNF44 | SNV | Missense_Mutation | novel | c.842N>C | p.Arg281Thr | p.R281T | Q7L0R7 | protein_coding | deleterious(0) | possibly_damaging(0.58) | TCGA-VS-A958-01 | Cervix | cervical & endocervical cancer | Female | <65 | I/II | Chemotherapy | cisplatin | CR |
| RNF44 | SNV | Missense_Mutation | rs368342651 | c.199N>A | p.Val67Ile | p.V67I | Q7L0R7 | protein_coding | tolerated_low_confidence(0.55) | benign(0.003) | TCGA-A6-5666-01 | Colorectum | colon adenocarcinoma | Male | >=65 | I/II | Unknown | Unknown | PD |
| RNF44 | SNV | Missense_Mutation | c.1036C>T | p.Arg346Trp | p.R346W | Q7L0R7 | protein_coding | deleterious(0.01) | probably_damaging(0.991) | TCGA-AA-3713-01 | Colorectum | colon adenocarcinoma | Male | >=65 | III/IV | Chemotherapy | 5-fluorouracil | PR | |
| RNF44 | SNV | Missense_Mutation | c.364C>T | p.Pro122Ser | p.P122S | Q7L0R7 | protein_coding | tolerated(0.8) | benign(0.098) | TCGA-AZ-6601-01 | Colorectum | colon adenocarcinoma | Male | >=65 | I/II | Unknown | Unknown | PD | |
| RNF44 | SNV | Missense_Mutation | rs575669062 | c.232G>A | p.Gly78Arg | p.G78R | Q7L0R7 | protein_coding | tolerated(0.18) | benign(0) | TCGA-NH-A50T-01 | Colorectum | colon adenocarcinoma | Female | >=65 | I/II | Unknown | Unknown | SD |
| RNF44 | deletion | Frame_Shift_Del | rs748776013 | c.577delN | p.Gln193SerfsTer80 | p.Q193Sfs*80 | Q7L0R7 | protein_coding | TCGA-A6-2686-01 | Colorectum | colon adenocarcinoma | Female | >=65 | I/II | Unknown | Unknown | SD | ||
| RNF44 | insertion | Frame_Shift_Ins | novel | c.577_578insC | p.Gln193ProfsTer139 | p.Q193Pfs*139 | Q7L0R7 | protein_coding | TCGA-A6-5665-01 | Colorectum | colon adenocarcinoma | Female | >=65 | I/II | Unknown | Unknown | PD | ||
| RNF44 | deletion | Frame_Shift_Del | rs748776013 | c.577delC | p.Gln193SerfsTer80 | p.Q193Sfs*80 | Q7L0R7 | protein_coding | TCGA-AD-5900-01 | Colorectum | colon adenocarcinoma | Male | >=65 | I/II | Unknown | Unknown | SD | ||
| RNF44 | SNV | Missense_Mutation | rs776918972 | c.1166C>T | p.Ala389Val | p.A389V | Q7L0R7 | protein_coding | tolerated(0.12) | benign(0.003) | TCGA-A5-A1OF-01 | Endometrium | uterine corpus endometrioid carcinoma | Female | <65 | I/II | Unknown | Unknown | SD |
| RNF44 | SNV | Missense_Mutation | c.1161N>A | p.Phe387Leu | p.F387L | Q7L0R7 | protein_coding | deleterious(0) | probably_damaging(0.994) | TCGA-AJ-A5DW-01 | Endometrium | uterine corpus endometrioid carcinoma | Female | <65 | I/II | Unknown | Unknown | SD |
| Page: 1 2 3 4 |
Top |
Related drugs of malignant transformation related genes |
| Identification of chemicals and drugs interact with genes involved in malignant transfromation |
| (DGIdb 4.0) |
| Entrez ID | Symbol | Category | Interaction Types | Drug Claim Name | Drug Name | PMIDs |
| Page: 1 |

Copyright 2023-Present -The University of Texas Health Science Center at Houston |