
|
|||||
|
 | |
| |
| |
| |
| |
| |
|
Gene: RNF41 |
Gene summary for RNF41 |
| Gene information | Species | Human | Gene symbol | RNF41 | Gene ID | 10193 |
| Gene name | ring finger protein 41 | |
| Gene Alias | FLRF | |
| Cytomap | 12q13.3 | |
| Gene Type | protein-coding | GO ID | GO:0000165 | UniProtAcc | A0A024RB33 |
Top |
Malignant transformation analysis |
| Identification of the aberrant gene expression in precancerous and cancerous lesions by comparing the gene expression of stem-like cells in diseased tissues with normal stem cells |
| Entrez ID | Symbol | Replicates | Species | Organ | Tissue | Adj P-value | Log2FC | Malignancy |
| 10193 | RNF41 | LZE7T | Human | Esophagus | ESCC | 1.71e-04 | 1.94e-01 | 0.0667 |
| 10193 | RNF41 | LZE24T | Human | Esophagus | ESCC | 5.56e-14 | 2.34e-01 | 0.0596 |
| 10193 | RNF41 | P1T-E | Human | Esophagus | ESCC | 2.48e-05 | 4.51e-01 | 0.0875 |
| 10193 | RNF41 | P2T-E | Human | Esophagus | ESCC | 1.90e-36 | 5.99e-01 | 0.1177 |
| 10193 | RNF41 | P4T-E | Human | Esophagus | ESCC | 1.44e-09 | 3.09e-01 | 0.1323 |
| 10193 | RNF41 | P5T-E | Human | Esophagus | ESCC | 4.56e-21 | 1.93e-01 | 0.1327 |
| 10193 | RNF41 | P8T-E | Human | Esophagus | ESCC | 8.07e-26 | 2.57e-01 | 0.0889 |
| 10193 | RNF41 | P9T-E | Human | Esophagus | ESCC | 3.11e-02 | 4.61e-02 | 0.1131 |
| 10193 | RNF41 | P10T-E | Human | Esophagus | ESCC | 6.37e-24 | 3.30e-01 | 0.116 |
| 10193 | RNF41 | P11T-E | Human | Esophagus | ESCC | 9.02e-08 | 2.86e-01 | 0.1426 |
| 10193 | RNF41 | P12T-E | Human | Esophagus | ESCC | 3.90e-21 | 3.39e-01 | 0.1122 |
| 10193 | RNF41 | P15T-E | Human | Esophagus | ESCC | 4.16e-15 | 3.21e-01 | 0.1149 |
| 10193 | RNF41 | P16T-E | Human | Esophagus | ESCC | 3.41e-19 | 3.69e-01 | 0.1153 |
| 10193 | RNF41 | P17T-E | Human | Esophagus | ESCC | 2.06e-02 | 2.40e-01 | 0.1278 |
| 10193 | RNF41 | P19T-E | Human | Esophagus | ESCC | 4.06e-06 | 4.02e-01 | 0.1662 |
| 10193 | RNF41 | P20T-E | Human | Esophagus | ESCC | 4.07e-17 | 3.33e-01 | 0.1124 |
| 10193 | RNF41 | P21T-E | Human | Esophagus | ESCC | 5.78e-15 | 2.73e-01 | 0.1617 |
| 10193 | RNF41 | P22T-E | Human | Esophagus | ESCC | 1.12e-17 | 2.06e-01 | 0.1236 |
| 10193 | RNF41 | P23T-E | Human | Esophagus | ESCC | 3.13e-26 | 4.82e-01 | 0.108 |
| 10193 | RNF41 | P24T-E | Human | Esophagus | ESCC | 8.39e-21 | 3.05e-01 | 0.1287 |
| Page: 1 2 3 4 5 |
| Tissue | Expression Dynamics | Abbreviation |
| Esophagus | 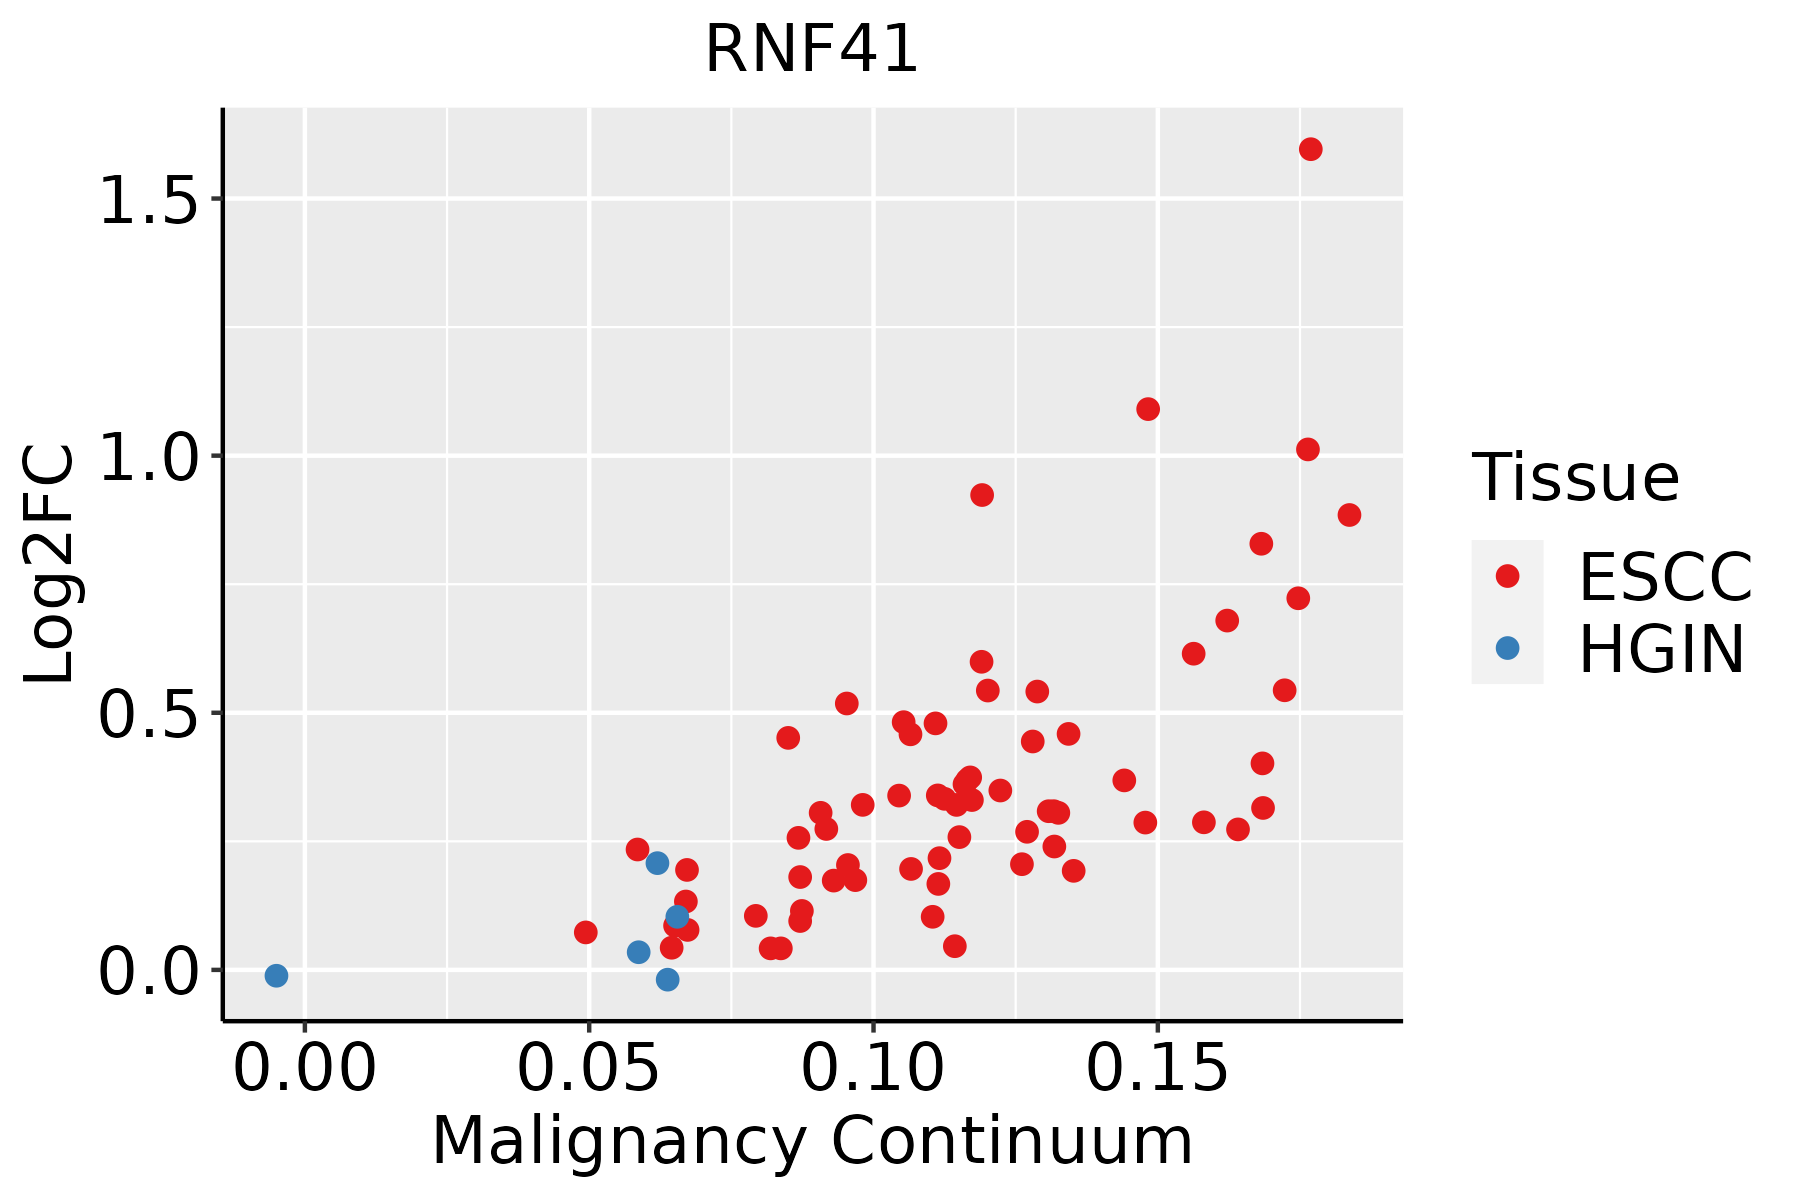 | ESCC: Esophageal squamous cell carcinoma |
| HGIN: High-grade intraepithelial neoplasias | ||
| LGIN: Low-grade intraepithelial neoplasias | ||
| Liver | 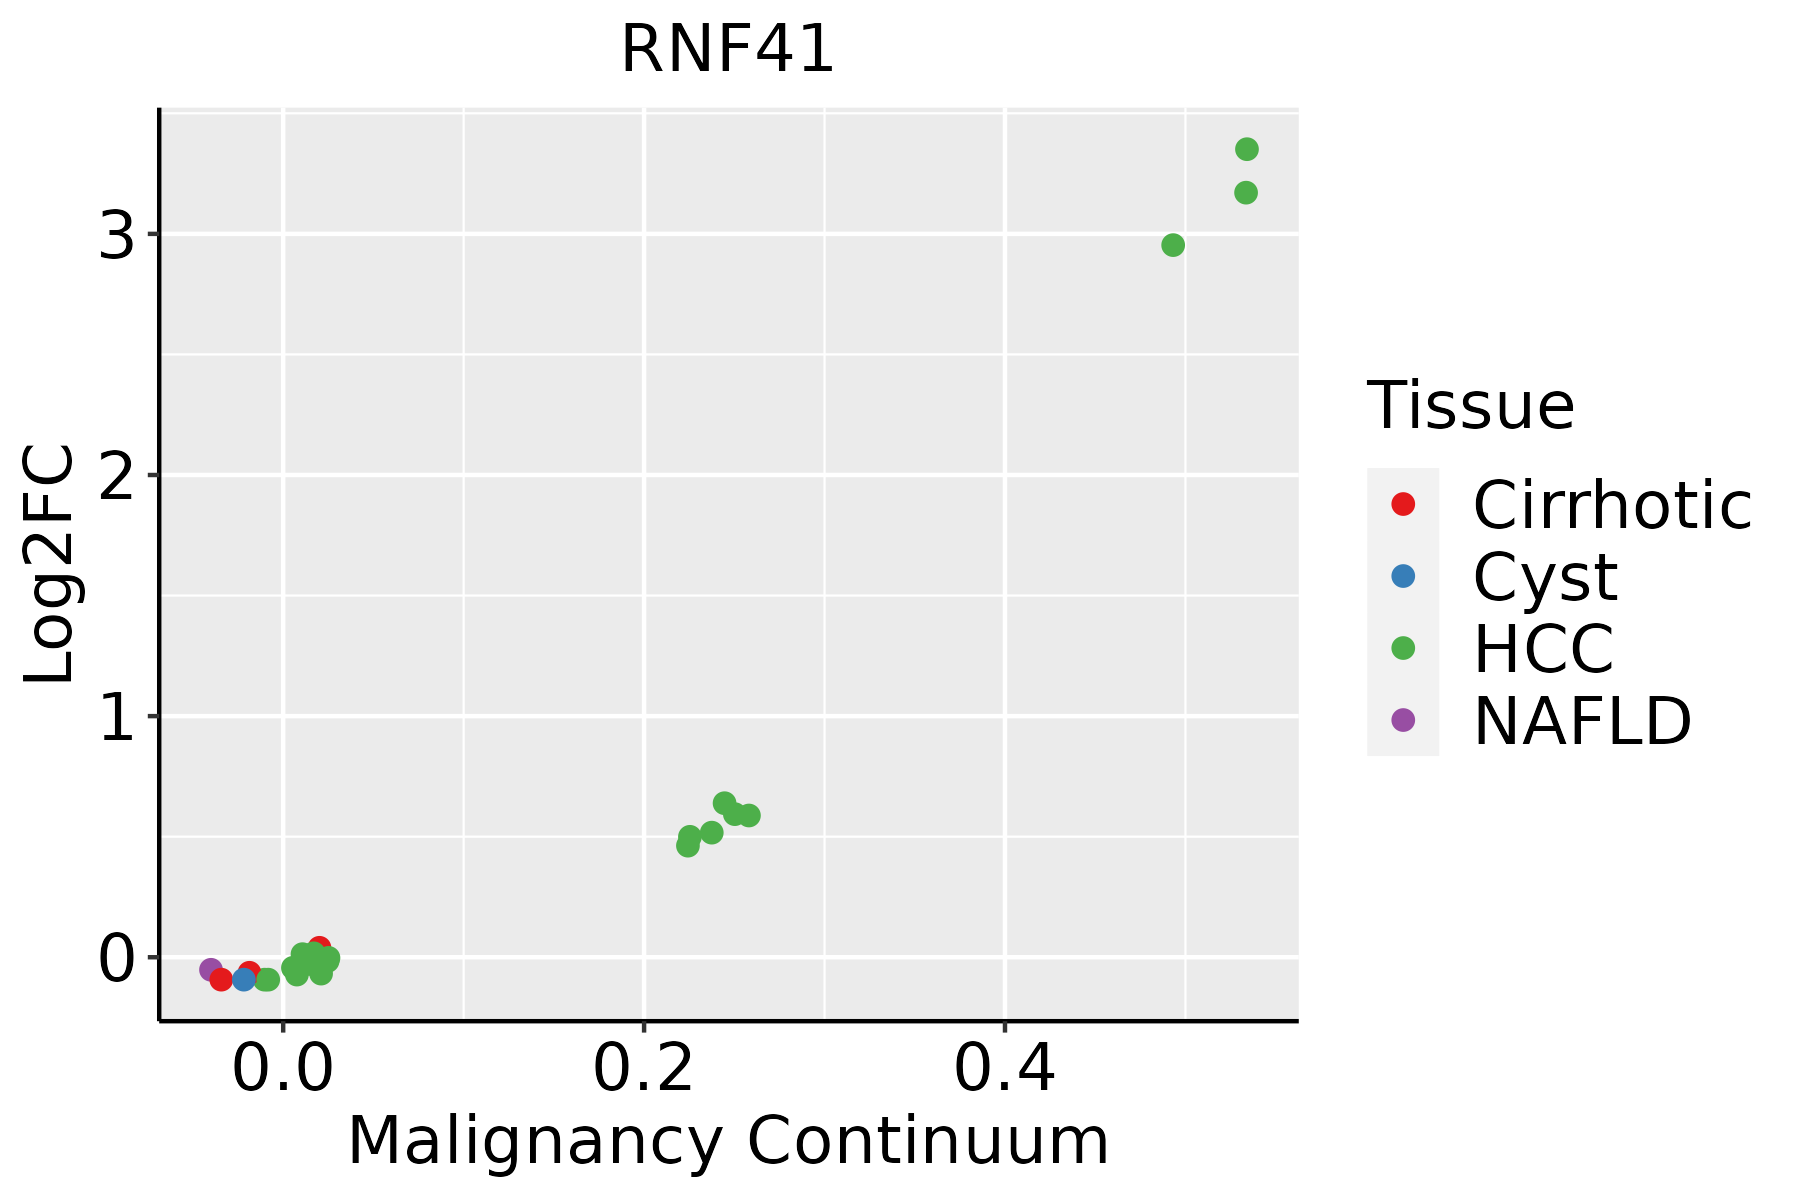 | HCC: Hepatocellular carcinoma |
| NAFLD: Non-alcoholic fatty liver disease | ||
| Oral Cavity |  | EOLP: Erosive Oral lichen planus |
| LP: leukoplakia | ||
| NEOLP: Non-erosive oral lichen planus | ||
| OSCC: Oral squamous cell carcinoma | ||
| Thyroid | 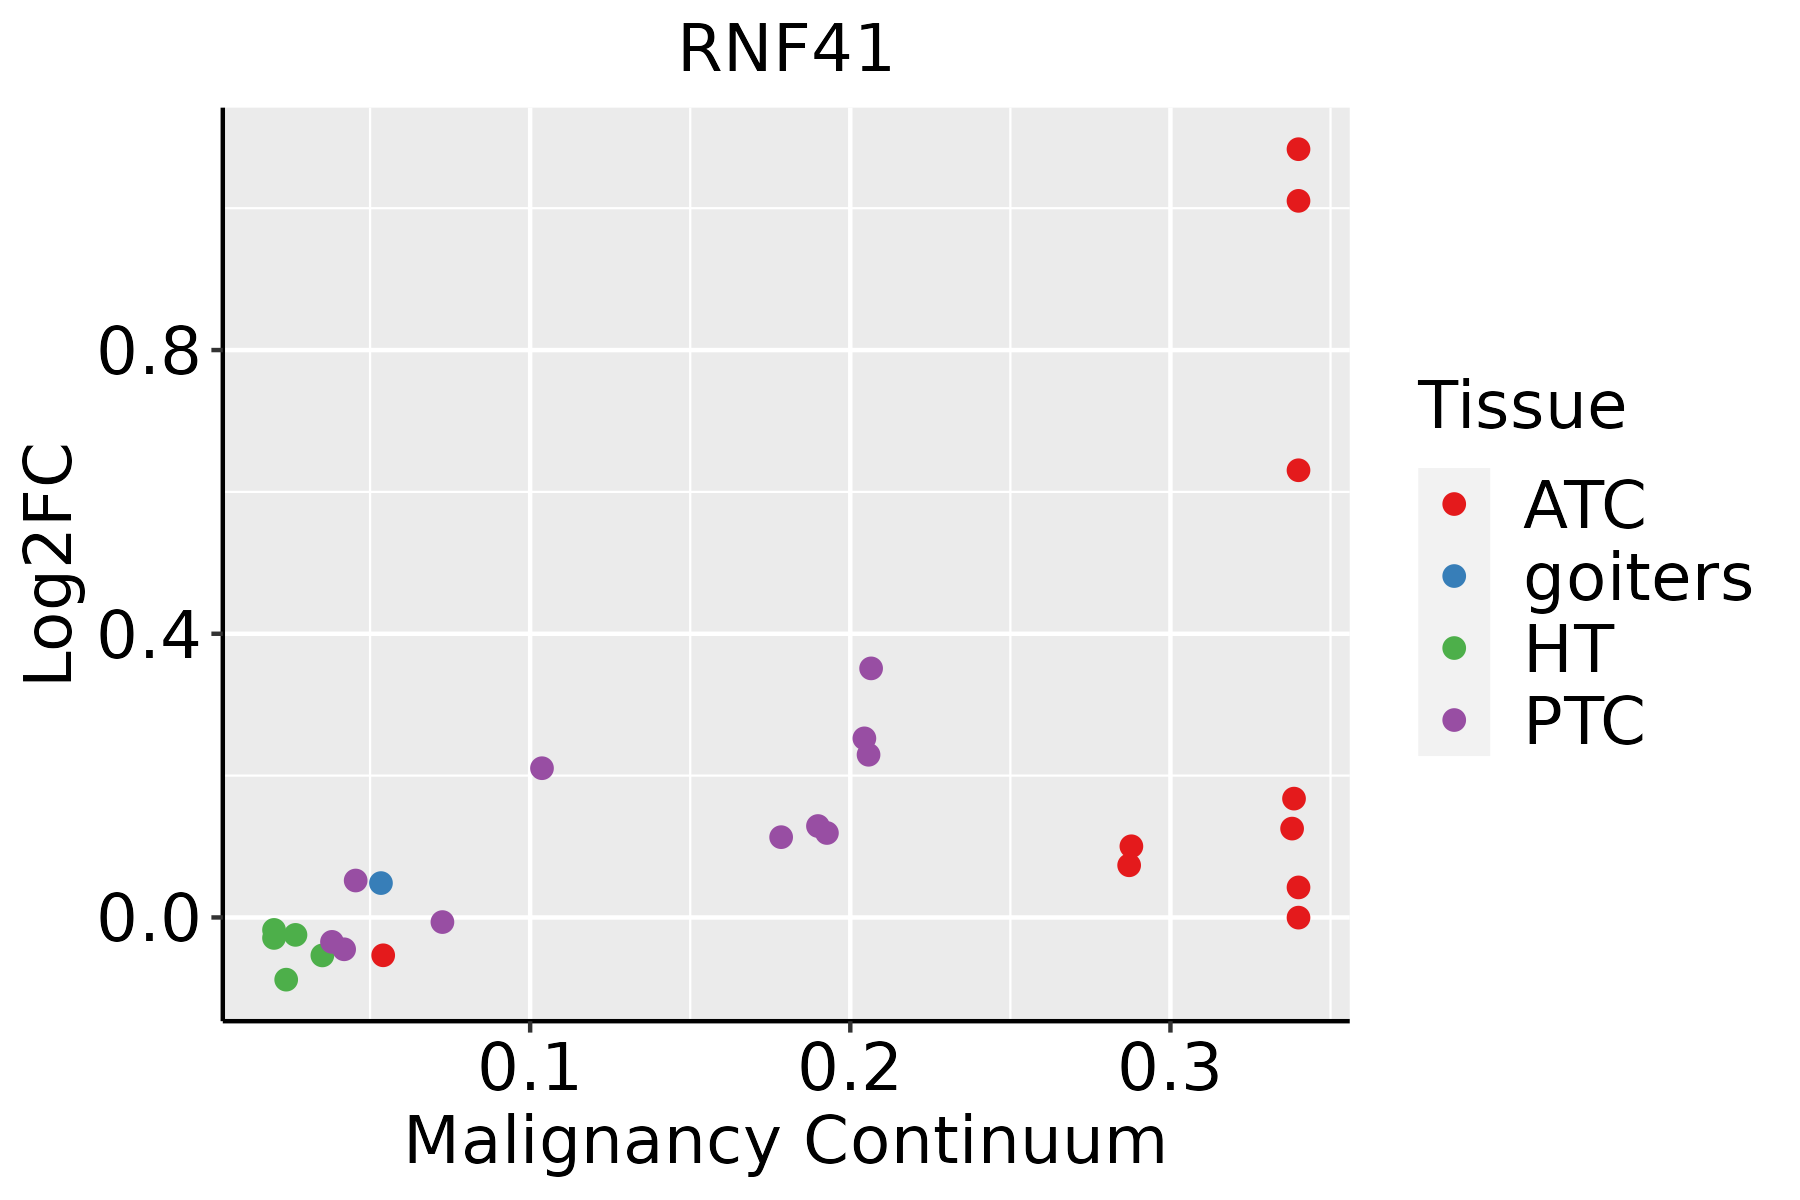 | ATC: Anaplastic thyroid cancer |
| HT: Hashimoto's thyroiditis | ||
| PTC: Papillary thyroid cancer |
| ∗log2FC in expression of this searched gene in stem-like cells from each diseased tissue sample relative to stem-like cells in normal samples in each tissue plotted against the malignancy continuum. Samples are colored based on if they are from different disease stage. |
Top |
Malignant transformation related pathway analysis |
| Find out the enriched GO biological processes and KEGG pathways involved in transition from healthy to precancer to cancer |
| Tissue | Disease Stage | Enriched GO biological Processes |
| Colorectum | AD |  |
| Colorectum | SER |  |
| Colorectum | MSS |  |
| Colorectum | MSI-H |  |
| Colorectum | FAP |  |
| ∗Top 15 enriched GO BP terms are showed in the bar plot of each disease state in each tissue. Each row represents a significant GO biological process which is colored according to the -log10(p.adjust). |
| Page: 1 2 3 4 5 6 7 8 9 |
| GO ID | Tissue | Disease Stage | Description | Gene Ratio | Bg Ratio | pvalue | p.adjust | Count |
| GO:0010498111 | Esophagus | ESCC | proteasomal protein catabolic process | 369/8552 | 490/18723 | 1.13e-41 | 1.80e-38 | 369 |
| GO:0042176111 | Esophagus | ESCC | regulation of protein catabolic process | 280/8552 | 391/18723 | 8.65e-26 | 2.39e-23 | 280 |
| GO:0009896111 | Esophagus | ESCC | positive regulation of catabolic process | 332/8552 | 492/18723 | 4.36e-23 | 9.22e-21 | 332 |
| GO:000020917 | Esophagus | ESCC | protein polyubiquitination | 170/8552 | 236/18723 | 1.40e-16 | 1.09e-14 | 170 |
| GO:0045732111 | Esophagus | ESCC | positive regulation of protein catabolic process | 167/8552 | 231/18723 | 1.47e-16 | 1.14e-14 | 167 |
| GO:0097191111 | Esophagus | ESCC | extrinsic apoptotic signaling pathway | 159/8552 | 219/18723 | 4.12e-16 | 2.94e-14 | 159 |
| GO:200037718 | Esophagus | ESCC | regulation of reactive oxygen species metabolic process | 100/8552 | 157/18723 | 3.87e-06 | 4.17e-05 | 100 |
| GO:007259318 | Esophagus | ESCC | reactive oxygen species metabolic process | 137/8552 | 239/18723 | 1.82e-04 | 1.16e-03 | 137 |
| GO:00518658 | Esophagus | ESCC | protein autoubiquitination | 47/8552 | 73/18723 | 9.72e-04 | 4.93e-03 | 47 |
| GO:200037918 | Esophagus | ESCC | positive regulation of reactive oxygen species metabolic process | 45/8552 | 76/18723 | 1.21e-02 | 4.04e-02 | 45 |
| GO:001049822 | Liver | HCC | proteasomal protein catabolic process | 351/7958 | 490/18723 | 6.92e-40 | 1.46e-36 | 351 |
| GO:000989622 | Liver | HCC | positive regulation of catabolic process | 335/7958 | 492/18723 | 3.83e-31 | 1.87e-28 | 335 |
| GO:004217622 | Liver | HCC | regulation of protein catabolic process | 267/7958 | 391/18723 | 2.45e-25 | 7.38e-23 | 267 |
| GO:004573222 | Liver | HCC | positive regulation of protein catabolic process | 163/7958 | 231/18723 | 4.00e-18 | 4.69e-16 | 163 |
| GO:009719122 | Liver | HCC | extrinsic apoptotic signaling pathway | 143/7958 | 219/18723 | 6.99e-12 | 2.97e-10 | 143 |
| GO:000020921 | Liver | HCC | protein polyubiquitination | 151/7958 | 236/18723 | 1.90e-11 | 7.59e-10 | 151 |
| GO:200037722 | Liver | HCC | regulation of reactive oxygen species metabolic process | 92/7958 | 157/18723 | 3.34e-05 | 3.35e-04 | 92 |
| GO:200037912 | Liver | HCC | positive regulation of reactive oxygen species metabolic process | 47/7958 | 76/18723 | 5.19e-04 | 3.38e-03 | 47 |
| GO:007259312 | Liver | HCC | reactive oxygen species metabolic process | 124/7958 | 239/18723 | 2.05e-03 | 1.04e-02 | 124 |
| GO:00518654 | Liver | HCC | protein autoubiquitination | 42/7958 | 73/18723 | 6.78e-03 | 2.73e-02 | 42 |
| Page: 1 2 3 |
| Pathway ID | Tissue | Disease Stage | Description | Gene Ratio | Bg Ratio | pvalue | p.adjust | qvalue | Count |
| hsa04144210 | Esophagus | ESCC | Endocytosis | 186/4205 | 251/8465 | 9.74e-16 | 4.66e-14 | 2.39e-14 | 186 |
| hsa0414437 | Esophagus | ESCC | Endocytosis | 186/4205 | 251/8465 | 9.74e-16 | 4.66e-14 | 2.39e-14 | 186 |
| hsa0414422 | Liver | HCC | Endocytosis | 178/4020 | 251/8465 | 2.03e-14 | 5.22e-13 | 2.91e-13 | 178 |
| hsa0414432 | Liver | HCC | Endocytosis | 178/4020 | 251/8465 | 2.03e-14 | 5.22e-13 | 2.91e-13 | 178 |
| hsa0414427 | Oral cavity | OSCC | Endocytosis | 174/3704 | 251/8465 | 9.42e-17 | 4.51e-15 | 2.29e-15 | 174 |
| hsa04144112 | Oral cavity | OSCC | Endocytosis | 174/3704 | 251/8465 | 9.42e-17 | 4.51e-15 | 2.29e-15 | 174 |
| Page: 1 |
Top |
Cell-cell communication analysis |
| Identification of potential cell-cell interactions between two cell types and their ligand-receptor pairs for different disease states |
| Ligand | Receptor | LRpair | Pathway | Tissue | Disease Stage |
| Page: 1 |
Top |
Single-cell gene regulatory network inference analysis |
| Find out the significant the regulons (TFs) and the target genes of each regulon across cell types for different disease states |
| TF | Cell Type | Tissue | Disease Stage | Target Gene | RSS | Regulon Activity |
| ∗The dot plots of a searched regulon are shown for all cell subpopulations in each disease state of each tissue based on the regulon specific score inferred using pySCENIC and by calculating the average expression. |
| Page: 1 |
Top |
Somatic mutation of malignant transformation related genes |
| Annotation of somatic variants for genes involved in malignant transformation |
| Hugo Symbol | Variant Class | Variant Classification | dbSNP RS | HGVSc | HGVSp | HGVSp Short | SWISSPROT | BIOTYPE | SIFT | PolyPhen | Tumor Sample Barcode | Tissue | Histology | Sex | Age | Stage | Therapy Types | Drugs | Outcome |
| RNF41 | SNV | Missense_Mutation | rs753102644 | c.733N>A | p.Glu245Lys | p.E245K | Q9H4P4 | protein_coding | tolerated(0.65) | benign(0.013) | TCGA-AN-A046-01 | Breast | breast invasive carcinoma | Female | >=65 | I/II | Unknown | Unknown | SD |
| RNF41 | SNV | Missense_Mutation | rs758444976 | c.533G>A | p.Arg178His | p.R178H | Q9H4P4 | protein_coding | tolerated(0.08) | benign(0.2) | TCGA-E2-A1BD-01 | Breast | breast invasive carcinoma | Female | <65 | I/II | Hormone Therapy | arimidex | SD |
| RNF41 | insertion | In_Frame_Ins | novel | c.499-1_499insCCTGTCTCAAAAAAAGAAAAGAAGAAAAGAAAAAGGGATATC | p.Gln166_Lys167insProValSerLysLysGluLysLysLysArgLysArgAspIle | p.Q166_K167insPVSKKEKKKRKRDI | Q9H4P4 | protein_coding | TCGA-AN-A041-01 | Breast | breast invasive carcinoma | Female | <65 | I/II | Unknown | Unknown | SD | ||
| RNF41 | deletion | Frame_Shift_Del | novel | c.31delN | p.Asp11MetfsTer50 | p.D11Mfs*50 | Q9H4P4 | protein_coding | TCGA-D8-A27V-01 | Breast | breast invasive carcinoma | Female | <65 | I/II | Hormone Therapy | tamoxiphen | SD | ||
| RNF41 | SNV | Missense_Mutation | rs201033187 | c.252N>A | p.Asp84Glu | p.D84E | Q9H4P4 | protein_coding | tolerated(0.5) | benign(0.012) | TCGA-C5-A902-01 | Cervix | cervical & endocervical cancer | Female | <65 | I/II | Chemotherapy | cisplatin | SD |
| RNF41 | SNV | Missense_Mutation | c.457N>A | p.Glu153Lys | p.E153K | Q9H4P4 | protein_coding | tolerated(1) | benign(0.001) | TCGA-EK-A3GK-01 | Cervix | cervical & endocervical cancer | Female | <65 | I/II | Unknown | Unknown | SD | |
| RNF41 | SNV | Missense_Mutation | c.382N>A | p.Glu128Lys | p.E128K | Q9H4P4 | protein_coding | deleterious(0) | probably_damaging(0.922) | TCGA-IR-A3LH-01 | Cervix | cervical & endocervical cancer | Female | <65 | I/II | Chemotherapy | cisplatin | CR | |
| RNF41 | SNV | Missense_Mutation | c.874N>A | p.Glu292Lys | p.E292K | Q9H4P4 | protein_coding | deleterious(0.01) | probably_damaging(0.93) | TCGA-IR-A3LK-01 | Cervix | cervical & endocervical cancer | Female | >=65 | I/II | Chemotherapy | cisplatin | PD | |
| RNF41 | SNV | Missense_Mutation | c.787G>C | p.Glu263Gln | p.E263Q | Q9H4P4 | protein_coding | tolerated(0.05) | possibly_damaging(0.811) | TCGA-JW-A5VL-01 | Cervix | cervical & endocervical cancer | Female | <65 | I/II | Unknown | Unknown | SD | |
| RNF41 | SNV | Missense_Mutation | rs372811152 | c.415N>T | p.Arg139Cys | p.R139C | Q9H4P4 | protein_coding | deleterious(0) | probably_damaging(0.998) | TCGA-MA-AA41-01 | Cervix | cervical & endocervical cancer | Female | <65 | I/II | Unknown | Unknown | SD |
| Page: 1 2 3 4 5 |
Top |
Related drugs of malignant transformation related genes |
| Identification of chemicals and drugs interact with genes involved in malignant transfromation |
| (DGIdb 4.0) |
| Entrez ID | Symbol | Category | Interaction Types | Drug Claim Name | Drug Name | PMIDs |
| Page: 1 |

Copyright 2023-Present -The University of Texas Health Science Center at Houston |