
|
|||||
|
 | |
| |
| |
| |
| |
| |
|
Gene: RNF4 |
Gene summary for RNF4 |
| Gene information | Species | Human | Gene symbol | RNF4 | Gene ID | 6047 |
| Gene name | ring finger protein 4 | |
| Gene Alias | RES4-26 | |
| Cytomap | 4p16.3 | |
| Gene Type | protein-coding | GO ID | GO:0000209 | UniProtAcc | P78317 |
Top |
Malignant transformation analysis |
| Identification of the aberrant gene expression in precancerous and cancerous lesions by comparing the gene expression of stem-like cells in diseased tissues with normal stem cells |
| Entrez ID | Symbol | Replicates | Species | Organ | Tissue | Adj P-value | Log2FC | Malignancy |
| 6047 | RNF4 | LZE4T | Human | Esophagus | ESCC | 1.06e-03 | 4.70e-02 | 0.0811 |
| 6047 | RNF4 | LZE7T | Human | Esophagus | ESCC | 1.79e-06 | 6.06e-01 | 0.0667 |
| 6047 | RNF4 | LZE24T | Human | Esophagus | ESCC | 5.58e-06 | 2.11e-01 | 0.0596 |
| 6047 | RNF4 | LZE6T | Human | Esophagus | ESCC | 3.56e-04 | 3.09e-01 | 0.0845 |
| 6047 | RNF4 | P1T-E | Human | Esophagus | ESCC | 3.92e-04 | 3.08e-01 | 0.0875 |
| 6047 | RNF4 | P2T-E | Human | Esophagus | ESCC | 7.37e-23 | 4.55e-01 | 0.1177 |
| 6047 | RNF4 | P4T-E | Human | Esophagus | ESCC | 3.39e-16 | 2.42e-01 | 0.1323 |
| 6047 | RNF4 | P5T-E | Human | Esophagus | ESCC | 2.51e-09 | 2.04e-01 | 0.1327 |
| 6047 | RNF4 | P8T-E | Human | Esophagus | ESCC | 9.00e-19 | 4.46e-01 | 0.0889 |
| 6047 | RNF4 | P9T-E | Human | Esophagus | ESCC | 1.37e-08 | 1.04e-01 | 0.1131 |
| 6047 | RNF4 | P10T-E | Human | Esophagus | ESCC | 1.20e-17 | 2.72e-01 | 0.116 |
| 6047 | RNF4 | P11T-E | Human | Esophagus | ESCC | 2.03e-10 | 2.98e-01 | 0.1426 |
| 6047 | RNF4 | P12T-E | Human | Esophagus | ESCC | 5.09e-09 | 2.75e-01 | 0.1122 |
| 6047 | RNF4 | P15T-E | Human | Esophagus | ESCC | 7.41e-10 | 1.34e-01 | 0.1149 |
| 6047 | RNF4 | P16T-E | Human | Esophagus | ESCC | 1.40e-14 | 2.95e-01 | 0.1153 |
| 6047 | RNF4 | P17T-E | Human | Esophagus | ESCC | 1.50e-06 | 3.66e-01 | 0.1278 |
| 6047 | RNF4 | P19T-E | Human | Esophagus | ESCC | 7.54e-04 | 4.16e-01 | 0.1662 |
| 6047 | RNF4 | P20T-E | Human | Esophagus | ESCC | 5.19e-19 | 2.66e-01 | 0.1124 |
| 6047 | RNF4 | P21T-E | Human | Esophagus | ESCC | 1.36e-09 | 1.52e-01 | 0.1617 |
| 6047 | RNF4 | P22T-E | Human | Esophagus | ESCC | 3.12e-21 | 1.73e-01 | 0.1236 |
| Page: 1 2 3 4 5 |
| Tissue | Expression Dynamics | Abbreviation |
| Esophagus | 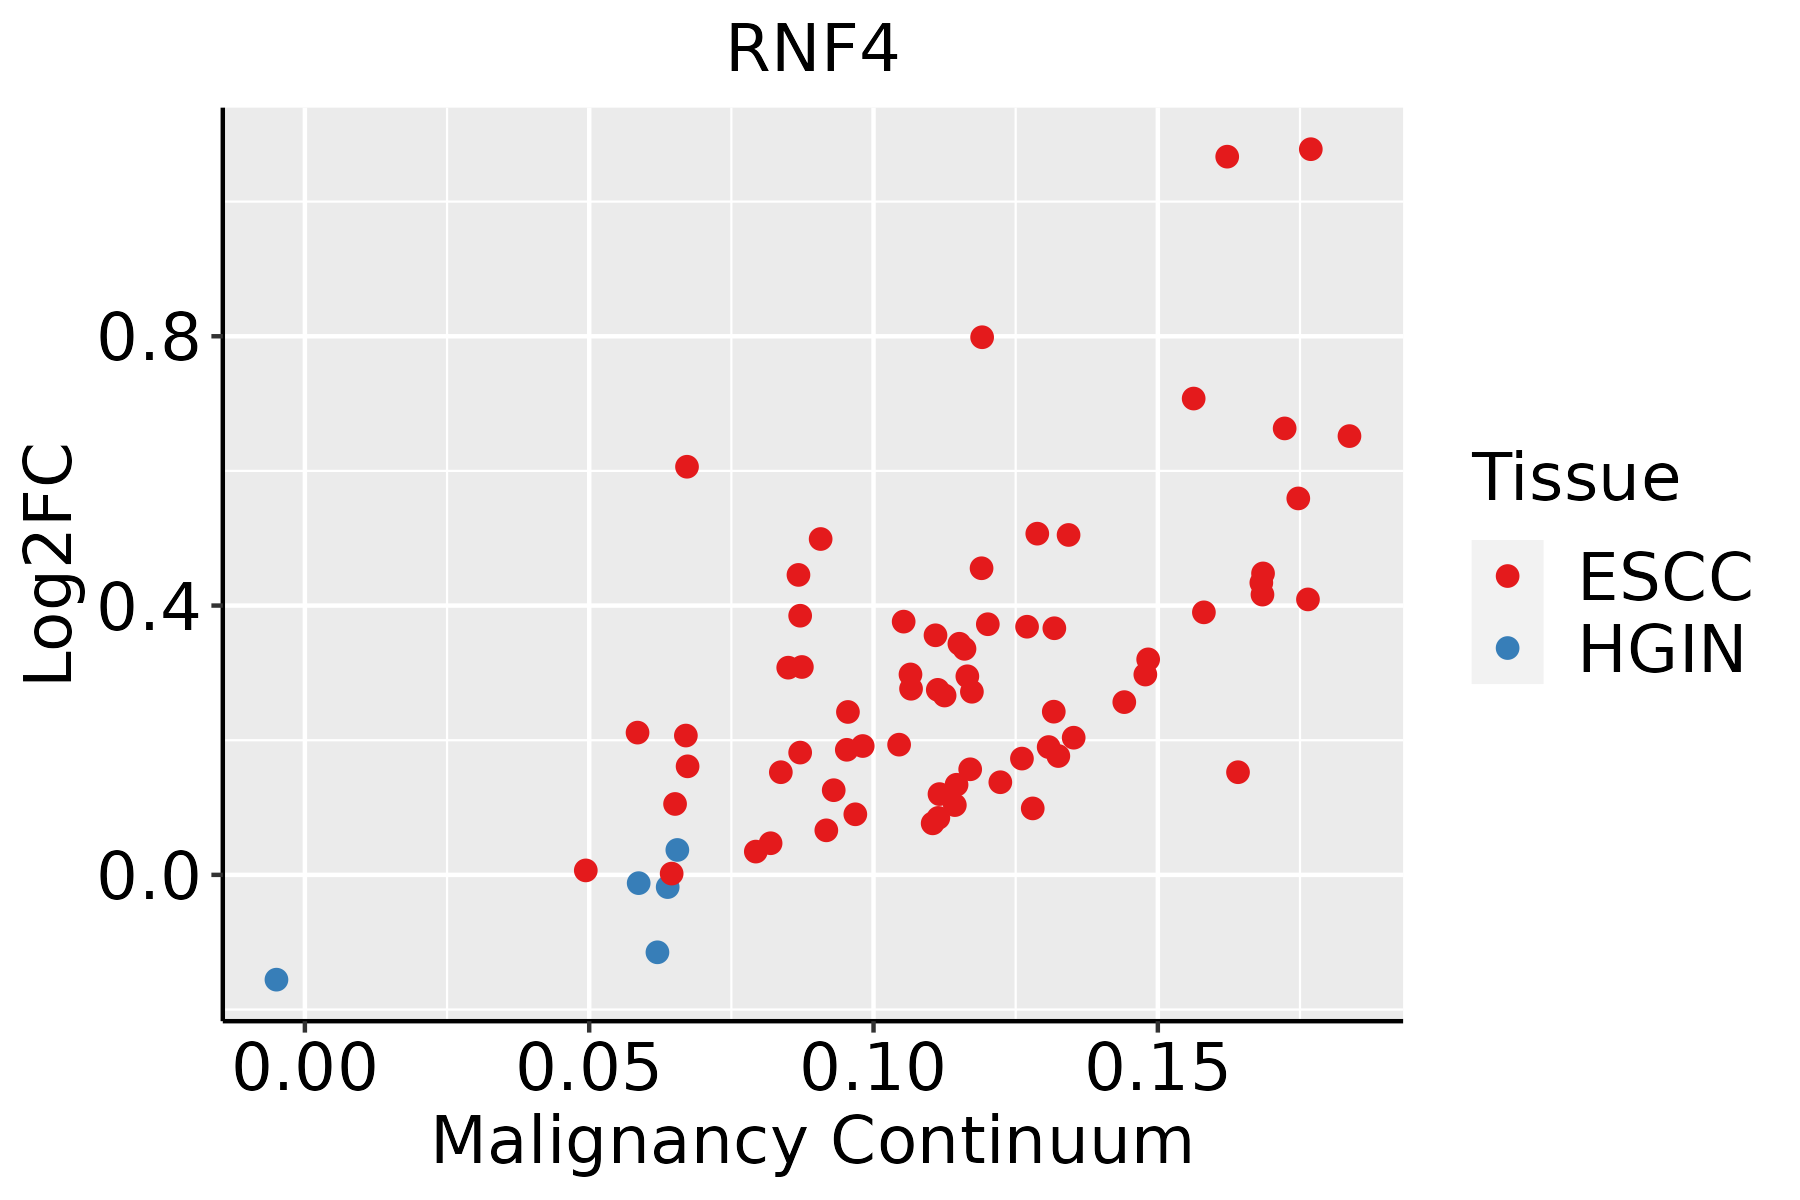 | ESCC: Esophageal squamous cell carcinoma |
| HGIN: High-grade intraepithelial neoplasias | ||
| LGIN: Low-grade intraepithelial neoplasias | ||
| Liver | 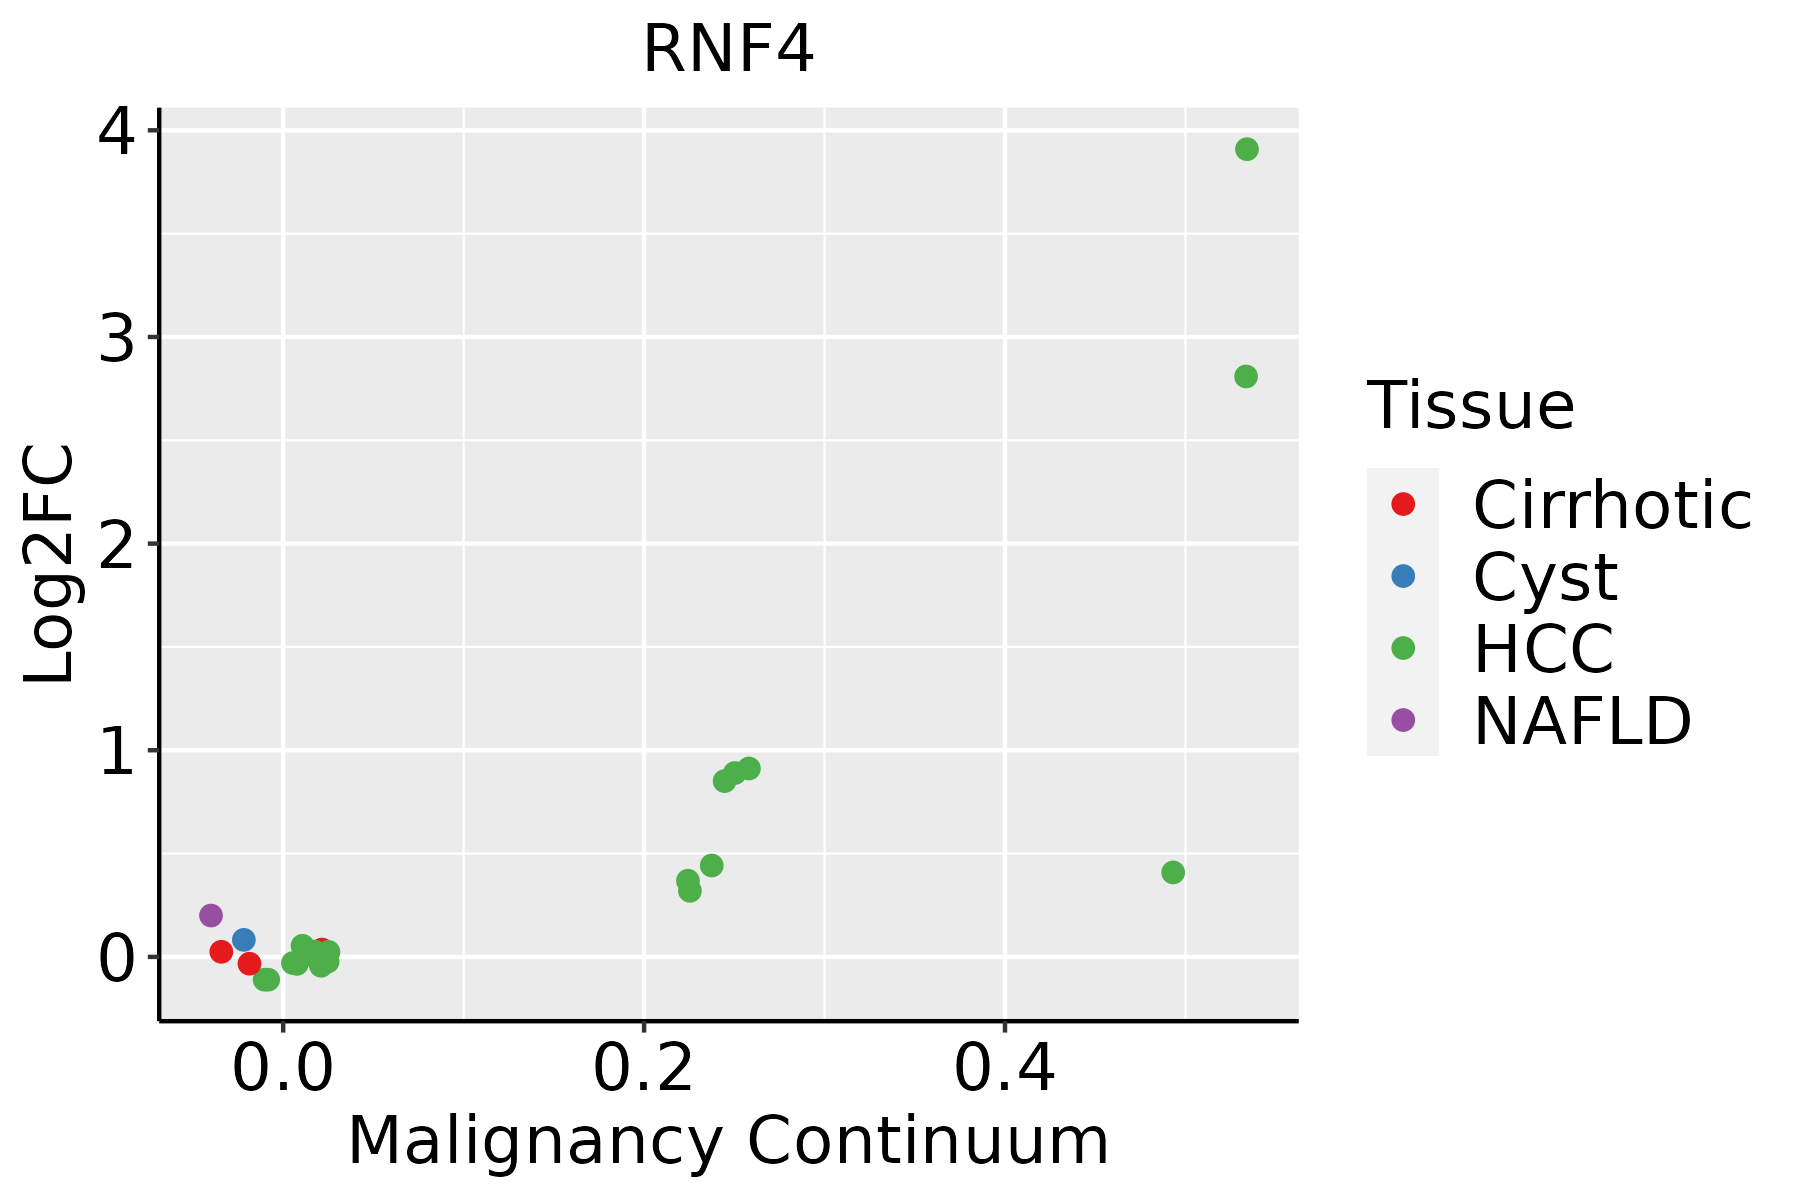 | HCC: Hepatocellular carcinoma |
| NAFLD: Non-alcoholic fatty liver disease | ||
| Oral Cavity |  | EOLP: Erosive Oral lichen planus |
| LP: leukoplakia | ||
| NEOLP: Non-erosive oral lichen planus | ||
| OSCC: Oral squamous cell carcinoma | ||
| Thyroid | 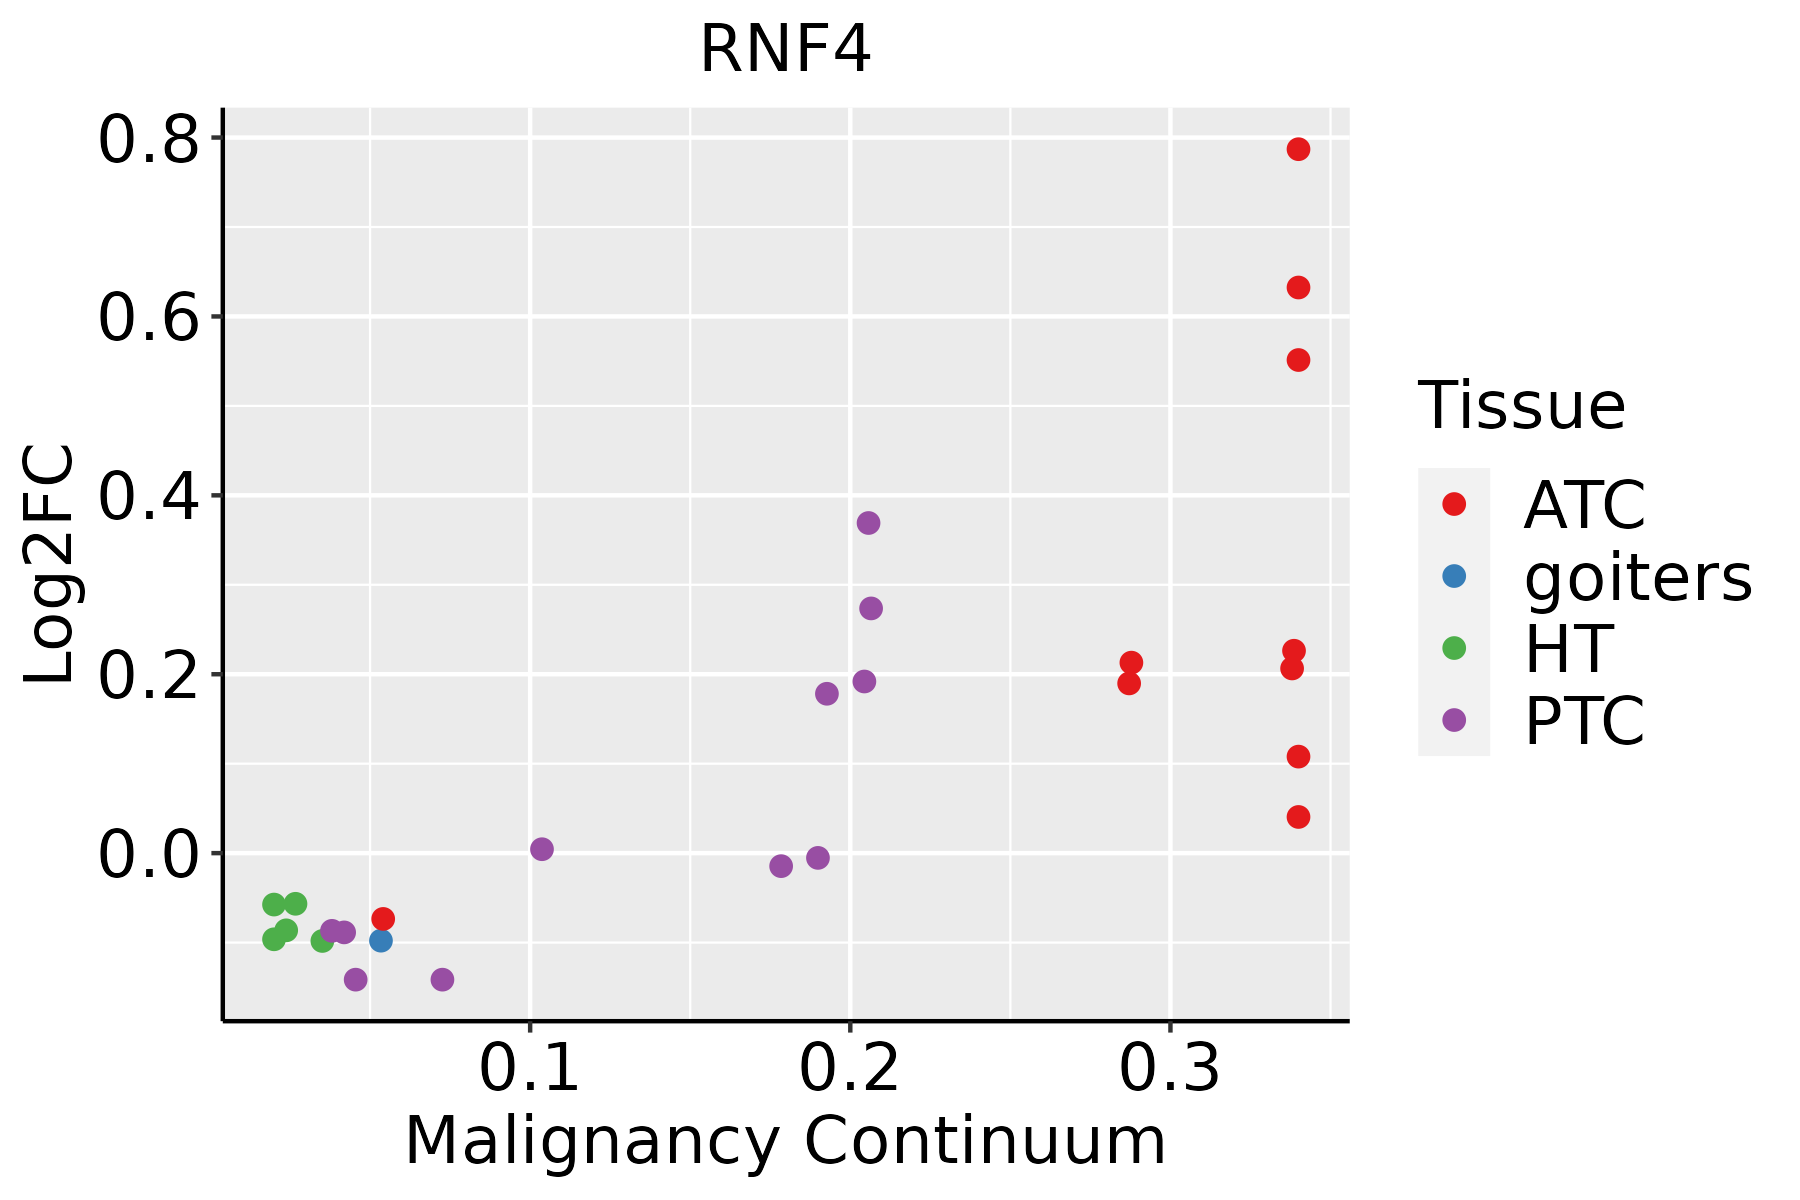 | ATC: Anaplastic thyroid cancer |
| HT: Hashimoto's thyroiditis | ||
| PTC: Papillary thyroid cancer |
| ∗log2FC in expression of this searched gene in stem-like cells from each diseased tissue sample relative to stem-like cells in normal samples in each tissue plotted against the malignancy continuum. Samples are colored based on if they are from different disease stage. |
Top |
Malignant transformation related pathway analysis |
| Find out the enriched GO biological processes and KEGG pathways involved in transition from healthy to precancer to cancer |
| Tissue | Disease Stage | Enriched GO biological Processes |
| Colorectum | AD |  |
| Colorectum | SER |  |
| Colorectum | MSS |  |
| Colorectum | MSI-H |  |
| Colorectum | FAP |  |
| ∗Top 15 enriched GO BP terms are showed in the bar plot of each disease state in each tissue. Each row represents a significant GO biological process which is colored according to the -log10(p.adjust). |
| Page: 1 2 3 4 5 6 7 8 9 |
| GO ID | Tissue | Disease Stage | Description | Gene Ratio | Bg Ratio | pvalue | p.adjust | Count |
| GO:0043112 | Colorectum | AD | receptor metabolic process | 62/3918 | 166/18723 | 8.18e-07 | 2.85e-05 | 62 |
| GO:0030111 | Colorectum | AD | regulation of Wnt signaling pathway | 102/3918 | 328/18723 | 8.51e-06 | 2.03e-04 | 102 |
| GO:0016055 | Colorectum | AD | Wnt signaling pathway | 130/3918 | 444/18723 | 1.60e-05 | 3.37e-04 | 130 |
| GO:0198738 | Colorectum | AD | cell-cell signaling by wnt | 130/3918 | 446/18723 | 2.02e-05 | 4.10e-04 | 130 |
| GO:0032801 | Colorectum | AD | receptor catabolic process | 12/3918 | 28/18723 | 7.21e-03 | 4.39e-02 | 12 |
| GO:00160551 | Colorectum | SER | Wnt signaling pathway | 97/2897 | 444/18723 | 2.02e-04 | 3.68e-03 | 97 |
| GO:01987381 | Colorectum | SER | cell-cell signaling by wnt | 97/2897 | 446/18723 | 2.39e-04 | 4.11e-03 | 97 |
| GO:00301111 | Colorectum | SER | regulation of Wnt signaling pathway | 75/2897 | 328/18723 | 2.47e-04 | 4.20e-03 | 75 |
| GO:00301112 | Colorectum | MSS | regulation of Wnt signaling pathway | 98/3467 | 328/18723 | 3.37e-07 | 1.36e-05 | 98 |
| GO:00160552 | Colorectum | MSS | Wnt signaling pathway | 124/3467 | 444/18723 | 6.06e-07 | 2.26e-05 | 124 |
| GO:01987382 | Colorectum | MSS | cell-cell signaling by wnt | 124/3467 | 446/18723 | 7.83e-07 | 2.77e-05 | 124 |
| GO:00431121 | Colorectum | MSS | receptor metabolic process | 57/3467 | 166/18723 | 8.47e-07 | 2.97e-05 | 57 |
| GO:0030178 | Colorectum | MSS | negative regulation of Wnt signaling pathway | 48/3467 | 170/18723 | 1.23e-03 | 1.18e-02 | 48 |
| GO:00328011 | Colorectum | MSS | receptor catabolic process | 12/3467 | 28/18723 | 2.53e-03 | 2.02e-02 | 12 |
| GO:00160553 | Colorectum | FAP | Wnt signaling pathway | 104/2622 | 444/18723 | 4.92e-08 | 3.92e-06 | 104 |
| GO:01987383 | Colorectum | FAP | cell-cell signaling by wnt | 104/2622 | 446/18723 | 6.26e-08 | 4.54e-06 | 104 |
| GO:00301113 | Colorectum | FAP | regulation of Wnt signaling pathway | 81/2622 | 328/18723 | 1.44e-07 | 9.03e-06 | 81 |
| GO:00431122 | Colorectum | FAP | receptor metabolic process | 46/2622 | 166/18723 | 2.70e-06 | 1.02e-04 | 46 |
| GO:00301781 | Colorectum | FAP | negative regulation of Wnt signaling pathway | 38/2622 | 170/18723 | 2.06e-03 | 1.70e-02 | 38 |
| GO:00160554 | Colorectum | CRC | Wnt signaling pathway | 88/2078 | 444/18723 | 3.91e-08 | 5.28e-06 | 88 |
| Page: 1 2 3 4 5 6 7 8 9 10 11 12 13 14 15 16 17 18 |
| Pathway ID | Tissue | Disease Stage | Description | Gene Ratio | Bg Ratio | pvalue | p.adjust | qvalue | Count |
| Page: 1 |
Top |
Cell-cell communication analysis |
| Identification of potential cell-cell interactions between two cell types and their ligand-receptor pairs for different disease states |
| Ligand | Receptor | LRpair | Pathway | Tissue | Disease Stage |
| Page: 1 |
Top |
Single-cell gene regulatory network inference analysis |
| Find out the significant the regulons (TFs) and the target genes of each regulon across cell types for different disease states |
| TF | Cell Type | Tissue | Disease Stage | Target Gene | RSS | Regulon Activity |
| ∗The dot plots of a searched regulon are shown for all cell subpopulations in each disease state of each tissue based on the regulon specific score inferred using pySCENIC and by calculating the average expression. |
| Page: 1 |
Top |
Somatic mutation of malignant transformation related genes |
| Annotation of somatic variants for genes involved in malignant transformation |
| Hugo Symbol | Variant Class | Variant Classification | dbSNP RS | HGVSc | HGVSp | HGVSp Short | SWISSPROT | BIOTYPE | SIFT | PolyPhen | Tumor Sample Barcode | Tissue | Histology | Sex | Age | Stage | Therapy Types | Drugs | Outcome |
| RNF4 | SNV | Missense_Mutation | rs201229382 | c.361N>A | p.Ala121Thr | p.A121T | P78317 | protein_coding | tolerated(0.62) | benign(0) | TCGA-AA-3492-01 | Colorectum | colon adenocarcinoma | Female | >=65 | I/II | Unknown | Unknown | SD |
| RNF4 | SNV | Missense_Mutation | rs377313523 | c.491N>A | p.Arg164His | p.R164H | P78317 | protein_coding | tolerated(0.08) | benign(0.08) | TCGA-A5-A2K5-01 | Endometrium | uterine corpus endometrioid carcinoma | Female | >=65 | I/II | Unknown | Unknown | SD |
| RNF4 | SNV | Missense_Mutation | c.423G>T | p.Glu141Asp | p.E141D | P78317 | protein_coding | deleterious(0.03) | probably_damaging(0.999) | TCGA-AP-A051-01 | Endometrium | uterine corpus endometrioid carcinoma | Female | >=65 | I/II | Unknown | Unknown | SD | |
| RNF4 | SNV | Missense_Mutation | novel | c.346N>A | p.Ala116Thr | p.A116T | P78317 | protein_coding | tolerated(0.79) | benign(0) | TCGA-AP-A1DV-01 | Endometrium | uterine corpus endometrioid carcinoma | Female | <65 | I/II | Unknown | Unknown | SD |
| RNF4 | SNV | Missense_Mutation | rs767261720 | c.448G>A | p.Val150Ile | p.V150I | P78317 | protein_coding | tolerated(0.08) | benign(0.026) | TCGA-B5-A3FC-01 | Endometrium | uterine corpus endometrioid carcinoma | Female | <65 | I/II | Unknown | Unknown | SD |
| RNF4 | SNV | Missense_Mutation | rs750844745 | c.490N>T | p.Arg164Cys | p.R164C | P78317 | protein_coding | tolerated(0.16) | benign(0.035) | TCGA-D1-A167-01 | Endometrium | uterine corpus endometrioid carcinoma | Female | >=65 | I/II | Unknown | Unknown | SD |
| RNF4 | SNV | Missense_Mutation | novel | c.311N>A | p.Arg104Lys | p.R104K | P78317 | protein_coding | tolerated(0.6) | benign(0) | TCGA-FI-A2D0-01 | Endometrium | uterine corpus endometrioid carcinoma | Female | <65 | I/II | Unknown | Unknown | SD |
| RNF4 | SNV | Missense_Mutation | novel | c.467N>G | p.His156Arg | p.H156R | P78317 | protein_coding | deleterious(0) | probably_damaging(0.999) | TCGA-F7-A624-01 | Oral cavity | head & neck squamous cell carcinoma | Male | >=65 | I/II | Unknown | Unknown | SD |
| RNF4 | SNV | Missense_Mutation | c.421N>A | p.Glu141Lys | p.E141K | P78317 | protein_coding | deleterious(0) | probably_damaging(0.999) | TCGA-MT-A67F-01 | Oral cavity | head & neck squamous cell carcinoma | Female | <65 | I/II | Unknown | Unknown | SD |
| Page: 1 |
Top |
Related drugs of malignant transformation related genes |
| Identification of chemicals and drugs interact with genes involved in malignant transfromation |
| (DGIdb 4.0) |
| Entrez ID | Symbol | Category | Interaction Types | Drug Claim Name | Drug Name | PMIDs |
| Page: 1 |

Copyright 2023-Present -The University of Texas Health Science Center at Houston |