
|
|||||
|
 | |
| |
| |
| |
| |
| |
|
Gene: RNF39 |
Gene summary for RNF39 |
| Gene information | Species | Human | Gene symbol | RNF39 | Gene ID | 80352 |
| Gene name | ring finger protein 39 | |
| Gene Alias | FAP216 | |
| Cytomap | 6p22.1 | |
| Gene Type | protein-coding | GO ID | GO:0002376 | UniProtAcc | Q96QB5 |
Top |
Malignant transformation analysis |
| Identification of the aberrant gene expression in precancerous and cancerous lesions by comparing the gene expression of stem-like cells in diseased tissues with normal stem cells |
| Entrez ID | Symbol | Replicates | Species | Organ | Tissue | Adj P-value | Log2FC | Malignancy |
| 80352 | RNF39 | LZE4T | Human | Esophagus | ESCC | 4.17e-02 | 2.25e-02 | 0.0811 |
| 80352 | RNF39 | LZE8T | Human | Esophagus | ESCC | 2.42e-05 | 1.12e-01 | 0.067 |
| 80352 | RNF39 | LZE24T | Human | Esophagus | ESCC | 1.17e-21 | 9.49e-01 | 0.0596 |
| 80352 | RNF39 | P1T-E | Human | Esophagus | ESCC | 9.17e-22 | 1.63e+00 | 0.0875 |
| 80352 | RNF39 | P2T-E | Human | Esophagus | ESCC | 4.65e-10 | 9.46e-02 | 0.1177 |
| 80352 | RNF39 | P4T-E | Human | Esophagus | ESCC | 2.17e-05 | 2.07e-01 | 0.1323 |
| 80352 | RNF39 | P8T-E | Human | Esophagus | ESCC | 6.28e-22 | 8.22e-01 | 0.0889 |
| 80352 | RNF39 | P10T-E | Human | Esophagus | ESCC | 1.70e-06 | 9.95e-02 | 0.116 |
| 80352 | RNF39 | P16T-E | Human | Esophagus | ESCC | 3.87e-03 | 8.50e-02 | 0.1153 |
| 80352 | RNF39 | P22T-E | Human | Esophagus | ESCC | 1.20e-02 | 1.40e-01 | 0.1236 |
| 80352 | RNF39 | P23T-E | Human | Esophagus | ESCC | 3.82e-15 | 9.86e-01 | 0.108 |
| 80352 | RNF39 | P26T-E | Human | Esophagus | ESCC | 2.39e-09 | 3.65e-01 | 0.1276 |
| 80352 | RNF39 | P27T-E | Human | Esophagus | ESCC | 2.78e-12 | 5.87e-01 | 0.1055 |
| 80352 | RNF39 | P30T-E | Human | Esophagus | ESCC | 4.49e-08 | 3.95e-01 | 0.137 |
| 80352 | RNF39 | P39T-E | Human | Esophagus | ESCC | 2.78e-07 | 6.01e-01 | 0.0894 |
| 80352 | RNF39 | P42T-E | Human | Esophagus | ESCC | 6.48e-07 | 3.63e-01 | 0.1175 |
| 80352 | RNF39 | P47T-E | Human | Esophagus | ESCC | 9.72e-08 | 4.91e-01 | 0.1067 |
| 80352 | RNF39 | P48T-E | Human | Esophagus | ESCC | 1.34e-08 | 3.54e-01 | 0.0959 |
| 80352 | RNF39 | P52T-E | Human | Esophagus | ESCC | 2.85e-03 | 1.47e-03 | 0.1555 |
| 80352 | RNF39 | P54T-E | Human | Esophagus | ESCC | 1.69e-13 | 7.09e-01 | 0.0975 |
| Page: 1 2 3 |
| Tissue | Expression Dynamics | Abbreviation |
| Esophagus | 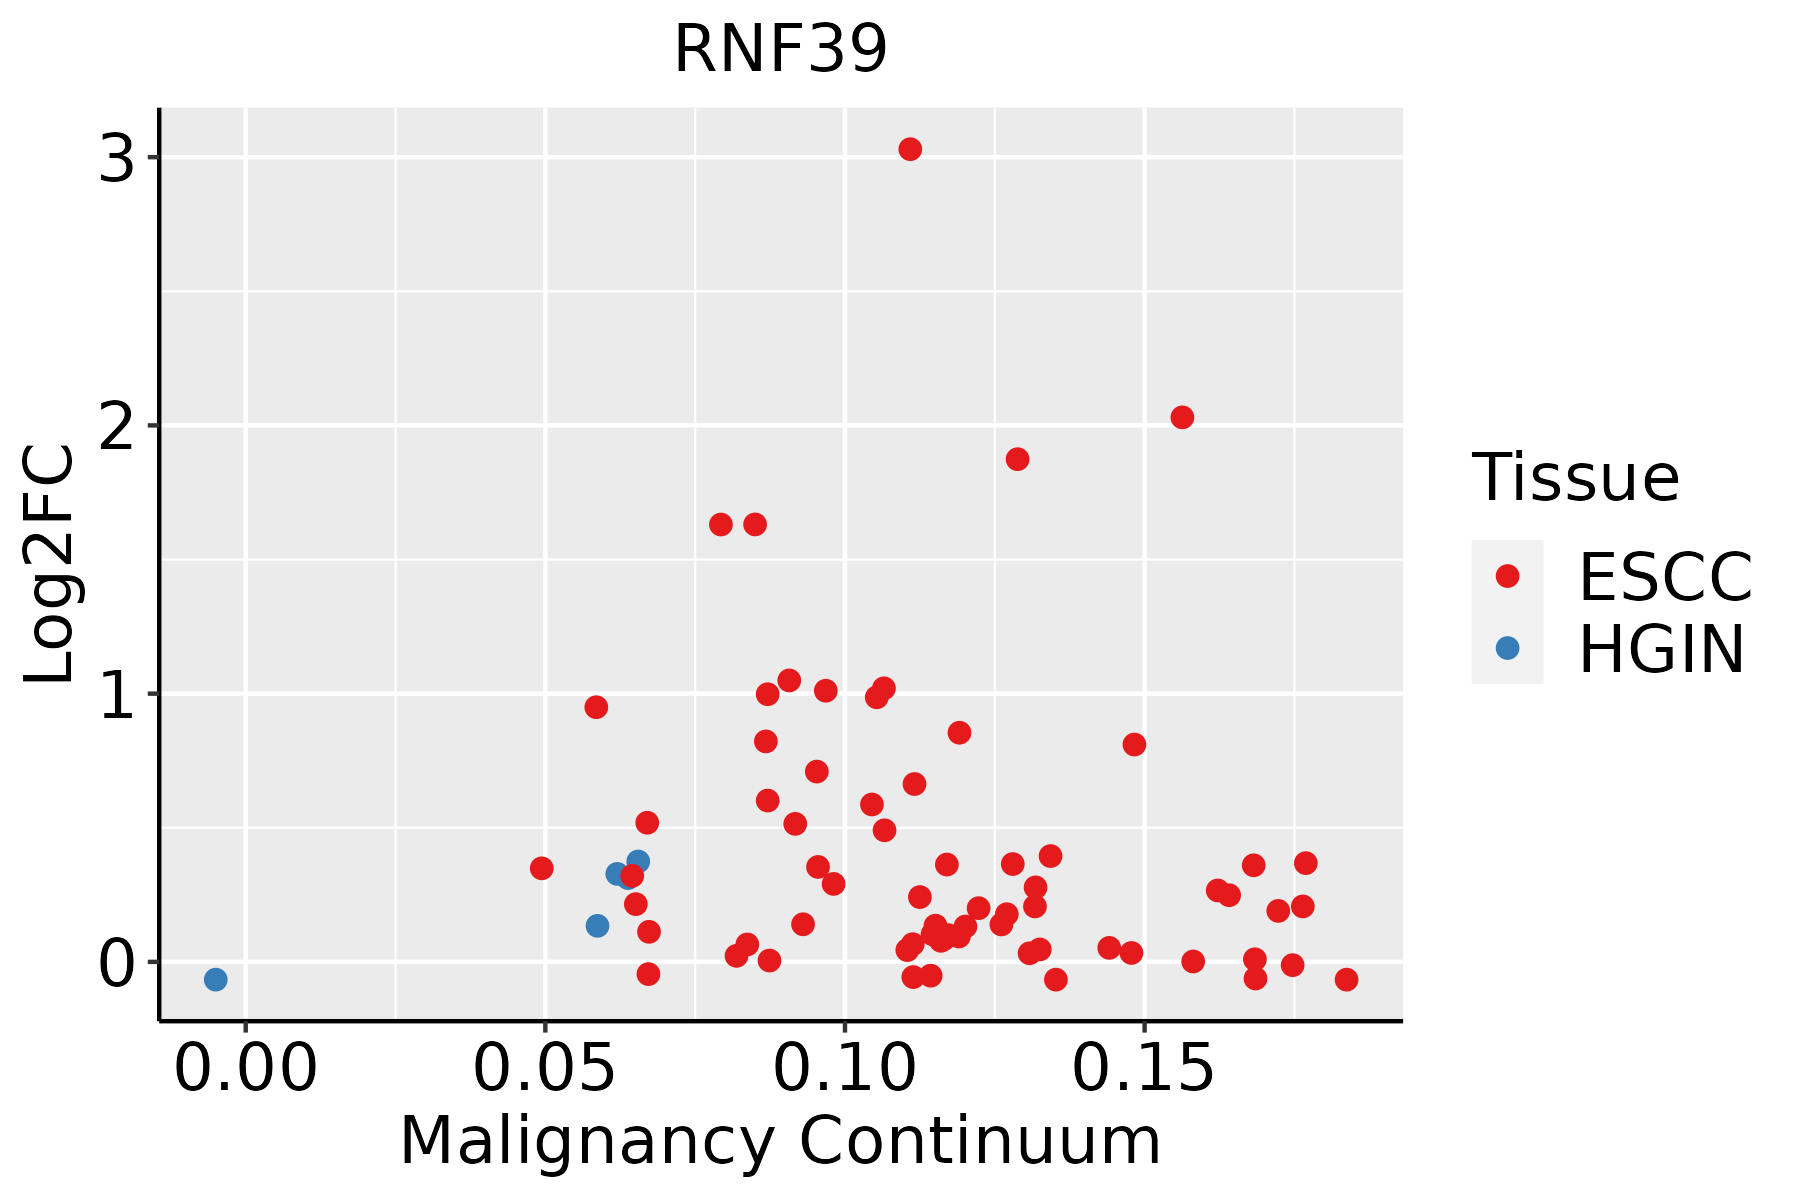 | ESCC: Esophageal squamous cell carcinoma |
| HGIN: High-grade intraepithelial neoplasias | ||
| LGIN: Low-grade intraepithelial neoplasias | ||
| Oral Cavity | 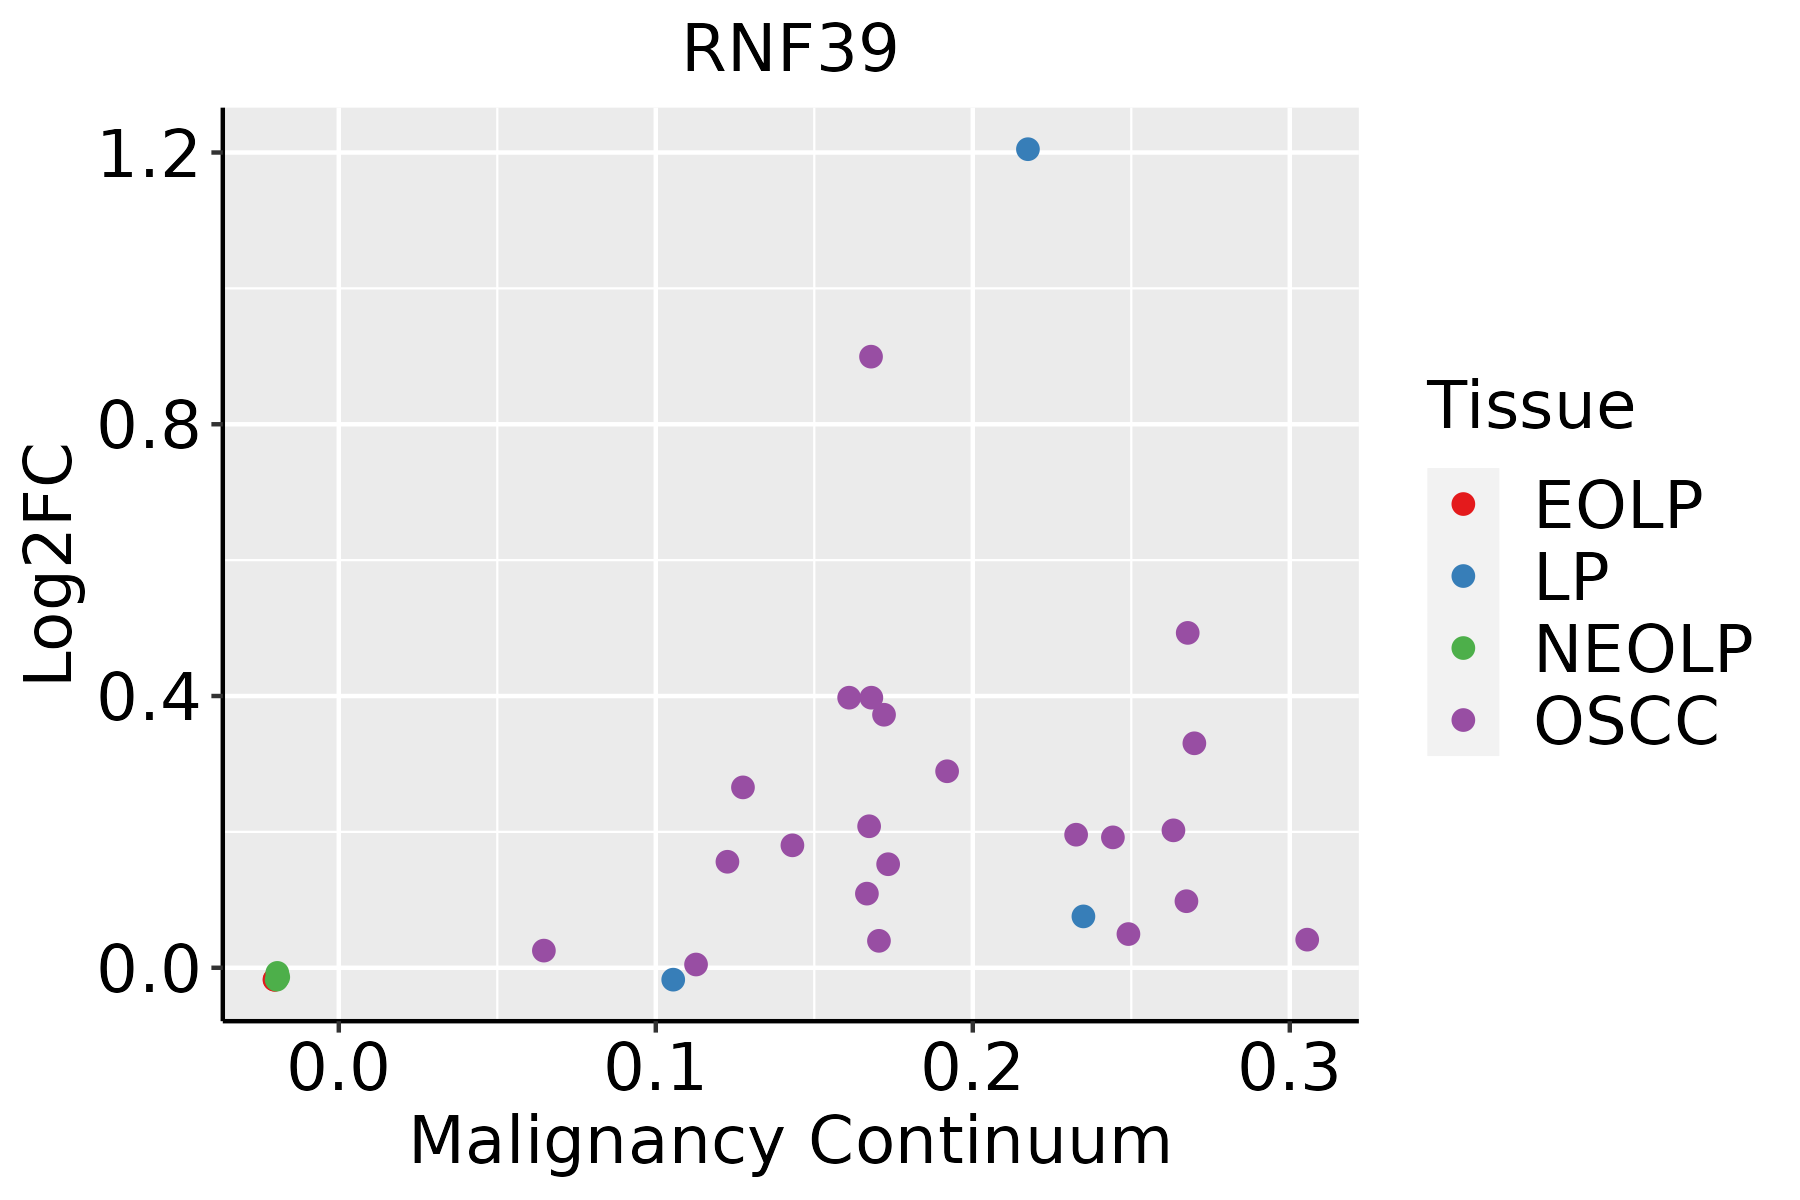 | EOLP: Erosive Oral lichen planus |
| LP: leukoplakia | ||
| NEOLP: Non-erosive oral lichen planus | ||
| OSCC: Oral squamous cell carcinoma |
| ∗log2FC in expression of this searched gene in stem-like cells from each diseased tissue sample relative to stem-like cells in normal samples in each tissue plotted against the malignancy continuum. Samples are colored based on if they are from different disease stage. |
Top |
Malignant transformation related pathway analysis |
| Find out the enriched GO biological processes and KEGG pathways involved in transition from healthy to precancer to cancer |
| Tissue | Disease Stage | Enriched GO biological Processes |
| Colorectum | AD |  |
| Colorectum | SER |  |
| Colorectum | MSS |  |
| Colorectum | MSI-H |  |
| Colorectum | FAP |  |
| ∗Top 15 enriched GO BP terms are showed in the bar plot of each disease state in each tissue. Each row represents a significant GO biological process which is colored according to the -log10(p.adjust). |
| Page: 1 2 3 4 5 6 7 8 9 |
| GO ID | Tissue | Disease Stage | Description | Gene Ratio | Bg Ratio | pvalue | p.adjust | Count |
| Page: 1 |
| Pathway ID | Tissue | Disease Stage | Description | Gene Ratio | Bg Ratio | pvalue | p.adjust | qvalue | Count |
| Page: 1 |
Top |
Cell-cell communication analysis |
| Identification of potential cell-cell interactions between two cell types and their ligand-receptor pairs for different disease states |
| Ligand | Receptor | LRpair | Pathway | Tissue | Disease Stage |
| Page: 1 |
Top |
Single-cell gene regulatory network inference analysis |
| Find out the significant the regulons (TFs) and the target genes of each regulon across cell types for different disease states |
| TF | Cell Type | Tissue | Disease Stage | Target Gene | RSS | Regulon Activity |
| ∗The dot plots of a searched regulon are shown for all cell subpopulations in each disease state of each tissue based on the regulon specific score inferred using pySCENIC and by calculating the average expression. |
| Page: 1 |
Top |
Somatic mutation of malignant transformation related genes |
| Annotation of somatic variants for genes involved in malignant transformation |
| Hugo Symbol | Variant Class | Variant Classification | dbSNP RS | HGVSc | HGVSp | HGVSp Short | SWISSPROT | BIOTYPE | SIFT | PolyPhen | Tumor Sample Barcode | Tissue | Histology | Sex | Age | Stage | Therapy Types | Drugs | Outcome |
| RNF39 | deletion | Frame_Shift_Del | rs751277893 | c.1186delC | p.Leu396TrpfsTer74 | p.L396Wfs*74 | Q9H2S5 | protein_coding | TCGA-AC-A2BK-01 | Breast | breast invasive carcinoma | Female | >=65 | III/IV | Chemotherapy | cytoxan | CR | ||
| RNF39 | SNV | Missense_Mutation | c.143C>G | p.Ser48Cys | p.S48C | Q9H2S5 | protein_coding | deleterious_low_confidence(0.01) | benign(0.173) | TCGA-C5-A1M6-01 | Cervix | cervical & endocervical cancer | Female | <65 | I/II | Chemotherapy | cisplatin | PD | |
| RNF39 | SNV | Missense_Mutation | rs142632327 | c.1195N>T | p.Arg399Cys | p.R399C | Q9H2S5 | protein_coding | deleterious(0.01) | possibly_damaging(0.588) | TCGA-A6-3809-01 | Colorectum | colon adenocarcinoma | Female | >=65 | I/II | Unknown | Unknown | SD |
| RNF39 | SNV | Missense_Mutation | rs142632327 | c.1195C>T | p.Arg399Cys | p.R399C | Q9H2S5 | protein_coding | deleterious(0.01) | possibly_damaging(0.588) | TCGA-AZ-6601-01 | Colorectum | colon adenocarcinoma | Male | >=65 | I/II | Unknown | Unknown | PD |
| RNF39 | SNV | Missense_Mutation | c.661N>C | p.Lys221Gln | p.K221Q | Q9H2S5 | protein_coding | tolerated(0.08) | benign(0.317) | TCGA-CA-6718-01 | Colorectum | colon adenocarcinoma | Male | <65 | I/II | Unknown | Unknown | PD | |
| RNF39 | SNV | Missense_Mutation | c.1091N>A | p.Arg364His | p.R364H | Q9H2S5 | protein_coding | deleterious(0.01) | probably_damaging(0.99) | TCGA-G4-6320-01 | Colorectum | colon adenocarcinoma | Male | >=65 | III/IV | Chemotherapy | oxaliplatin | SD | |
| RNF39 | SNV | Missense_Mutation | c.827C>T | p.Ala276Val | p.A276V | Q9H2S5 | protein_coding | tolerated(0.07) | possibly_damaging(0.853) | TCGA-NH-A5IV-01 | Colorectum | colon adenocarcinoma | Female | >=65 | I/II | Unknown | Unknown | SD | |
| RNF39 | SNV | Missense_Mutation | novel | c.838N>A | p.Gly280Arg | p.G280R | Q9H2S5 | protein_coding | tolerated(0.62) | benign(0.003) | TCGA-SS-A7HO-01 | Colorectum | colon adenocarcinoma | Female | <65 | I/II | Chemotherapy | oxaliplatin | PD |
| RNF39 | SNV | Missense_Mutation | c.1019N>A | p.Arg340His | p.R340H | Q9H2S5 | protein_coding | tolerated(0.53) | probably_damaging(0.953) | TCGA-WS-AB45-01 | Colorectum | colon adenocarcinoma | Female | <65 | I/II | Unknown | Unknown | SD | |
| RNF39 | SNV | Missense_Mutation | rs754295949 | c.118N>A | p.Ala40Thr | p.A40T | Q9H2S5 | protein_coding | deleterious_low_confidence(0.05) | benign(0.001) | TCGA-WS-AB45-01 | Colorectum | colon adenocarcinoma | Female | <65 | I/II | Unknown | Unknown | SD |
| Page: 1 2 3 4 |
Top |
Related drugs of malignant transformation related genes |
| Identification of chemicals and drugs interact with genes involved in malignant transfromation |
| (DGIdb 4.0) |
| Entrez ID | Symbol | Category | Interaction Types | Drug Claim Name | Drug Name | PMIDs |
| Page: 1 |

Copyright 2023-Present -The University of Texas Health Science Center at Houston |