
|
|||||
|
 | |
| |
| |
| |
| |
| |
|
Gene: RNF38 |
Gene summary for RNF38 |
| Gene information | Species | Human | Gene symbol | RNF38 | Gene ID | 152006 |
| Gene name | ring finger protein 38 | |
| Gene Alias | RNF38 | |
| Cytomap | 9p13.2 | |
| Gene Type | protein-coding | GO ID | GO:0000003 | UniProtAcc | Q9H0F5 |
Top |
Malignant transformation analysis |
| Identification of the aberrant gene expression in precancerous and cancerous lesions by comparing the gene expression of stem-like cells in diseased tissues with normal stem cells |
| Entrez ID | Symbol | Replicates | Species | Organ | Tissue | Adj P-value | Log2FC | Malignancy |
| 152006 | RNF38 | CCI_1 | Human | Cervix | CC | 8.17e-05 | 7.96e-01 | 0.528 |
| 152006 | RNF38 | CCI_2 | Human | Cervix | CC | 1.74e-10 | 1.09e+00 | 0.5249 |
| 152006 | RNF38 | CCI_3 | Human | Cervix | CC | 4.09e-12 | 8.65e-01 | 0.516 |
| 152006 | RNF38 | HTA11_3410_2000001011 | Human | Colorectum | AD | 7.09e-18 | -5.83e-01 | 0.0155 |
| 152006 | RNF38 | HTA11_83_2000001011 | Human | Colorectum | SER | 6.88e-03 | -1.88e-01 | -0.1526 |
| 152006 | RNF38 | HTA11_866_3004761011 | Human | Colorectum | AD | 2.26e-03 | -4.16e-01 | 0.096 |
| 152006 | RNF38 | HTA11_8622_2000001021 | Human | Colorectum | SER | 3.84e-03 | -5.47e-01 | 0.0528 |
| 152006 | RNF38 | HTA11_7696_3000711011 | Human | Colorectum | AD | 3.30e-08 | -4.31e-01 | 0.0674 |
| 152006 | RNF38 | HTA11_99999970781_79442 | Human | Colorectum | MSS | 1.83e-06 | -3.54e-01 | 0.294 |
| 152006 | RNF38 | HTA11_99999965062_69753 | Human | Colorectum | MSI-H | 1.23e-03 | 7.39e-01 | 0.3487 |
| 152006 | RNF38 | HTA11_99999971662_82457 | Human | Colorectum | MSS | 6.63e-06 | -2.94e-01 | 0.3859 |
| 152006 | RNF38 | HTA11_99999973899_84307 | Human | Colorectum | MSS | 6.31e-05 | -5.46e-01 | 0.2585 |
| 152006 | RNF38 | HTA11_99999974143_84620 | Human | Colorectum | MSS | 2.01e-17 | -4.81e-01 | 0.3005 |
| 152006 | RNF38 | A002-C-010 | Human | Colorectum | FAP | 7.39e-05 | -2.07e-01 | 0.242 |
| 152006 | RNF38 | A001-C-207 | Human | Colorectum | FAP | 3.31e-03 | -2.91e-01 | 0.1278 |
| 152006 | RNF38 | A015-C-203 | Human | Colorectum | FAP | 1.48e-36 | -5.09e-01 | -0.1294 |
| 152006 | RNF38 | A015-C-204 | Human | Colorectum | FAP | 4.62e-07 | -3.25e-01 | -0.0228 |
| 152006 | RNF38 | A014-C-040 | Human | Colorectum | FAP | 2.13e-04 | -3.84e-01 | -0.1184 |
| 152006 | RNF38 | A002-C-201 | Human | Colorectum | FAP | 9.49e-18 | -5.11e-01 | 0.0324 |
| 152006 | RNF38 | A002-C-203 | Human | Colorectum | FAP | 2.79e-09 | -2.86e-01 | 0.2786 |
| Page: 1 2 3 4 5 6 |
| Tissue | Expression Dynamics | Abbreviation |
| Cervix |  | CC: Cervix cancer |
| HSIL_HPV: HPV-infected high-grade squamous intraepithelial lesions | ||
| N_HPV: HPV-infected normal cervix | ||
| Colorectum (GSE201348) |  | FAP: Familial adenomatous polyposis |
| CRC: Colorectal cancer | ||
| Colorectum (HTA11) |  | AD: Adenomas |
| SER: Sessile serrated lesions | ||
| MSI-H: Microsatellite-high colorectal cancer | ||
| MSS: Microsatellite stable colorectal cancer | ||
| Esophagus | 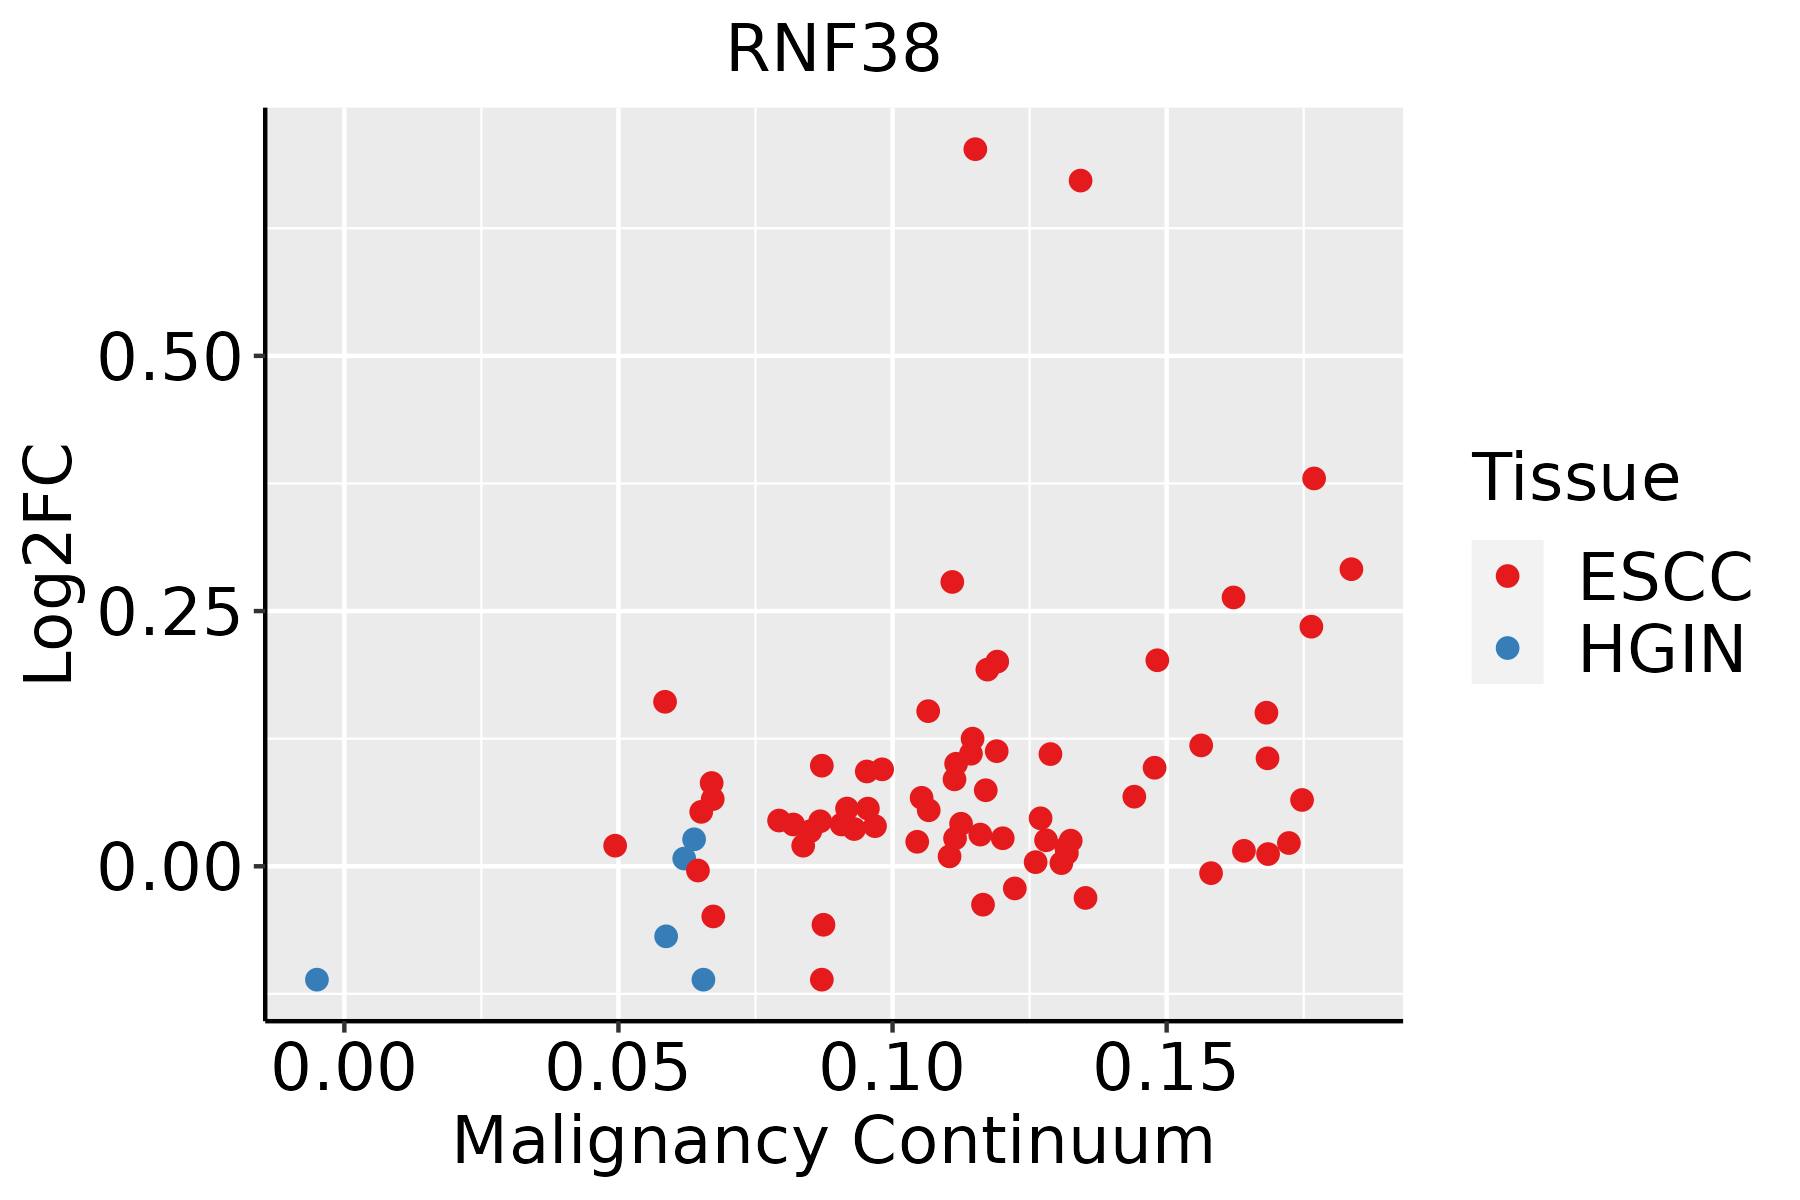 | ESCC: Esophageal squamous cell carcinoma |
| HGIN: High-grade intraepithelial neoplasias | ||
| LGIN: Low-grade intraepithelial neoplasias | ||
| Prostate |  | BPH: Benign Prostatic Hyperplasia |
| ∗log2FC in expression of this searched gene in stem-like cells from each diseased tissue sample relative to stem-like cells in normal samples in each tissue plotted against the malignancy continuum. Samples are colored based on if they are from different disease stage. |
Top |
Malignant transformation related pathway analysis |
| Find out the enriched GO biological processes and KEGG pathways involved in transition from healthy to precancer to cancer |
| Tissue | Disease Stage | Enriched GO biological Processes |
| Colorectum | AD |  |
| Colorectum | SER |  |
| Colorectum | MSS |  |
| Colorectum | MSI-H |  |
| Colorectum | FAP |  |
| ∗Top 15 enriched GO BP terms are showed in the bar plot of each disease state in each tissue. Each row represents a significant GO biological process which is colored according to the -log10(p.adjust). |
| Page: 1 2 3 4 5 6 7 8 9 |
| GO ID | Tissue | Disease Stage | Description | Gene Ratio | Bg Ratio | pvalue | p.adjust | Count |
| GO:00614588 | Cervix | CC | reproductive system development | 87/2311 | 427/18723 | 1.37e-06 | 4.55e-05 | 87 |
| GO:00486088 | Cervix | CC | reproductive structure development | 86/2311 | 424/18723 | 1.90e-06 | 5.97e-05 | 86 |
| GO:0061458 | Colorectum | AD | reproductive system development | 116/3918 | 427/18723 | 1.11e-03 | 1.01e-02 | 116 |
| GO:0048608 | Colorectum | AD | reproductive structure development | 114/3918 | 424/18723 | 1.78e-03 | 1.47e-02 | 114 |
| GO:00614581 | Colorectum | SER | reproductive system development | 87/2897 | 427/18723 | 3.69e-03 | 3.07e-02 | 87 |
| GO:00486081 | Colorectum | SER | reproductive structure development | 85/2897 | 424/18723 | 6.33e-03 | 4.56e-02 | 85 |
| GO:00614582 | Colorectum | MSS | reproductive system development | 115/3467 | 427/18723 | 9.86e-06 | 2.39e-04 | 115 |
| GO:00486082 | Colorectum | MSS | reproductive structure development | 113/3467 | 424/18723 | 1.94e-05 | 4.18e-04 | 113 |
| GO:00614583 | Colorectum | FAP | reproductive system development | 85/2622 | 427/18723 | 4.30e-04 | 5.13e-03 | 85 |
| GO:00486083 | Colorectum | FAP | reproductive structure development | 84/2622 | 424/18723 | 5.40e-04 | 6.10e-03 | 84 |
| GO:00614584 | Colorectum | CRC | reproductive system development | 73/2078 | 427/18723 | 1.13e-04 | 2.22e-03 | 73 |
| GO:00486084 | Colorectum | CRC | reproductive structure development | 72/2078 | 424/18723 | 1.55e-04 | 2.80e-03 | 72 |
| GO:0061458110 | Esophagus | ESCC | reproductive system development | 247/8552 | 427/18723 | 2.24e-07 | 3.42e-06 | 247 |
| GO:004860818 | Esophagus | ESCC | reproductive structure development | 245/8552 | 424/18723 | 2.82e-07 | 4.14e-06 | 245 |
| GO:006145810 | Prostate | BPH | reproductive system development | 126/3107 | 427/18723 | 1.35e-11 | 9.95e-10 | 126 |
| GO:004860810 | Prostate | BPH | reproductive structure development | 124/3107 | 424/18723 | 3.76e-11 | 2.43e-09 | 124 |
| GO:00085844 | Prostate | BPH | male gonad development | 42/3107 | 141/18723 | 6.69e-05 | 6.62e-04 | 42 |
| GO:00465464 | Prostate | BPH | development of primary male sexual characteristics | 42/3107 | 142/18723 | 8.00e-05 | 7.66e-04 | 42 |
| GO:00466614 | Prostate | BPH | male sex differentiation | 47/3107 | 165/18723 | 8.70e-05 | 8.22e-04 | 47 |
| GO:00084063 | Prostate | BPH | gonad development | 58/3107 | 221/18723 | 1.73e-04 | 1.48e-03 | 58 |
| Page: 1 2 |
| Pathway ID | Tissue | Disease Stage | Description | Gene Ratio | Bg Ratio | pvalue | p.adjust | qvalue | Count |
| Page: 1 |
Top |
Cell-cell communication analysis |
| Identification of potential cell-cell interactions between two cell types and their ligand-receptor pairs for different disease states |
| Ligand | Receptor | LRpair | Pathway | Tissue | Disease Stage |
| Page: 1 |
Top |
Single-cell gene regulatory network inference analysis |
| Find out the significant the regulons (TFs) and the target genes of each regulon across cell types for different disease states |
| TF | Cell Type | Tissue | Disease Stage | Target Gene | RSS | Regulon Activity |
| ∗The dot plots of a searched regulon are shown for all cell subpopulations in each disease state of each tissue based on the regulon specific score inferred using pySCENIC and by calculating the average expression. |
| Page: 1 |
Top |
Somatic mutation of malignant transformation related genes |
| Annotation of somatic variants for genes involved in malignant transformation |
| Hugo Symbol | Variant Class | Variant Classification | dbSNP RS | HGVSc | HGVSp | HGVSp Short | SWISSPROT | BIOTYPE | SIFT | PolyPhen | Tumor Sample Barcode | Tissue | Histology | Sex | Age | Stage | Therapy Types | Drugs | Outcome |
| RNF38 | SNV | Missense_Mutation | c.434A>G | p.His145Arg | p.H145R | Q9H0F5 | protein_coding | tolerated(0.8) | benign(0) | TCGA-B6-A0RT-01 | Breast | breast invasive carcinoma | Female | <65 | III/IV | Unknown | Unknown | SD | |
| RNF38 | deletion | Frame_Shift_Del | novel | c.748delN | p.Ala250HisfsTer59 | p.A250Hfs*59 | Q9H0F5 | protein_coding | TCGA-D8-A27V-01 | Breast | breast invasive carcinoma | Female | <65 | I/II | Hormone Therapy | tamoxiphen | SD | ||
| RNF38 | SNV | Missense_Mutation | novel | c.1387N>C | p.Cys463Arg | p.C463R | Q9H0F5 | protein_coding | deleterious(0) | probably_damaging(1) | TCGA-2W-A8YY-01 | Cervix | cervical & endocervical cancer | Female | <65 | I/II | Chemotherapy | cisplatin | CR |
| RNF38 | SNV | Missense_Mutation | novel | c.1019N>T | p.Pro340Leu | p.P340L | Q9H0F5 | protein_coding | deleterious(0) | probably_damaging(0.953) | TCGA-2W-A8YY-01 | Cervix | cervical & endocervical cancer | Female | <65 | I/II | Chemotherapy | cisplatin | CR |
| RNF38 | SNV | Missense_Mutation | novel | c.70G>C | p.Glu24Gln | p.E24Q | Q9H0F5 | protein_coding | deleterious_low_confidence(0) | possibly_damaging(0.727) | TCGA-ZJ-AAXA-01 | Cervix | cervical & endocervical cancer | Female | <65 | I/II | Unknown | Unknown | SD |
| RNF38 | SNV | Missense_Mutation | c.574C>A | p.His192Asn | p.H192N | Q9H0F5 | protein_coding | deleterious_low_confidence(0) | benign(0.276) | TCGA-AA-A010-01 | Colorectum | colon adenocarcinoma | Female | <65 | I/II | Chemotherapy | folinic | CR | |
| RNF38 | SNV | Missense_Mutation | novel | c.252N>A | p.Met84Ile | p.M84I | Q9H0F5 | protein_coding | tolerated(0.39) | benign(0.01) | TCGA-A5-A0G2-01 | Endometrium | uterine corpus endometrioid carcinoma | Female | <65 | III/IV | Unknown | Unknown | SD |
| RNF38 | SNV | Missense_Mutation | novel | c.1195N>T | p.Pro399Ser | p.P399S | Q9H0F5 | protein_coding | tolerated(0.13) | probably_damaging(0.999) | TCGA-AJ-A3EK-01 | Endometrium | uterine corpus endometrioid carcinoma | Female | <65 | I/II | Chemotherapy | carboplatin | CR |
| RNF38 | SNV | Missense_Mutation | c.257N>T | p.Pro86Leu | p.P86L | Q9H0F5 | protein_coding | deleterious(0) | probably_damaging(0.999) | TCGA-AP-A059-01 | Endometrium | uterine corpus endometrioid carcinoma | Female | >=65 | I/II | Unknown | Unknown | SD | |
| RNF38 | SNV | Missense_Mutation | c.1324N>T | p.Asp442Tyr | p.D442Y | Q9H0F5 | protein_coding | deleterious(0) | possibly_damaging(0.885) | TCGA-AP-A0LM-01 | Endometrium | uterine corpus endometrioid carcinoma | Female | <65 | III/IV | Chemotherapy | cisplatin | SD |
| Page: 1 2 3 4 5 6 |
Top |
Related drugs of malignant transformation related genes |
| Identification of chemicals and drugs interact with genes involved in malignant transfromation |
| (DGIdb 4.0) |
| Entrez ID | Symbol | Category | Interaction Types | Drug Claim Name | Drug Name | PMIDs |
| Page: 1 |

Copyright 2023-Present -The University of Texas Health Science Center at Houston |