
|
|||||
|
 | |
| |
| |
| |
| |
| |
|
Gene: RNF34 |
Gene summary for RNF34 |
| Gene information | Species | Human | Gene symbol | RNF34 | Gene ID | 80196 |
| Gene name | ring finger protein 34 | |
| Gene Alias | CARP-1 | |
| Cytomap | 12q24.31 | |
| Gene Type | protein-coding | GO ID | GO:0000209 | UniProtAcc | A0A087WTM5 |
Top |
Malignant transformation analysis |
| Identification of the aberrant gene expression in precancerous and cancerous lesions by comparing the gene expression of stem-like cells in diseased tissues with normal stem cells |
| Entrez ID | Symbol | Replicates | Species | Organ | Tissue | Adj P-value | Log2FC | Malignancy |
| 80196 | RNF34 | LZE4T | Human | Esophagus | ESCC | 1.27e-03 | 1.77e-01 | 0.0811 |
| 80196 | RNF34 | LZE8T | Human | Esophagus | ESCC | 4.29e-05 | 1.99e-01 | 0.067 |
| 80196 | RNF34 | LZE24T | Human | Esophagus | ESCC | 1.03e-15 | 4.51e-01 | 0.0596 |
| 80196 | RNF34 | LZE6T | Human | Esophagus | ESCC | 1.36e-05 | 1.80e-01 | 0.0845 |
| 80196 | RNF34 | P1T-E | Human | Esophagus | ESCC | 6.29e-06 | 4.08e-01 | 0.0875 |
| 80196 | RNF34 | P2T-E | Human | Esophagus | ESCC | 2.90e-37 | 6.06e-01 | 0.1177 |
| 80196 | RNF34 | P4T-E | Human | Esophagus | ESCC | 1.79e-23 | 5.25e-01 | 0.1323 |
| 80196 | RNF34 | P5T-E | Human | Esophagus | ESCC | 8.60e-14 | 2.82e-01 | 0.1327 |
| 80196 | RNF34 | P8T-E | Human | Esophagus | ESCC | 1.48e-19 | 3.14e-01 | 0.0889 |
| 80196 | RNF34 | P9T-E | Human | Esophagus | ESCC | 5.85e-07 | 1.85e-01 | 0.1131 |
| 80196 | RNF34 | P10T-E | Human | Esophagus | ESCC | 3.24e-23 | 3.72e-01 | 0.116 |
| 80196 | RNF34 | P11T-E | Human | Esophagus | ESCC | 3.95e-15 | 4.95e-01 | 0.1426 |
| 80196 | RNF34 | P12T-E | Human | Esophagus | ESCC | 2.01e-20 | 3.19e-01 | 0.1122 |
| 80196 | RNF34 | P15T-E | Human | Esophagus | ESCC | 3.90e-16 | 3.84e-01 | 0.1149 |
| 80196 | RNF34 | P16T-E | Human | Esophagus | ESCC | 4.19e-18 | 2.96e-01 | 0.1153 |
| 80196 | RNF34 | P17T-E | Human | Esophagus | ESCC | 1.75e-03 | 3.03e-01 | 0.1278 |
| 80196 | RNF34 | P20T-E | Human | Esophagus | ESCC | 3.83e-18 | 3.77e-01 | 0.1124 |
| 80196 | RNF34 | P21T-E | Human | Esophagus | ESCC | 4.45e-24 | 4.40e-01 | 0.1617 |
| 80196 | RNF34 | P22T-E | Human | Esophagus | ESCC | 1.98e-14 | 2.40e-01 | 0.1236 |
| 80196 | RNF34 | P23T-E | Human | Esophagus | ESCC | 1.43e-21 | 4.99e-01 | 0.108 |
| Page: 1 2 3 4 5 |
| Tissue | Expression Dynamics | Abbreviation |
| Esophagus | 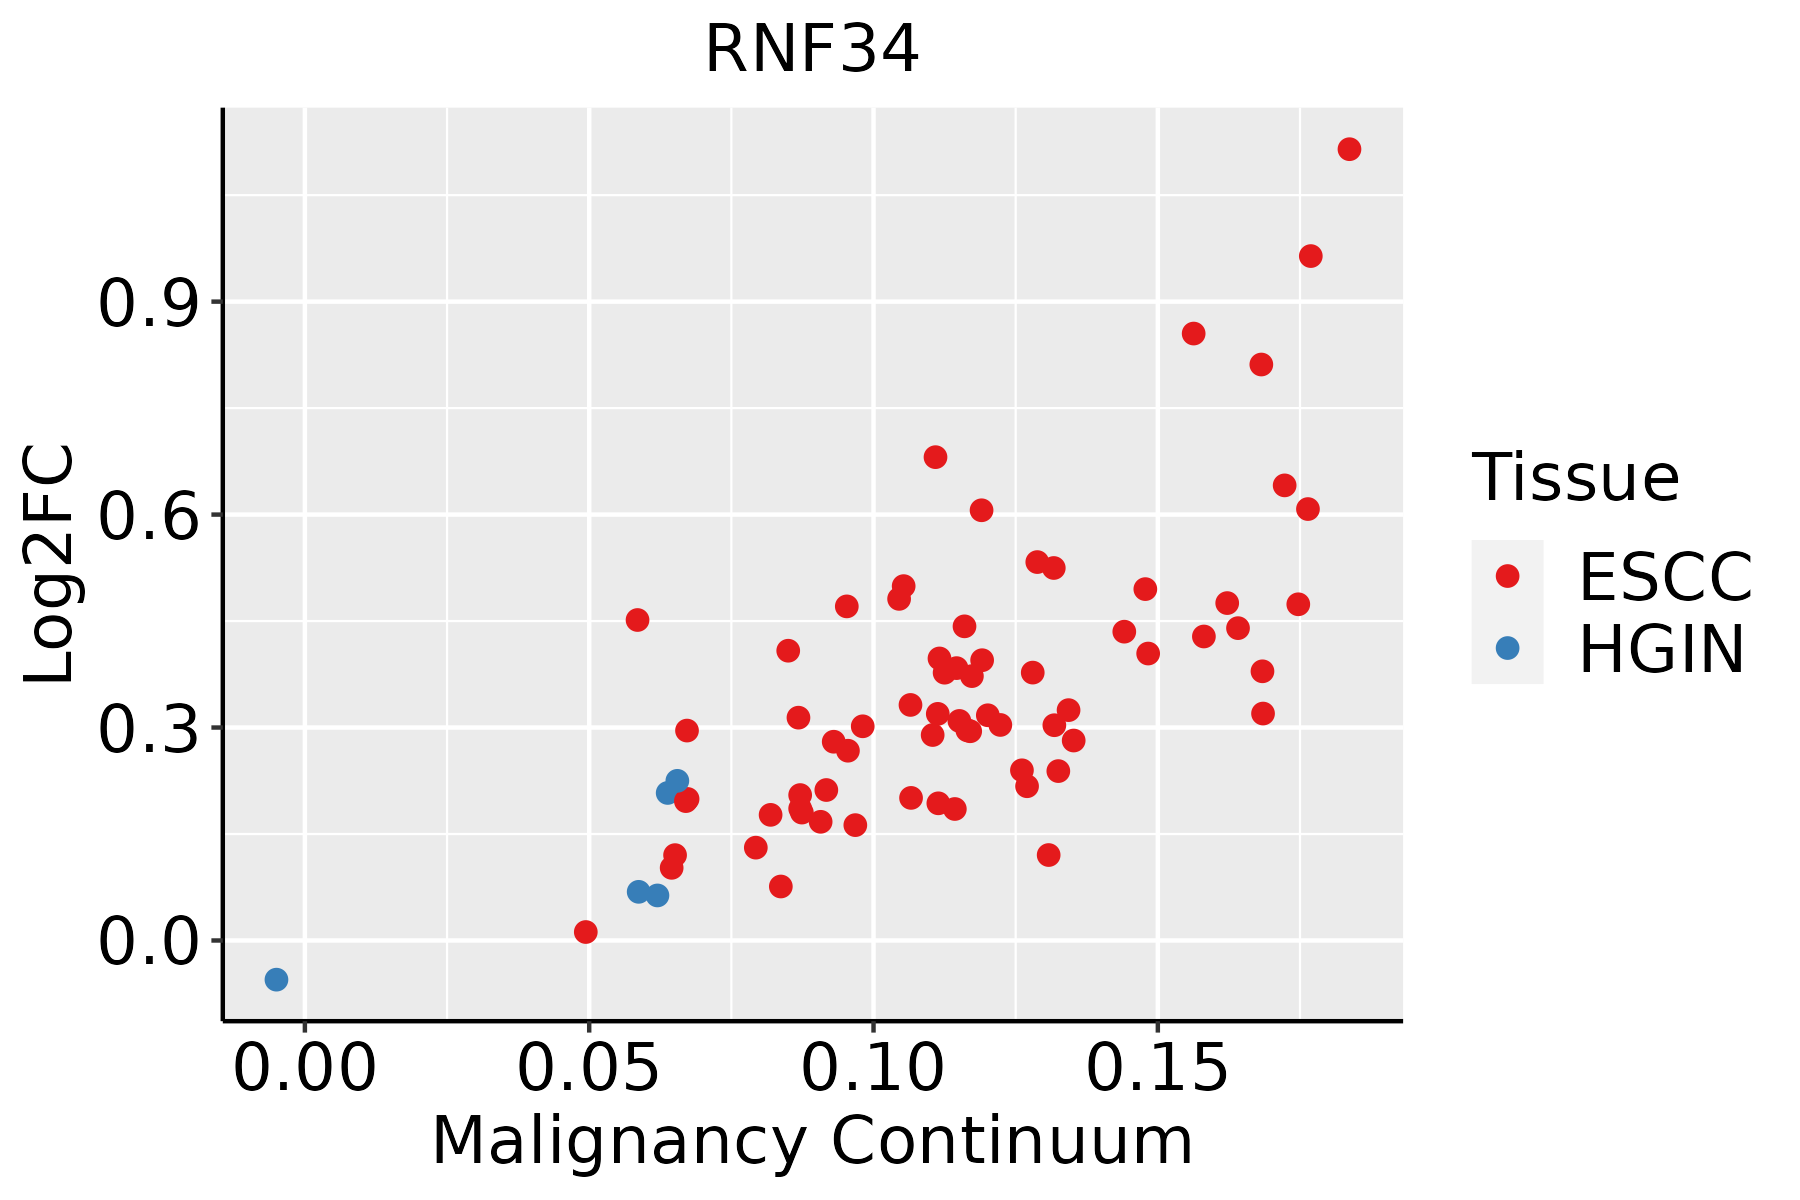 | ESCC: Esophageal squamous cell carcinoma |
| HGIN: High-grade intraepithelial neoplasias | ||
| LGIN: Low-grade intraepithelial neoplasias | ||
| Liver | 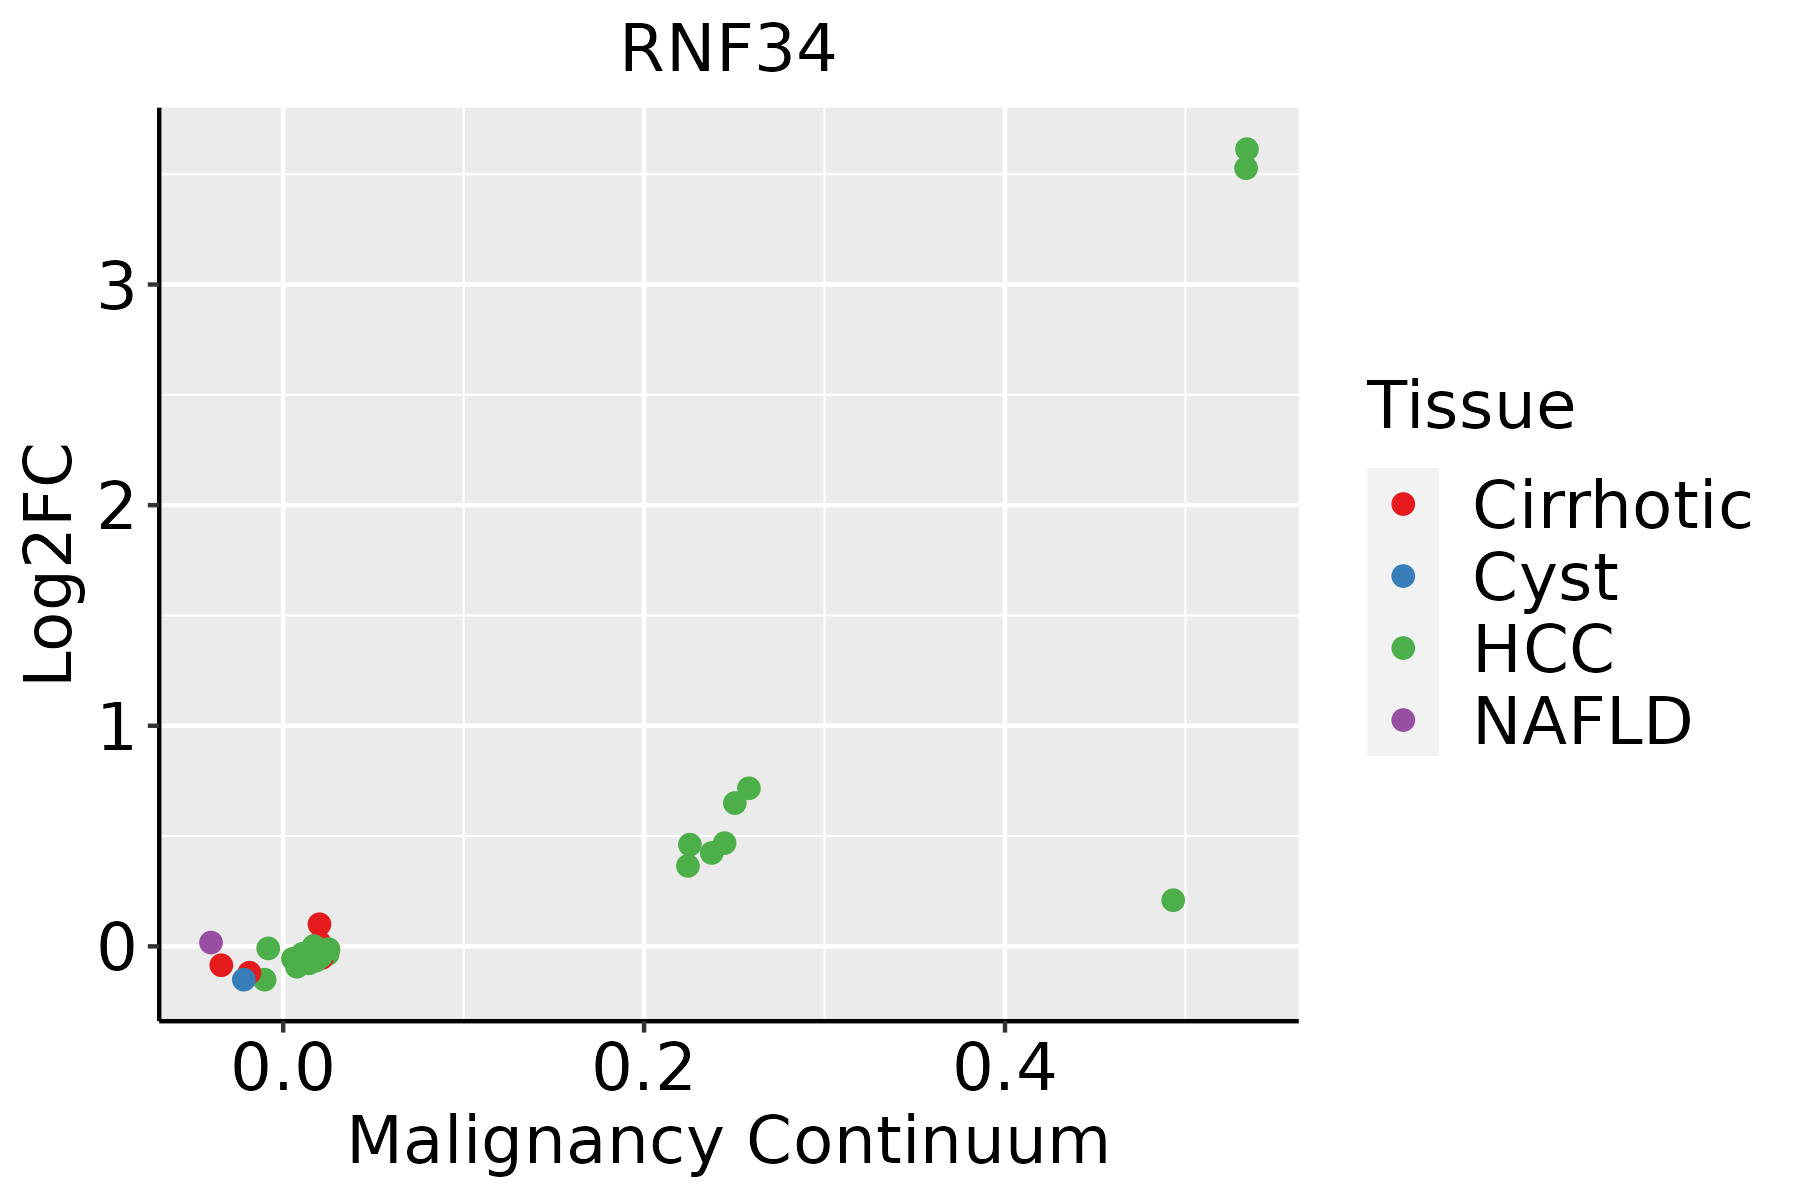 | HCC: Hepatocellular carcinoma |
| NAFLD: Non-alcoholic fatty liver disease | ||
| Oral Cavity | 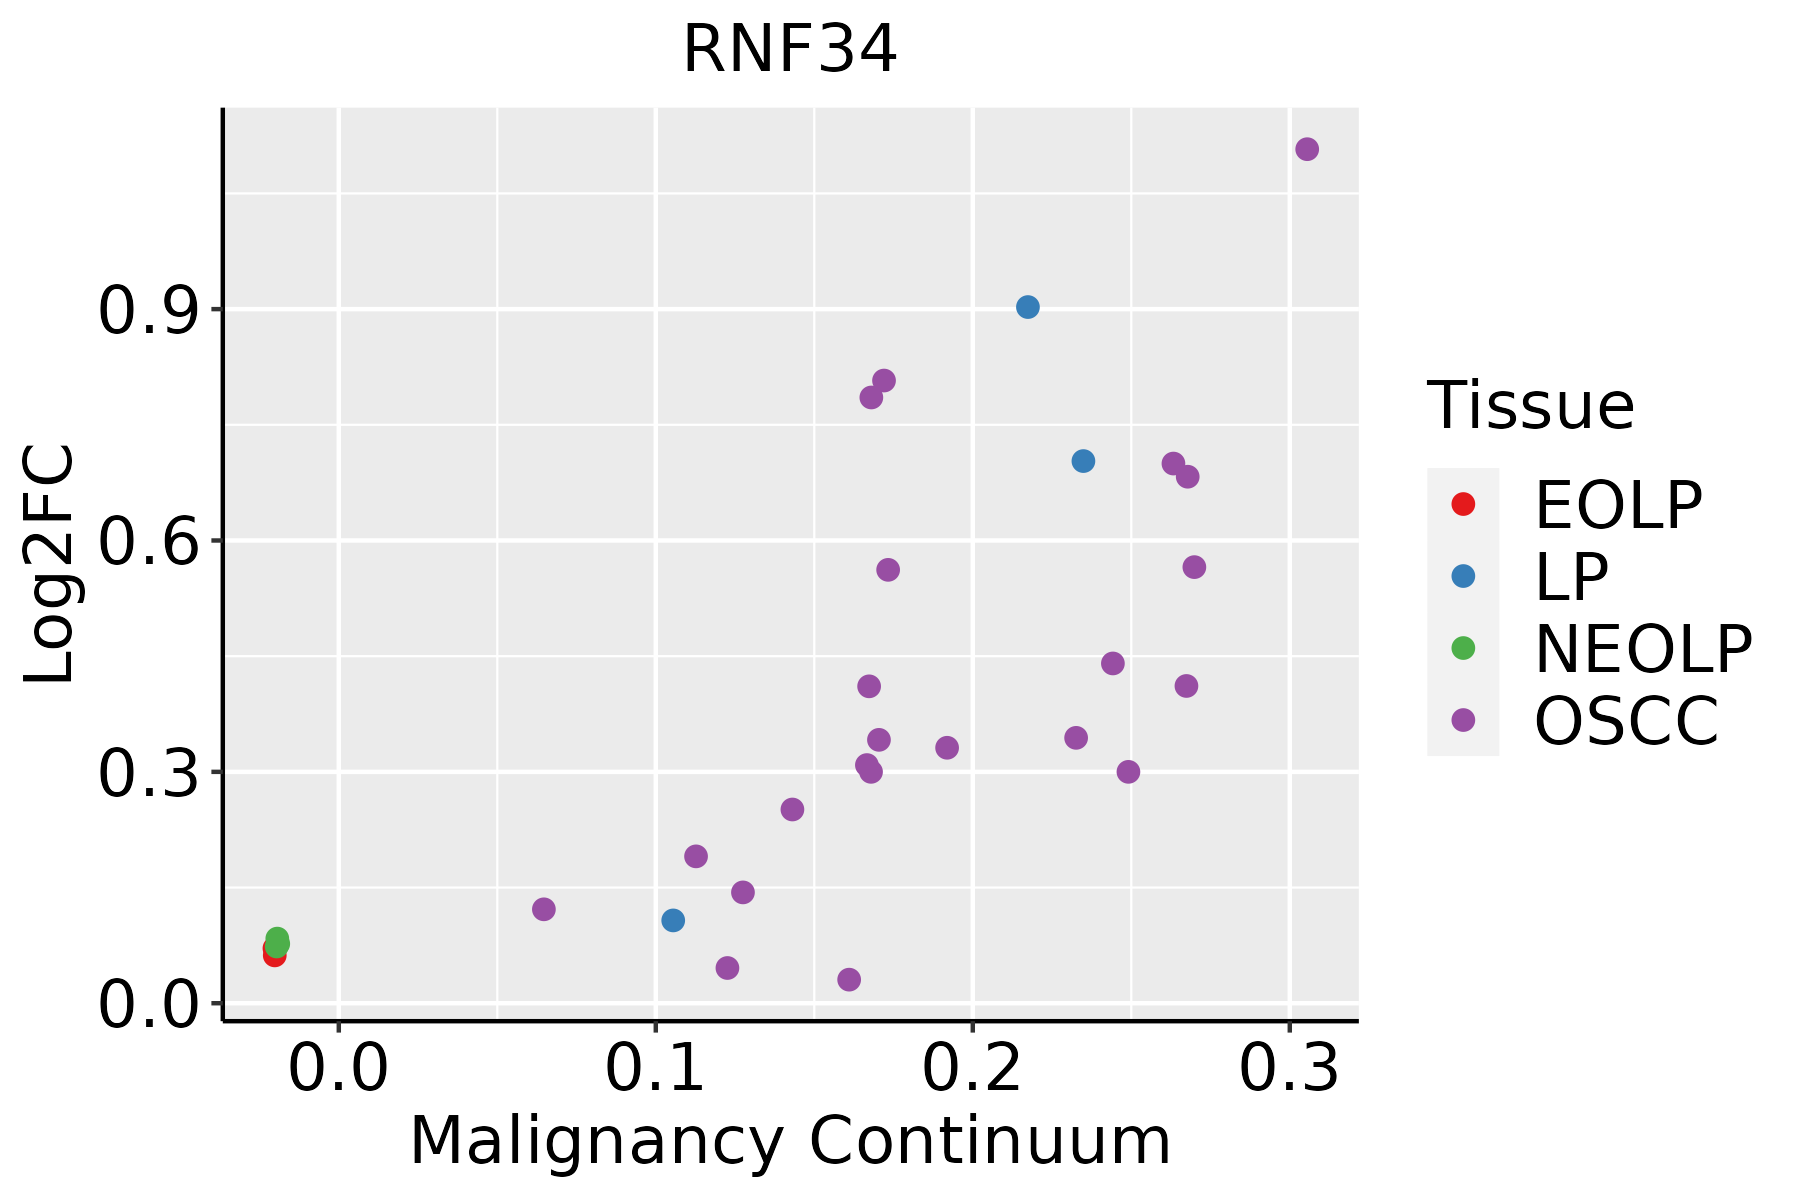 | EOLP: Erosive Oral lichen planus |
| LP: leukoplakia | ||
| NEOLP: Non-erosive oral lichen planus | ||
| OSCC: Oral squamous cell carcinoma | ||
| Skin | 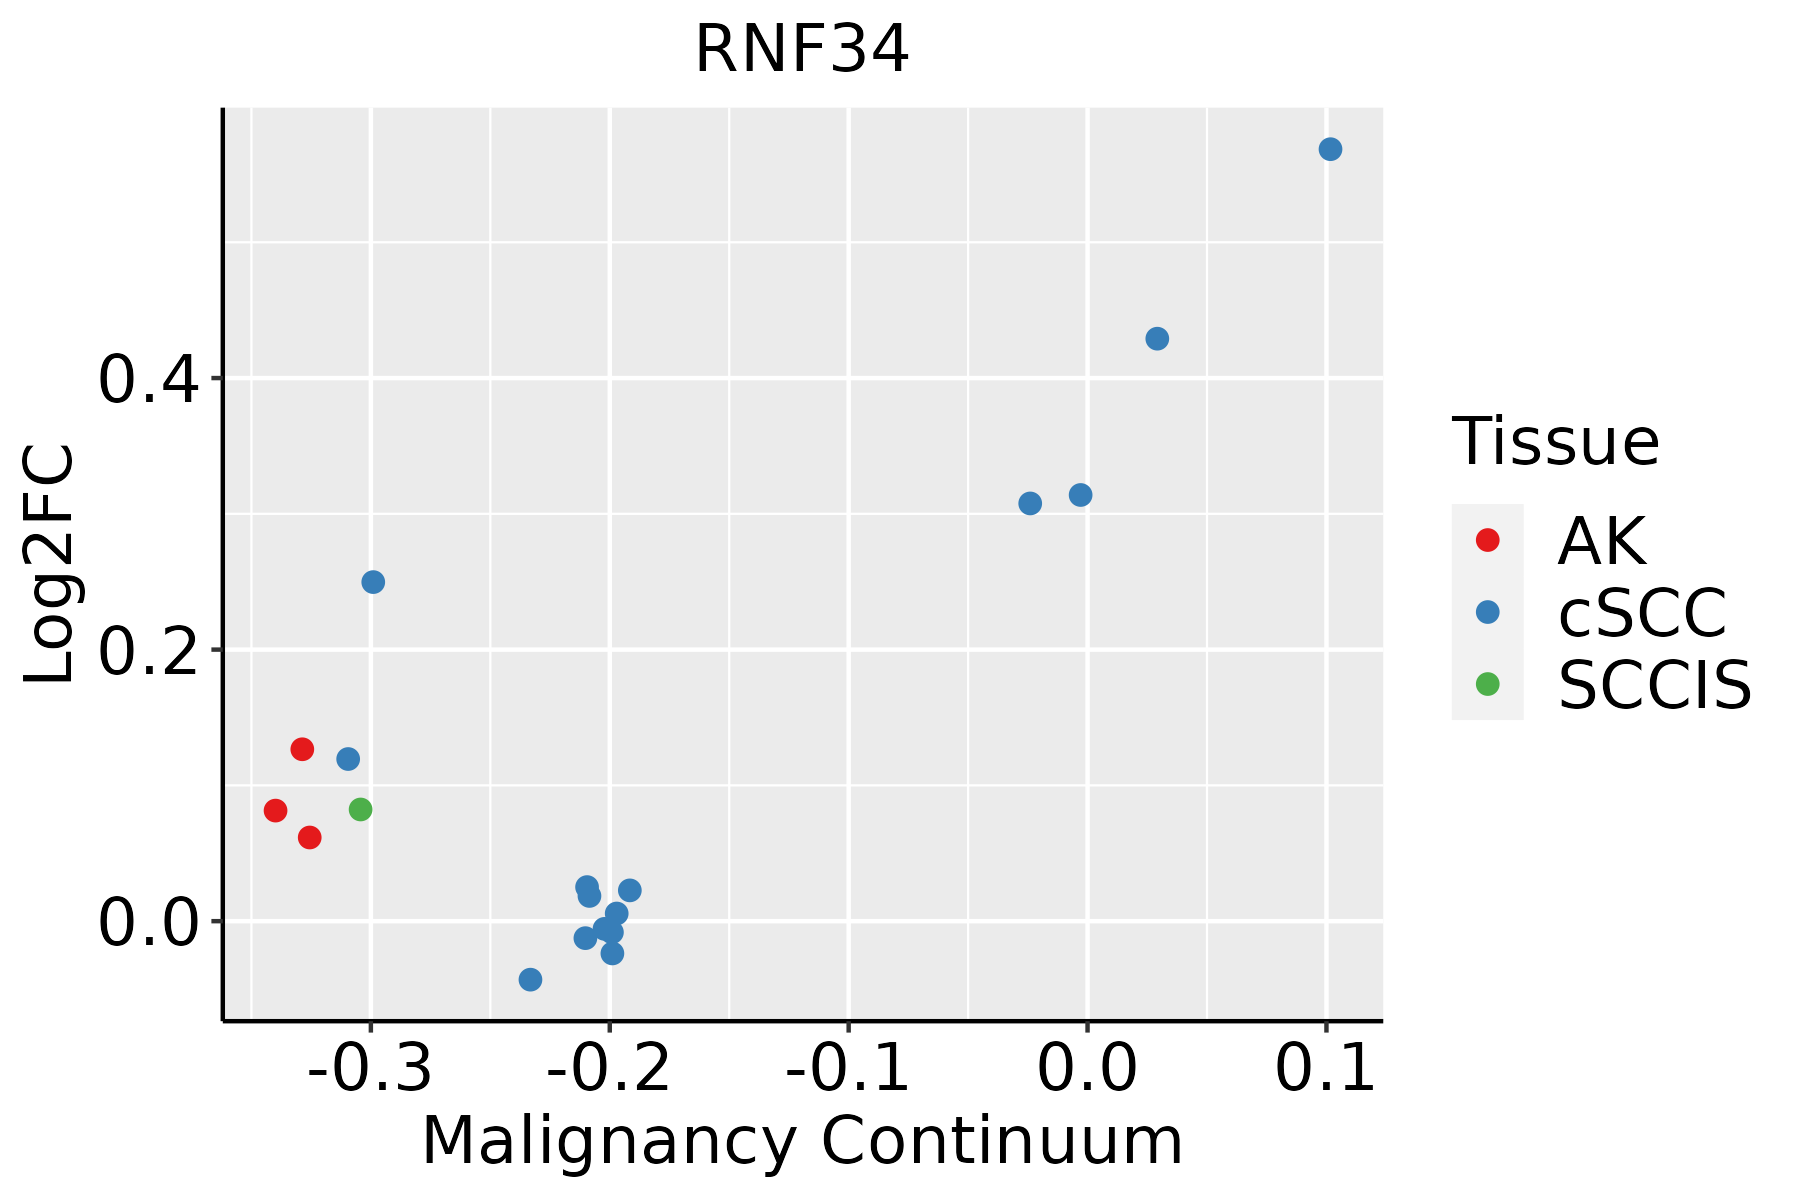 | AK: Actinic keratosis |
| cSCC: Cutaneous squamous cell carcinoma | ||
| SCCIS:squamous cell carcinoma in situ |
| ∗log2FC in expression of this searched gene in stem-like cells from each diseased tissue sample relative to stem-like cells in normal samples in each tissue plotted against the malignancy continuum. Samples are colored based on if they are from different disease stage. |
Top |
Malignant transformation related pathway analysis |
| Find out the enriched GO biological processes and KEGG pathways involved in transition from healthy to precancer to cancer |
| Tissue | Disease Stage | Enriched GO biological Processes |
| Colorectum | AD |  |
| Colorectum | SER |  |
| Colorectum | MSS |  |
| Colorectum | MSI-H |  |
| Colorectum | FAP |  |
| ∗Top 15 enriched GO BP terms are showed in the bar plot of each disease state in each tissue. Each row represents a significant GO biological process which is colored according to the -log10(p.adjust). |
| Page: 1 2 3 4 5 6 7 8 9 |
| GO ID | Tissue | Disease Stage | Description | Gene Ratio | Bg Ratio | pvalue | p.adjust | Count |
| GO:0010498111 | Esophagus | ESCC | proteasomal protein catabolic process | 369/8552 | 490/18723 | 1.13e-41 | 1.80e-38 | 369 |
| GO:0043161111 | Esophagus | ESCC | proteasome-mediated ubiquitin-dependent protein catabolic process | 312/8552 | 412/18723 | 3.53e-36 | 4.48e-33 | 312 |
| GO:2001233111 | Esophagus | ESCC | regulation of apoptotic signaling pathway | 256/8552 | 356/18723 | 4.11e-24 | 1.04e-21 | 256 |
| GO:000020917 | Esophagus | ESCC | protein polyubiquitination | 170/8552 | 236/18723 | 1.40e-16 | 1.09e-14 | 170 |
| GO:0097191111 | Esophagus | ESCC | extrinsic apoptotic signaling pathway | 159/8552 | 219/18723 | 4.12e-16 | 2.94e-14 | 159 |
| GO:2001234111 | Esophagus | ESCC | negative regulation of apoptotic signaling pathway | 161/8552 | 224/18723 | 1.24e-15 | 8.09e-14 | 161 |
| GO:0072331111 | Esophagus | ESCC | signal transduction by p53 class mediator | 121/8552 | 163/18723 | 9.61e-14 | 4.69e-12 | 121 |
| GO:2001236111 | Esophagus | ESCC | regulation of extrinsic apoptotic signaling pathway | 111/8552 | 151/18723 | 2.97e-12 | 1.18e-10 | 111 |
| GO:2000116111 | Esophagus | ESCC | regulation of cysteine-type endopeptidase activity | 158/8552 | 235/18723 | 1.67e-11 | 5.90e-10 | 158 |
| GO:0043281111 | Esophagus | ESCC | regulation of cysteine-type endopeptidase activity involved in apoptotic process | 143/8552 | 209/18723 | 2.12e-11 | 7.31e-10 | 143 |
| GO:007093617 | Esophagus | ESCC | protein K48-linked ubiquitination | 55/8552 | 65/18723 | 8.42e-11 | 2.58e-09 | 55 |
| GO:0052547111 | Esophagus | ESCC | regulation of peptidase activity | 275/8552 | 461/18723 | 7.54e-10 | 1.88e-08 | 275 |
| GO:0030522110 | Esophagus | ESCC | intracellular receptor signaling pathway | 170/8552 | 265/18723 | 8.58e-10 | 2.09e-08 | 170 |
| GO:1901796111 | Esophagus | ESCC | regulation of signal transduction by p53 class mediator | 70/8552 | 93/18723 | 5.69e-09 | 1.18e-07 | 70 |
| GO:0052548111 | Esophagus | ESCC | regulation of endopeptidase activity | 253/8552 | 432/18723 | 3.68e-08 | 6.78e-07 | 253 |
| GO:2000117110 | Esophagus | ESCC | negative regulation of cysteine-type endopeptidase activity | 63/8552 | 86/18723 | 1.84e-07 | 2.88e-06 | 63 |
| GO:0043154110 | Esophagus | ESCC | negative regulation of cysteine-type endopeptidase activity involved in apoptotic process | 58/8552 | 78/18723 | 2.38e-07 | 3.61e-06 | 58 |
| GO:2001237111 | Esophagus | ESCC | negative regulation of extrinsic apoptotic signaling pathway | 69/8552 | 97/18723 | 3.23e-07 | 4.55e-06 | 69 |
| GO:000862519 | Esophagus | ESCC | extrinsic apoptotic signaling pathway via death domain receptors | 59/8552 | 82/18723 | 1.23e-06 | 1.52e-05 | 59 |
| GO:0045861111 | Esophagus | ESCC | negative regulation of proteolysis | 195/8552 | 351/18723 | 1.13e-04 | 7.85e-04 | 195 |
| Page: 1 2 3 4 5 6 7 8 |
| Pathway ID | Tissue | Disease Stage | Description | Gene Ratio | Bg Ratio | pvalue | p.adjust | qvalue | Count |
| Page: 1 |
Top |
Cell-cell communication analysis |
| Identification of potential cell-cell interactions between two cell types and their ligand-receptor pairs for different disease states |
| Ligand | Receptor | LRpair | Pathway | Tissue | Disease Stage |
| Page: 1 |
Top |
Single-cell gene regulatory network inference analysis |
| Find out the significant the regulons (TFs) and the target genes of each regulon across cell types for different disease states |
| TF | Cell Type | Tissue | Disease Stage | Target Gene | RSS | Regulon Activity |
| ∗The dot plots of a searched regulon are shown for all cell subpopulations in each disease state of each tissue based on the regulon specific score inferred using pySCENIC and by calculating the average expression. |
| Page: 1 |
Top |
Somatic mutation of malignant transformation related genes |
| Annotation of somatic variants for genes involved in malignant transformation |
| Hugo Symbol | Variant Class | Variant Classification | dbSNP RS | HGVSc | HGVSp | HGVSp Short | SWISSPROT | BIOTYPE | SIFT | PolyPhen | Tumor Sample Barcode | Tissue | Histology | Sex | Age | Stage | Therapy Types | Drugs | Outcome |
| RNF34 | SNV | Missense_Mutation | c.772N>C | p.Asp258His | p.D258H | Q969K3 | protein_coding | deleterious(0) | probably_damaging(1) | TCGA-AC-A23H-01 | Breast | breast invasive carcinoma | Female | >=65 | I/II | Unknown | Unknown | PD | |
| RNF34 | SNV | Missense_Mutation | novel | c.304N>C | p.Thr102Pro | p.T102P | Q969K3 | protein_coding | tolerated(0.06) | probably_damaging(0.999) | TCGA-AC-A6IW-01 | Breast | breast invasive carcinoma | Female | >=65 | I/II | Unknown | Unknown | SD |
| RNF34 | SNV | Missense_Mutation | novel | c.718N>A | p.Ala240Thr | p.A240T | Q969K3 | protein_coding | tolerated(0.6) | benign(0) | TCGA-BH-A0AY-01 | Breast | breast invasive carcinoma | Female | <65 | I/II | Chemotherapy | SD | |
| RNF34 | SNV | Missense_Mutation | novel | c.697N>A | p.Asp233Asn | p.D233N | Q969K3 | protein_coding | tolerated(0.51) | benign(0.036) | TCGA-D8-A27G-01 | Breast | breast invasive carcinoma | Female | >=65 | I/II | Unknown | Unknown | SD |
| RNF34 | SNV | Missense_Mutation | novel | c.173N>A | p.Gly58Glu | p.G58E | Q969K3 | protein_coding | tolerated(1) | possibly_damaging(0.57) | TCGA-2W-A8YY-01 | Cervix | cervical & endocervical cancer | Female | <65 | I/II | Chemotherapy | cisplatin | CR |
| RNF34 | SNV | Missense_Mutation | rs61754471 | c.1058N>A | p.Arg353His | p.R353H | Q969K3 | protein_coding | deleterious(0) | probably_damaging(0.999) | TCGA-EA-A410-01 | Cervix | cervical & endocervical cancer | Female | <65 | I/II | Unknown | Unknown | SD |
| RNF34 | SNV | Missense_Mutation | c.324N>T | p.Glu108Asp | p.E108D | Q969K3 | protein_coding | tolerated(0.17) | benign(0.431) | TCGA-A6-6141-01 | Colorectum | colon adenocarcinoma | Male | <65 | I/II | Chemotherapy | 5-fu | SD | |
| RNF34 | SNV | Missense_Mutation | rs369744966 | c.941N>A | p.Arg314Gln | p.R314Q | Q969K3 | protein_coding | tolerated(0.56) | benign(0.003) | TCGA-AA-3877-01 | Colorectum | colon adenocarcinoma | Female | >=65 | I/II | Unknown | Unknown | SD |
| RNF34 | SNV | Missense_Mutation | novel | c.235T>A | p.Cys79Ser | p.C79S | Q969K3 | protein_coding | deleterious(0) | probably_damaging(0.999) | TCGA-AA-3939-01 | Colorectum | colon adenocarcinoma | Male | >=65 | I/II | Unknown | Unknown | SD |
| RNF34 | SNV | Missense_Mutation | novel | c.717C>A | p.Asn239Lys | p.N239K | Q969K3 | protein_coding | tolerated(0.93) | benign(0.13) | TCGA-AA-A01D-01 | Colorectum | colon adenocarcinoma | Female | <65 | III/IV | Chemotherapy | capecitabine | PD |
| Page: 1 2 3 4 |
Top |
Related drugs of malignant transformation related genes |
| Identification of chemicals and drugs interact with genes involved in malignant transfromation |
| (DGIdb 4.0) |
| Entrez ID | Symbol | Category | Interaction Types | Drug Claim Name | Drug Name | PMIDs |
| Page: 1 |

Copyright 2023-Present -The University of Texas Health Science Center at Houston |