
|
|||||
|
 | |
| |
| |
| |
| |
| |
|
Gene: RNF31 |
Gene summary for RNF31 |
| Gene information | Species | Human | Gene symbol | RNF31 | Gene ID | 55072 |
| Gene name | ring finger protein 31 | |
| Gene Alias | HOIP | |
| Cytomap | 14q12 | |
| Gene Type | protein-coding | GO ID | GO:0000209 | UniProtAcc | Q96EP0 |
Top |
Malignant transformation analysis |
| Identification of the aberrant gene expression in precancerous and cancerous lesions by comparing the gene expression of stem-like cells in diseased tissues with normal stem cells |
| Entrez ID | Symbol | Replicates | Species | Organ | Tissue | Adj P-value | Log2FC | Malignancy |
| 55072 | RNF31 | LZE24T | Human | Esophagus | ESCC | 6.88e-12 | 2.88e-01 | 0.0596 |
| 55072 | RNF31 | LZE21T | Human | Esophagus | ESCC | 8.02e-04 | 2.73e-01 | 0.0655 |
| 55072 | RNF31 | P1T-E | Human | Esophagus | ESCC | 1.64e-05 | 2.38e-01 | 0.0875 |
| 55072 | RNF31 | P2T-E | Human | Esophagus | ESCC | 1.62e-13 | 2.51e-01 | 0.1177 |
| 55072 | RNF31 | P4T-E | Human | Esophagus | ESCC | 1.05e-03 | 1.19e-01 | 0.1323 |
| 55072 | RNF31 | P5T-E | Human | Esophagus | ESCC | 3.50e-02 | 7.33e-02 | 0.1327 |
| 55072 | RNF31 | P8T-E | Human | Esophagus | ESCC | 4.44e-08 | 1.91e-01 | 0.0889 |
| 55072 | RNF31 | P9T-E | Human | Esophagus | ESCC | 4.01e-04 | 1.18e-01 | 0.1131 |
| 55072 | RNF31 | P10T-E | Human | Esophagus | ESCC | 4.41e-07 | 1.55e-01 | 0.116 |
| 55072 | RNF31 | P11T-E | Human | Esophagus | ESCC | 3.75e-08 | 2.48e-01 | 0.1426 |
| 55072 | RNF31 | P12T-E | Human | Esophagus | ESCC | 2.20e-17 | 3.58e-01 | 0.1122 |
| 55072 | RNF31 | P15T-E | Human | Esophagus | ESCC | 5.63e-18 | 3.38e-01 | 0.1149 |
| 55072 | RNF31 | P16T-E | Human | Esophagus | ESCC | 4.31e-06 | 1.10e-01 | 0.1153 |
| 55072 | RNF31 | P17T-E | Human | Esophagus | ESCC | 7.64e-08 | 2.81e-01 | 0.1278 |
| 55072 | RNF31 | P19T-E | Human | Esophagus | ESCC | 7.48e-03 | 3.42e-01 | 0.1662 |
| 55072 | RNF31 | P20T-E | Human | Esophagus | ESCC | 1.51e-02 | 9.15e-02 | 0.1124 |
| 55072 | RNF31 | P21T-E | Human | Esophagus | ESCC | 8.40e-04 | 1.15e-01 | 0.1617 |
| 55072 | RNF31 | P22T-E | Human | Esophagus | ESCC | 3.97e-04 | 1.16e-01 | 0.1236 |
| 55072 | RNF31 | P23T-E | Human | Esophagus | ESCC | 2.24e-10 | 2.39e-01 | 0.108 |
| 55072 | RNF31 | P24T-E | Human | Esophagus | ESCC | 4.41e-07 | 1.59e-01 | 0.1287 |
| Page: 1 2 3 |
| Tissue | Expression Dynamics | Abbreviation |
| Liver | 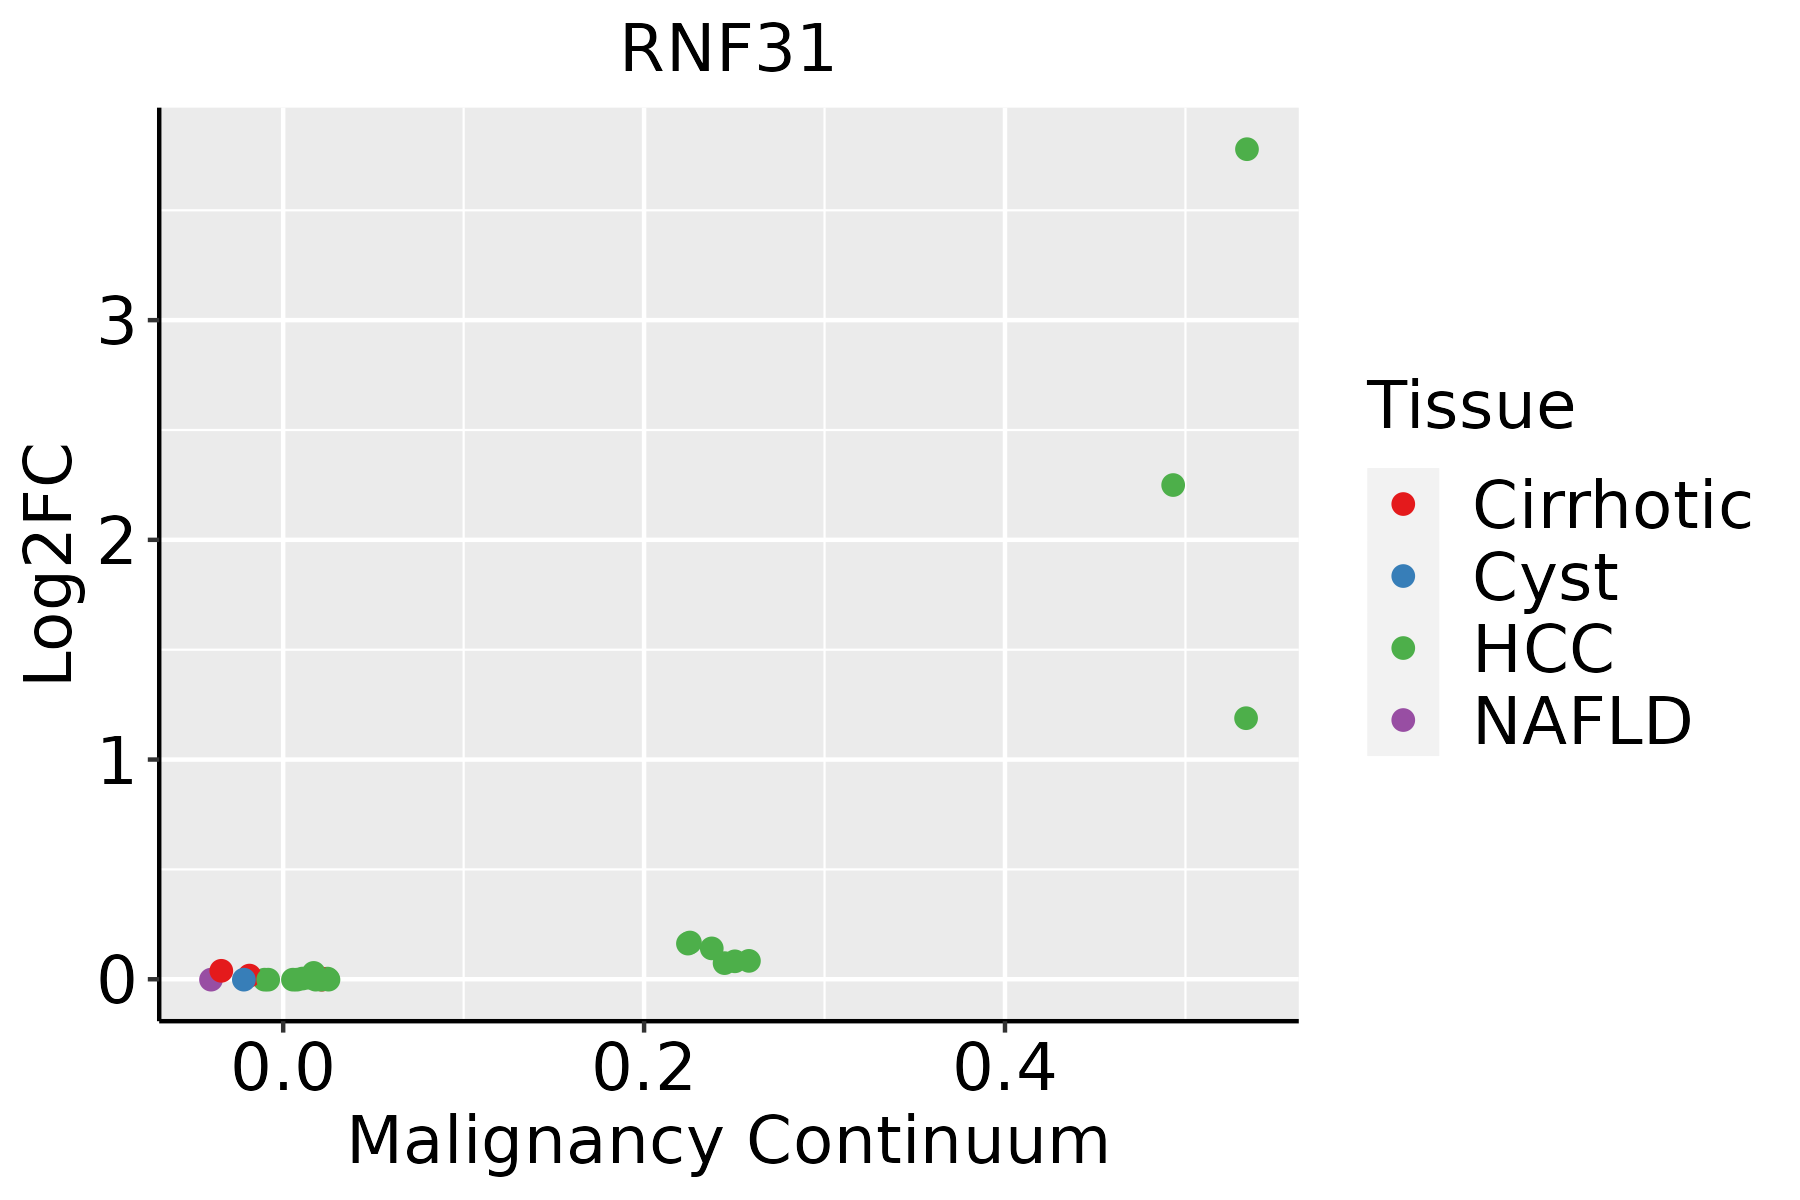 | HCC: Hepatocellular carcinoma |
| NAFLD: Non-alcoholic fatty liver disease |
| ∗log2FC in expression of this searched gene in stem-like cells from each diseased tissue sample relative to stem-like cells in normal samples in each tissue plotted against the malignancy continuum. Samples are colored based on if they are from different disease stage. |
Top |
Malignant transformation related pathway analysis |
| Find out the enriched GO biological processes and KEGG pathways involved in transition from healthy to precancer to cancer |
| Tissue | Disease Stage | Enriched GO biological Processes |
| Colorectum | AD |  |
| Colorectum | SER |  |
| Colorectum | MSS |  |
| Colorectum | MSI-H |  |
| Colorectum | FAP |  |
| ∗Top 15 enriched GO BP terms are showed in the bar plot of each disease state in each tissue. Each row represents a significant GO biological process which is colored according to the -log10(p.adjust). |
| Page: 1 2 3 4 5 6 7 8 9 |
| GO ID | Tissue | Disease Stage | Description | Gene Ratio | Bg Ratio | pvalue | p.adjust | Count |
| GO:007259422 | Liver | HCC | establishment of protein localization to organelle | 299/7958 | 422/18723 | 1.06e-32 | 6.10e-30 | 299 |
| GO:190382922 | Liver | HCC | positive regulation of cellular protein localization | 199/7958 | 276/18723 | 1.15e-23 | 2.62e-21 | 199 |
| GO:000660512 | Liver | HCC | protein targeting | 219/7958 | 314/18723 | 7.74e-23 | 1.49e-20 | 219 |
| GO:003238621 | Liver | HCC | regulation of intracellular transport | 231/7958 | 337/18723 | 1.99e-22 | 3.40e-20 | 231 |
| GO:000683912 | Liver | HCC | mitochondrial transport | 184/7958 | 254/18723 | 2.30e-22 | 3.83e-20 | 184 |
| GO:003315721 | Liver | HCC | regulation of intracellular protein transport | 165/7958 | 229/18723 | 8.37e-20 | 1.15e-17 | 165 |
| GO:003238821 | Liver | HCC | positive regulation of intracellular transport | 148/7958 | 202/18723 | 5.15e-19 | 6.66e-17 | 148 |
| GO:007265512 | Liver | HCC | establishment of protein localization to mitochondrion | 98/7958 | 120/18723 | 1.18e-18 | 1.46e-16 | 98 |
| GO:007058512 | Liver | HCC | protein localization to mitochondrion | 101/7958 | 125/18723 | 1.53e-18 | 1.86e-16 | 101 |
| GO:009031621 | Liver | HCC | positive regulation of intracellular protein transport | 121/7958 | 160/18723 | 1.27e-17 | 1.39e-15 | 121 |
| GO:190495122 | Liver | HCC | positive regulation of establishment of protein localization | 207/7958 | 319/18723 | 3.95e-16 | 3.29e-14 | 207 |
| GO:000662612 | Liver | HCC | protein targeting to mitochondrion | 82/7958 | 100/18723 | 4.93e-16 | 4.05e-14 | 82 |
| GO:005122222 | Liver | HCC | positive regulation of protein transport | 194/7958 | 303/18723 | 2.41e-14 | 1.56e-12 | 194 |
| GO:000020921 | Liver | HCC | protein polyubiquitination | 151/7958 | 236/18723 | 1.90e-11 | 7.59e-10 | 151 |
| GO:190374911 | Liver | HCC | positive regulation of establishment of protein localization to mitochondrion | 33/7958 | 36/18723 | 7.67e-10 | 2.37e-08 | 33 |
| GO:19039551 | Liver | HCC | positive regulation of protein targeting to mitochondrion | 30/7958 | 32/18723 | 1.19e-09 | 3.58e-08 | 30 |
| GO:190353311 | Liver | HCC | regulation of protein targeting | 60/7958 | 81/18723 | 7.70e-09 | 1.94e-07 | 60 |
| GO:190374711 | Liver | HCC | regulation of establishment of protein localization to mitochondrion | 41/7958 | 50/18723 | 1.14e-08 | 2.83e-07 | 41 |
| GO:190321411 | Liver | HCC | regulation of protein targeting to mitochondrion | 36/7958 | 44/18723 | 1.02e-07 | 1.98e-06 | 36 |
| GO:000724912 | Liver | HCC | I-kappaB kinase/NF-kappaB signaling | 156/7958 | 281/18723 | 6.66e-06 | 8.00e-05 | 156 |
| Page: 1 2 |
| Pathway ID | Tissue | Disease Stage | Description | Gene Ratio | Bg Ratio | pvalue | p.adjust | qvalue | Count |
| Page: 1 |
Top |
Cell-cell communication analysis |
| Identification of potential cell-cell interactions between two cell types and their ligand-receptor pairs for different disease states |
| Ligand | Receptor | LRpair | Pathway | Tissue | Disease Stage |
| Page: 1 |
Top |
Single-cell gene regulatory network inference analysis |
| Find out the significant the regulons (TFs) and the target genes of each regulon across cell types for different disease states |
| TF | Cell Type | Tissue | Disease Stage | Target Gene | RSS | Regulon Activity |
| ∗The dot plots of a searched regulon are shown for all cell subpopulations in each disease state of each tissue based on the regulon specific score inferred using pySCENIC and by calculating the average expression. |
| Page: 1 |
Top |
Somatic mutation of malignant transformation related genes |
| Annotation of somatic variants for genes involved in malignant transformation |
| Hugo Symbol | Variant Class | Variant Classification | dbSNP RS | HGVSc | HGVSp | HGVSp Short | SWISSPROT | BIOTYPE | SIFT | PolyPhen | Tumor Sample Barcode | Tissue | Histology | Sex | Age | Stage | Therapy Types | Drugs | Outcome |
| RNF31 | SNV | Missense_Mutation | c.323C>A | p.Thr108Lys | p.T108K | Q96EP0 | protein_coding | deleterious(0) | probably_damaging(1) | TCGA-A1-A0SO-01 | Breast | breast invasive carcinoma | Female | >=65 | I/II | Chemotherapy | SD | ||
| RNF31 | SNV | Missense_Mutation | novel | c.2246N>T | p.Arg749Leu | p.R749L | Q96EP0 | protein_coding | deleterious(0.03) | benign(0.081) | TCGA-A2-A25A-01 | Breast | breast invasive carcinoma | Female | <65 | I/II | Unspecific | Cytoxan | SD |
| RNF31 | SNV | Missense_Mutation | c.2642N>T | p.Ala881Val | p.A881V | Q96EP0 | protein_coding | deleterious(0.01) | possibly_damaging(0.787) | TCGA-AC-A23H-01 | Breast | breast invasive carcinoma | Female | >=65 | I/II | Unknown | Unknown | PD | |
| RNF31 | SNV | Missense_Mutation | c.1231N>G | p.Gln411Glu | p.Q411E | Q96EP0 | protein_coding | tolerated(1) | benign(0) | TCGA-E2-A1IH-01 | Breast | breast invasive carcinoma | Female | >=65 | I/II | Hormone Therapy | aromasin | SD | |
| RNF31 | insertion | Nonsense_Mutation | novel | c.680_681insTGCTGAACTATGGGCATAGTTCAGCATTCTGGGA | p.His228AlafsTer6 | p.H228Afs*6 | Q96EP0 | protein_coding | TCGA-A2-A0CT-01 | Breast | breast invasive carcinoma | Female | >=65 | I/II | Chemotherapy | cytoxan | SD | ||
| RNF31 | insertion | Frame_Shift_Ins | novel | c.1364_1365insGTCTAGCTGGAAACCGTTTTTATCTGTATTATTGC | p.Pro456SerfsTer48 | p.P456Sfs*48 | Q96EP0 | protein_coding | TCGA-A8-A07G-01 | Breast | breast invasive carcinoma | Female | >=65 | I/II | Chemotherapy | 5-fluorouracil | CR | ||
| RNF31 | insertion | Frame_Shift_Ins | novel | c.1446_1447insGCTG | p.Lys483AlafsTer37 | p.K483Afs*37 | Q96EP0 | protein_coding | TCGA-A8-A08L-01 | Breast | breast invasive carcinoma | Female | >=65 | III/IV | Unknown | Unknown | SD | ||
| RNF31 | insertion | Frame_Shift_Ins | novel | c.1448_1449insTCAG | p.Lys483AsnfsTer37 | p.K483Nfs*37 | Q96EP0 | protein_coding | TCGA-A8-A08L-01 | Breast | breast invasive carcinoma | Female | >=65 | III/IV | Unknown | Unknown | SD | ||
| RNF31 | insertion | Frame_Shift_Ins | novel | c.2487_2488insCACTTCACCAT | p.Arg830HisfsTer25 | p.R830Hfs*25 | Q96EP0 | protein_coding | TCGA-AO-A0JB-01 | Breast | breast invasive carcinoma | Female | <65 | III/IV | Chemotherapy | cyclophosphamide | SD | ||
| RNF31 | deletion | Frame_Shift_Del | c.752delN | p.Ala251ValfsTer17 | p.A251Vfs*17 | Q96EP0 | protein_coding | TCGA-D8-A27V-01 | Breast | breast invasive carcinoma | Female | <65 | I/II | Hormone Therapy | tamoxiphen | SD |
| Page: 1 2 3 4 5 6 7 8 9 10 11 |
Top |
Related drugs of malignant transformation related genes |
| Identification of chemicals and drugs interact with genes involved in malignant transfromation |
| (DGIdb 4.0) |
| Entrez ID | Symbol | Category | Interaction Types | Drug Claim Name | Drug Name | PMIDs |
| Page: 1 |

Copyright 2023-Present -The University of Texas Health Science Center at Houston |