Schematic overview of the cellular and molecular mechanisms involved in the cancer progression, including the proposed cellular and molecular mechanisms in cancer cells trajectory. AT1: alveolar type 1 cells; AT2: alveolar type 2 cells; AAH: atypical adenomatous hyperplasia; AIS: adenocarcinoma in situ; MIA: minimally invasive adenocarcinoma; IA: invasive adenocarcinoma; EMT: epithelial-mesenchymal transition

Home

Download

Statistics

Help

Contact

Center for Computational Systems Medicine
leaf

Gene summary

leaf

Malignant transformation analysis

leaf

Malignant transformation related pathway analysis

leaf

Cell-cell communication analysis

leaf

Single-cell gene regulatory network inference analysis

leaf

Somatic mutation of malignant transformation related genes

leaf

Related drugs of malignant transformation related genes

Gene: RNF26

Gene summary for RNF26

check button Gene summary.

Gene informationSpeciesHuman
Gene symbol

RNF26

Gene ID

79102

Gene namering finger protein 26
Gene AliasRNF26
Cytomap11q23.3
Gene Typeprotein-coding
GO ID

GO:0000209

UniProtAcc

Q9BY78


Top

Malignant transformation analysis

check button Identification of the aberrant gene expression in precancerous and cancerous lesions by comparing the gene expression of stem-like cells in diseased tissues with normal stem cells
check button Malignant transformation involving gene list.
Entrez IDSymbolReplicatesSpeciesOrganTissueAdj P-valueLog2FCMalignancy
79102RNF26LZE4THumanEsophagusESCC4.10e-059.86e-020.0811
79102RNF26LZE8THumanEsophagusESCC1.35e-071.46e-010.067
79102RNF26LZE20THumanEsophagusESCC1.94e-021.86e-010.0662
79102RNF26LZE22D1HumanEsophagusHGIN8.19e-031.68e-010.0595
79102RNF26LZE22THumanEsophagusESCC4.56e-131.23e+000.068
79102RNF26LZE24THumanEsophagusESCC9.63e-195.12e-010.0596
79102RNF26P1T-EHumanEsophagusESCC1.43e-041.52e-010.0875
79102RNF26P2T-EHumanEsophagusESCC4.77e-132.94e-010.1177
79102RNF26P4T-EHumanEsophagusESCC2.40e-226.49e-010.1323
79102RNF26P5T-EHumanEsophagusESCC7.98e-132.55e-010.1327
79102RNF26P9T-EHumanEsophagusESCC7.20e-102.20e-010.1131
79102RNF26P10T-EHumanEsophagusESCC6.56e-152.16e-010.116
79102RNF26P11T-EHumanEsophagusESCC3.93e-154.94e-010.1426
79102RNF26P12T-EHumanEsophagusESCC2.13e-274.47e-010.1122
79102RNF26P15T-EHumanEsophagusESCC3.50e-082.62e-010.1149
79102RNF26P16T-EHumanEsophagusESCC6.48e-203.18e-010.1153
79102RNF26P17T-EHumanEsophagusESCC3.52e-053.11e-010.1278
79102RNF26P19T-EHumanEsophagusESCC7.97e-054.30e-010.1662
79102RNF26P20T-EHumanEsophagusESCC1.07e-181.51e-010.1124
79102RNF26P21T-EHumanEsophagusESCC3.41e-366.76e-010.1617
Page: 1 2 3 4 5 

check button Transcriptomic changes along malignancy continuum.
TissueExpression DynamicsAbbreviation
EsophagusThe image shows the transcriptomic changes along malignancy continuum.log2FC in expression of this searched gene in stem-like cells from each diseased tissue sample relative to stem-like cells in normal samples in each tissue plotted against the malignancy continuum. Samples are colored based on if they are from different disease stage.
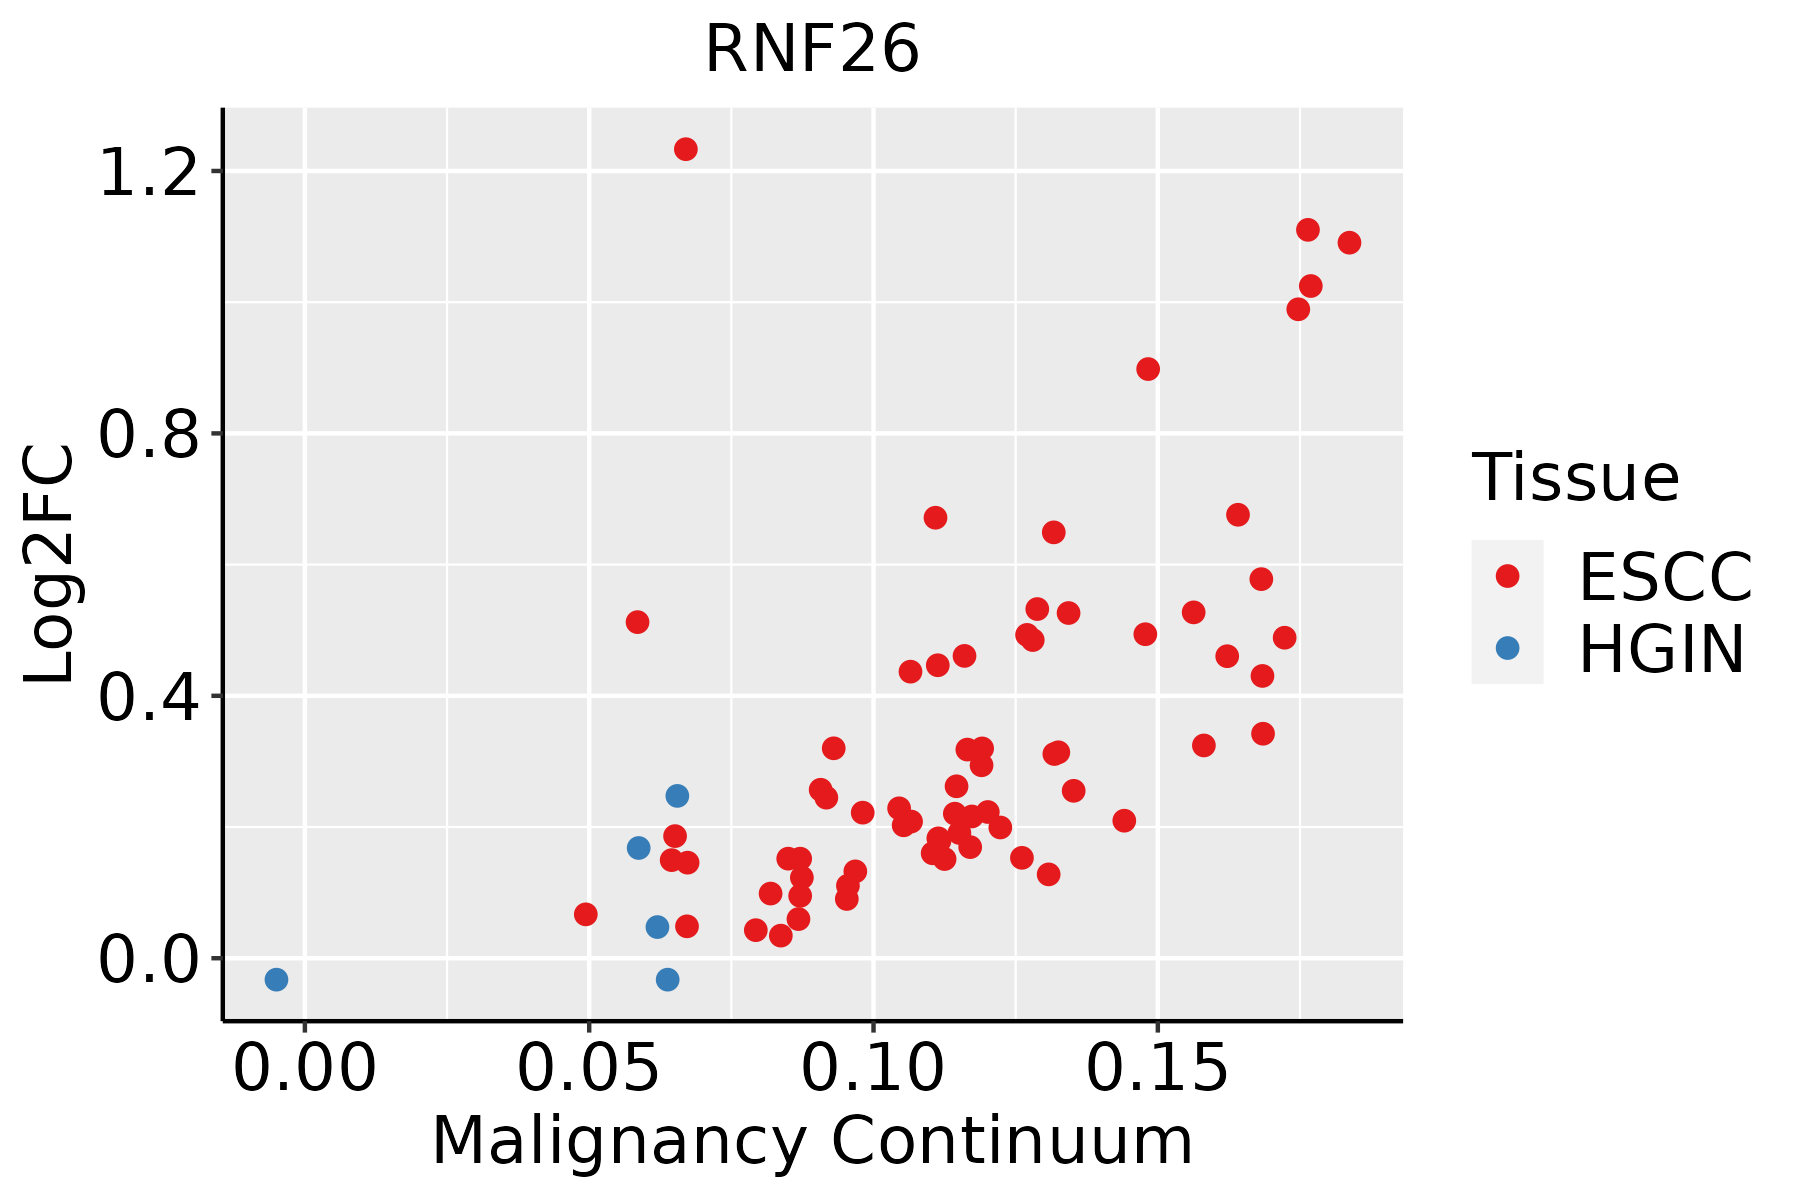
ESCC: Esophageal squamous cell carcinoma
HGIN: High-grade intraepithelial neoplasias
LGIN: Low-grade intraepithelial neoplasias
LiverThe image shows the transcriptomic changes along malignancy continuum.log2FC in expression of this searched gene in stem-like cells from each diseased tissue sample relative to stem-like cells in normal samples in each tissue plotted against the malignancy continuum. Samples are colored based on if they are from different disease stage.
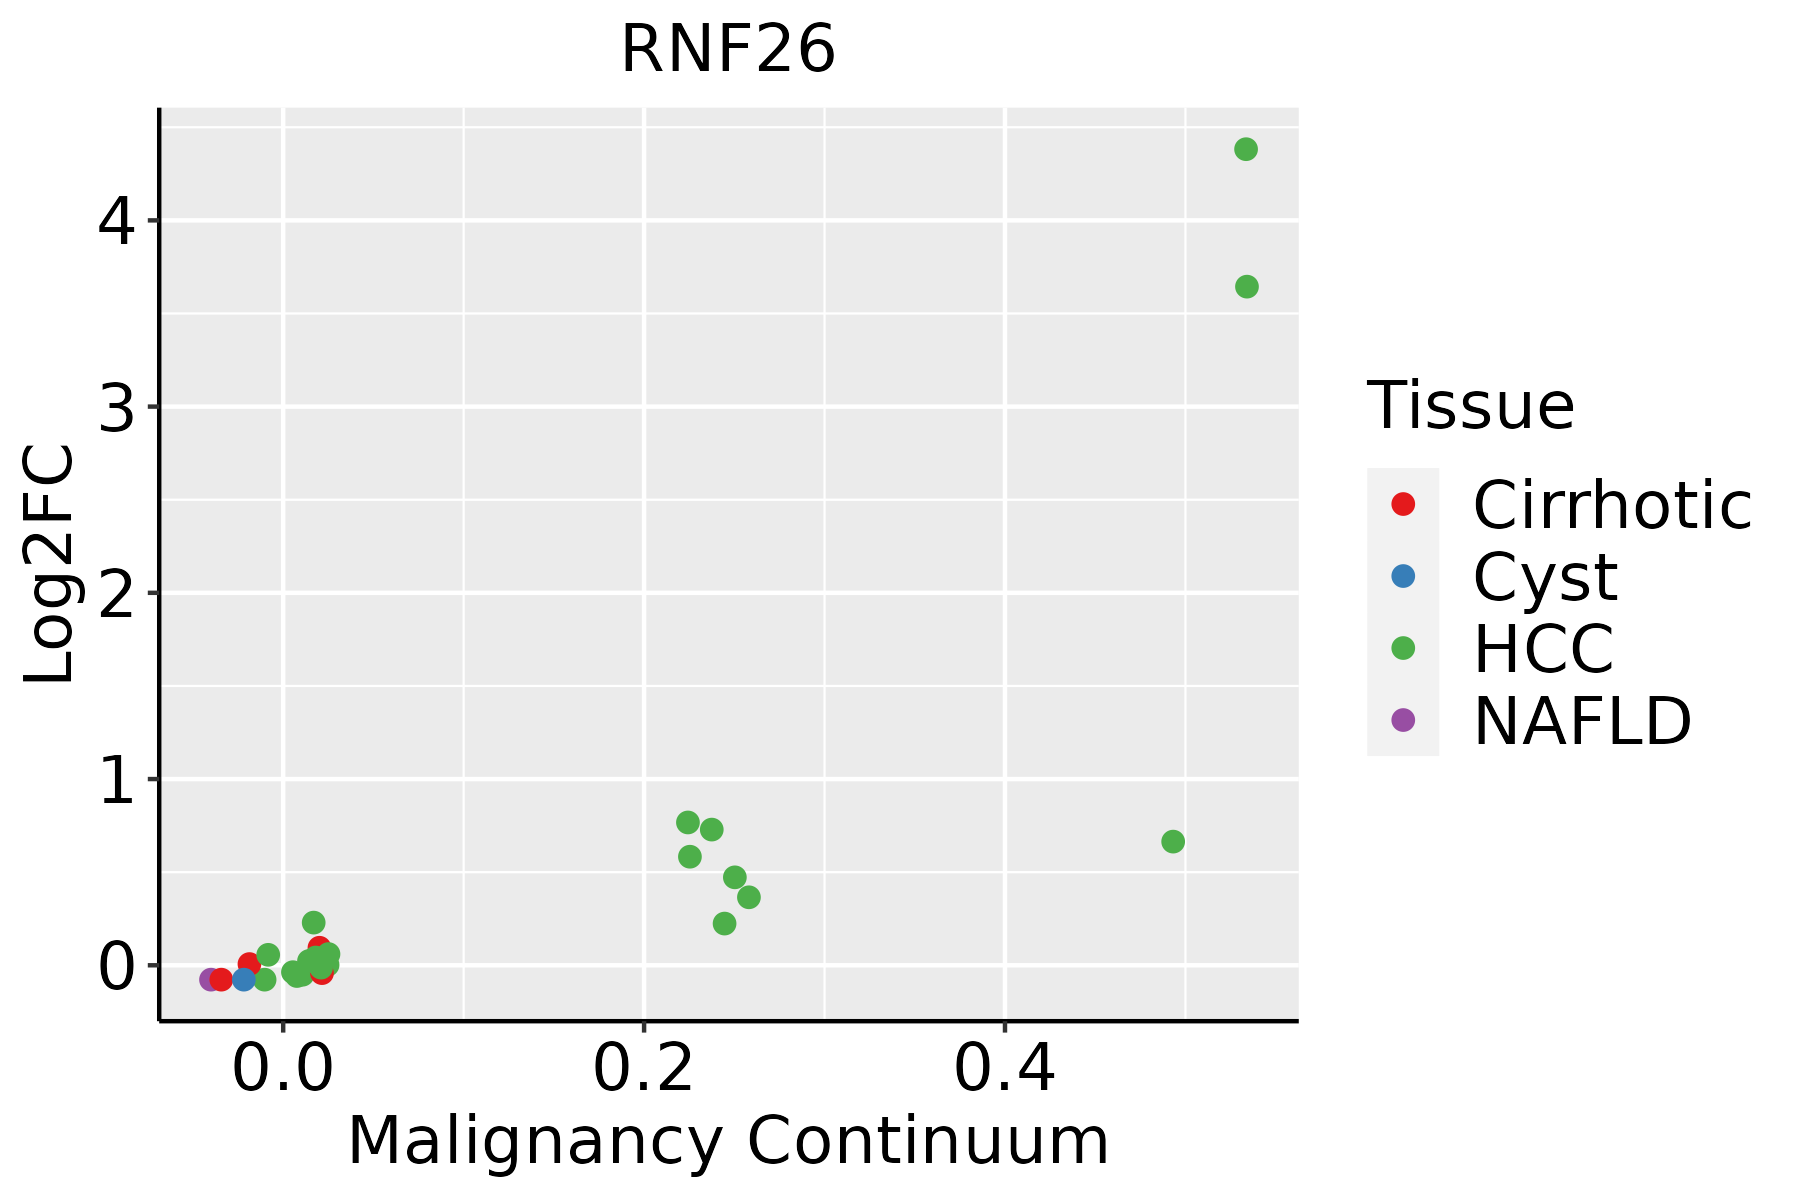
HCC: Hepatocellular carcinoma
NAFLD: Non-alcoholic fatty liver disease
Oral CavityThe image shows the transcriptomic changes along malignancy continuum.log2FC in expression of this searched gene in stem-like cells from each diseased tissue sample relative to stem-like cells in normal samples in each tissue plotted against the malignancy continuum. Samples are colored based on if they are from different disease stage.
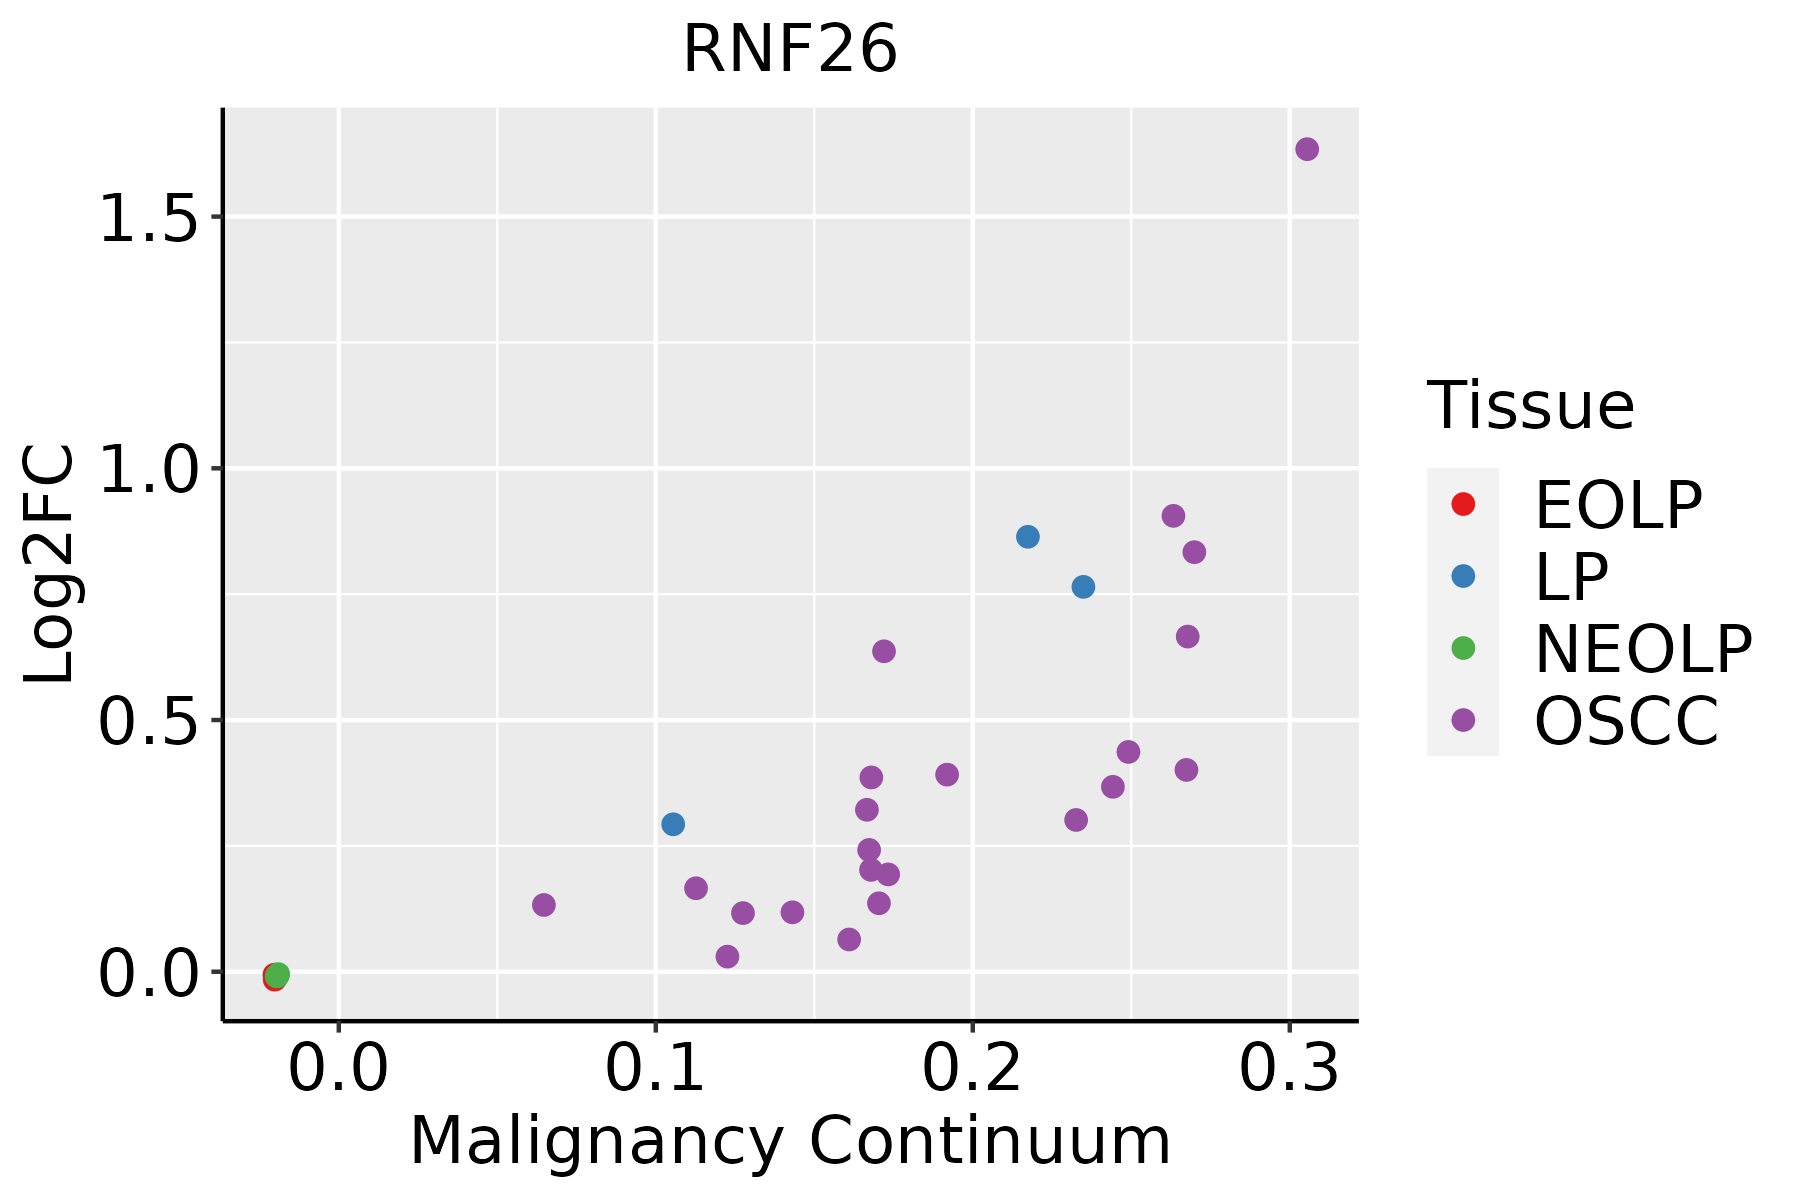
EOLP: Erosive Oral lichen planus
LP: leukoplakia
NEOLP: Non-erosive oral lichen planus
OSCC: Oral squamous cell carcinoma
SkinThe image shows the transcriptomic changes along malignancy continuum.log2FC in expression of this searched gene in stem-like cells from each diseased tissue sample relative to stem-like cells in normal samples in each tissue plotted against the malignancy continuum. Samples are colored based on if they are from different disease stage.AK: Actinic keratosis
cSCC: Cutaneous squamous cell carcinoma
SCCIS:squamous cell carcinoma in situ
∗log2FC in expression of this searched gene in stem-like cells from each diseased tissue sample relative to stem-like cells in normal samples in each tissue plotted against the malignancy continuum. Samples are colored based on if they are from different disease stage.

Top

Malignant transformation related pathway analysis

check buttonFind out the enriched GO biological processes and KEGG pathways involved in transition from healthy to precancer to cancer
check button Figure of enriched GO biological processes.
TissueDisease StageEnriched GO biological Processes
ColorectumADGO analysis - Figure of enriched GO biological processes: Top 15 enriched GO BP terms are showed in the bar plot of each disease state in each tissue. Each row represents a significant GO biological process which is colored according to the -log10(p.adjust).
ColorectumSERGO analysis - Figure of enriched GO biological processes: Top 15 enriched GO BP terms are showed in the bar plot of each disease state in each tissue. Each row represents a significant GO biological process which is colored according to the -log10(p.adjust).
ColorectumMSSGO analysis - Figure of enriched GO biological processes: Top 15 enriched GO BP terms are showed in the bar plot of each disease state in each tissue. Each row represents a significant GO biological process which is colored according to the -log10(p.adjust).
ColorectumMSI-HGO analysis - Figure of enriched GO biological processes: Top 15 enriched GO BP terms are showed in the bar plot of each disease state in each tissue. Each row represents a significant GO biological process which is colored according to the -log10(p.adjust).
ColorectumFAPGO analysis - Figure of enriched GO biological processes: Top 15 enriched GO BP terms are showed in the bar plot of each disease state in each tissue. Each row represents a significant GO biological process which is colored according to the -log10(p.adjust).
∗Top 15 enriched GO BP terms are showed in the bar plot of each disease state in each tissue. Each row represents a significant GO biological process which is colored according to the -log10(p.adjust).
Page: 1 2 3 4 5 6 7 8 9 

check button Enriched GO biological processes.
GO IDTissueDisease StageDescriptionGene RatioBg Ratiopvaluep.adjustCount
GO:000020916EsophagusHGINprotein polyubiquitination58/2587236/187236.29e-061.97e-0458
GO:00070328EsophagusHGINendosome organization25/258782/187237.45e-051.69e-0325
GO:00160509EsophagusHGINvesicle organization65/2587300/187231.24e-042.54e-0365
GO:00709794EsophagusHGINprotein K11-linked ubiquitination11/258729/187231.08e-031.32e-0211
GO:000961517EsophagusHGINresponse to virus69/2587367/187234.39e-033.86e-0269
GO:00324794EsophagusHGINregulation of type I interferon production23/258795/187234.51e-033.93e-0223
GO:00326064EsophagusHGINtype I interferon production23/258795/187234.51e-033.93e-0223
GO:00028325EsophagusHGINnegative regulation of response to biotic stimulus25/2587108/187235.87e-034.77e-0225
GO:001605014EsophagusESCCvesicle organization211/8552300/187232.85e-182.87e-16211
GO:000020917EsophagusESCCprotein polyubiquitination170/8552236/187231.40e-161.09e-14170
GO:000961518EsophagusESCCresponse to virus238/8552367/187236.65e-143.32e-12238
GO:00516075EsophagusESCCdefense response to virus171/8552265/187233.91e-101.05e-08171
GO:01405465EsophagusESCCdefense response to symbiont171/8552265/187233.91e-101.05e-08171
GO:007097912EsophagusESCCprotein K11-linked ubiquitination27/855229/187238.09e-081.39e-0627
GO:000703214EsophagusESCCendosome organization61/855282/187231.13e-071.85e-0661
GO:00028318EsophagusESCCregulation of response to biotic stimulus191/8552327/187232.12e-062.45e-05191
GO:000283212EsophagusESCCnegative regulation of response to biotic stimulus72/8552108/187238.36e-068.11e-0572
GO:003247912EsophagusESCCregulation of type I interferon production61/855295/187232.05e-041.29e-0361
GO:003260612EsophagusESCCtype I interferon production61/855295/187232.05e-041.29e-0361
GO:00507775EsophagusESCCnegative regulation of immune response112/8552194/187234.67e-042.62e-03112
Page: 1 2 3 4 5 

check button Enriched KEGG pathways.
Pathway IDTissueDisease StageDescriptionGene RatioBg Ratiopvaluep.adjustqvalueCount
Page: 1 

Top

Cell-cell communication analysis

check buttonIdentification of potential cell-cell interactions between two cell types and their ligand-receptor pairs for different disease states
LigandReceptorLRpairPathwayTissueDisease Stage
Page: 1 

Top

Single-cell gene regulatory network inference analysis

check buttonFind out the significant the regulons (TFs) and the target genes of each regulon across cell types for different disease states
TFCell TypeTissueDisease StageTarget GeneRSSRegulon Activity
∗The dot plots of a searched regulon are shown for all cell subpopulations in each disease state of each tissue based on the regulon specific score inferred using pySCENIC and by calculating the average expression.
Page: 1 

Top

Somatic mutation of malignant transformation related genes

check buttonAnnotation of somatic variants for genes involved in malignant transformation
Hugo SymbolVariant ClassVariant ClassificationdbSNP RSHGVScHGVSpHGVSp ShortSWISSPROTBIOTYPESIFTPolyPhenTumor Sample BarcodeTissueHistologySexAgeStageTherapy TypesDrugsOutcome
RNF26insertionIn_Frame_Insnovelc.207_208insACTACATCTTCCATTAGAAAATACTGCAAGGATAGGp.Ile69_Glu70insThrThrSerSerIleArgLysTyrCysLysAspArgp.I69_E70insTTSSIRKYCKDRQ9BY78protein_codingTCGA-AN-A0FN-01Breastbreast invasive carcinomaFemale<65I/IIUnknownUnknownSD
RNF26insertionIn_Frame_Insnovelc.836_837insGCCCCTGACAGGTGTp.Arg279_Leu280insProLeuThrGlyValp.R279_L280insPLTGVQ9BY78protein_codingTCGA-BH-A0E1-01Breastbreast invasive carcinomaFemale<65I/IIChemotherapycytoxanSD
RNF26SNVMissense_Mutationc.982N>Tp.Leu328Phep.L328FQ9BY78protein_codingtolerated(0.45)benign(0.355)TCGA-EA-A44S-01Cervixcervical & endocervical cancerFemale<65III/IVChemotherapycarboplatinSD
RNF26SNVMissense_Mutationc.1289N>Cp.Asn430Thrp.N430TQ9BY78protein_codingdeleterious(0)possibly_damaging(0.867)TCGA-FU-A3HZ-01Cervixcervical & endocervical cancerFemale<65I/IIChemotherapycisplatinCR
RNF26SNVMissense_Mutationrs752881562c.391N>Tp.Arg131Cysp.R131CQ9BY78protein_codingdeleterious(0)possibly_damaging(0.886)TCGA-AD-5900-01Colorectumcolon adenocarcinomaMale>=65I/IIUnknownUnknownSD
RNF26SNVMissense_Mutationrs867631795c.217N>Ap.Val73Ilep.V73IQ9BY78protein_codingtolerated(0.26)benign(0)TCGA-AD-6895-01Colorectumcolon adenocarcinomaMale>=65III/IVUnknownUnknownSD
RNF26SNVMissense_Mutationc.175C>Tp.Arg59Cysp.R59CQ9BY78protein_codingdeleterious(0.03)possibly_damaging(0.854)TCGA-QG-A5Z1-01Colorectumcolon adenocarcinomaMale>=65III/IVUnspecificComplete Response
RNF26SNVMissense_Mutationrs771435796c.652N>Tp.Arg218Cysp.R218CQ9BY78protein_codingdeleterious(0.04)possibly_damaging(0.549)TCGA-WS-AB45-01Colorectumcolon adenocarcinomaFemale<65I/IIUnknownUnknownSD
RNF26SNVMissense_Mutationrs775259101c.310G>Ap.Ala104Thrp.A104TQ9BY78protein_codingtolerated(0.23)benign(0.145)TCGA-EI-6917-01Colorectumrectum adenocarcinomaMale<65III/IVChemotherapy5fluorouracil+oxaciplatina+l-folinianSD
RNF26SNVMissense_Mutationrs201098751c.472G>Ap.Gly158Serp.G158SQ9BY78protein_codingtolerated(0.07)benign(0.069)TCGA-A5-A0G1-01Endometriumuterine corpus endometrioid carcinomaFemale>=65I/IIUnknownUnknownSD
Page: 1 2 3 4 

Top

Related drugs of malignant transformation related genes

check buttonIdentification of chemicals and drugs interact with genes involved in malignant transfromation
(DGIdb 4.0)
Entrez IDSymbolCategoryInteraction TypesDrug Claim NameDrug NamePMIDs
Page: 1