
|
|||||
|
 | |
| |
| |
| |
| |
| |
|
Gene: RNF24 |
Gene summary for RNF24 |
| Gene information | Species | Human | Gene symbol | RNF24 | Gene ID | 11237 |
| Gene name | ring finger protein 24 | |
| Gene Alias | G1L | |
| Cytomap | 20p13 | |
| Gene Type | protein-coding | GO ID | GO:0006464 | UniProtAcc | Q9Y225 |
Top |
Malignant transformation analysis |
| Identification of the aberrant gene expression in precancerous and cancerous lesions by comparing the gene expression of stem-like cells in diseased tissues with normal stem cells |
| Entrez ID | Symbol | Replicates | Species | Organ | Tissue | Adj P-value | Log2FC | Malignancy |
| 11237 | RNF24 | LZE2T | Human | Esophagus | ESCC | 4.47e-04 | 3.22e-01 | 0.082 |
| 11237 | RNF24 | LZE4T | Human | Esophagus | ESCC | 3.56e-09 | 1.46e-01 | 0.0811 |
| 11237 | RNF24 | LZE7T | Human | Esophagus | ESCC | 2.51e-02 | 3.31e-02 | 0.0667 |
| 11237 | RNF24 | LZE20T | Human | Esophagus | ESCC | 2.03e-03 | -3.60e-02 | 0.0662 |
| 11237 | RNF24 | LZE24T | Human | Esophagus | ESCC | 4.23e-02 | 9.54e-02 | 0.0596 |
| 11237 | RNF24 | P1T-E | Human | Esophagus | ESCC | 3.91e-03 | 1.69e-01 | 0.0875 |
| 11237 | RNF24 | P2T-E | Human | Esophagus | ESCC | 1.13e-41 | 6.67e-01 | 0.1177 |
| 11237 | RNF24 | P4T-E | Human | Esophagus | ESCC | 7.61e-15 | 3.05e-01 | 0.1323 |
| 11237 | RNF24 | P5T-E | Human | Esophagus | ESCC | 3.54e-12 | -4.02e-03 | 0.1327 |
| 11237 | RNF24 | P8T-E | Human | Esophagus | ESCC | 2.06e-12 | 3.50e-01 | 0.0889 |
| 11237 | RNF24 | P9T-E | Human | Esophagus | ESCC | 2.10e-16 | 3.67e-01 | 0.1131 |
| 11237 | RNF24 | P10T-E | Human | Esophagus | ESCC | 2.06e-28 | 5.78e-01 | 0.116 |
| 11237 | RNF24 | P11T-E | Human | Esophagus | ESCC | 9.85e-15 | 2.32e-01 | 0.1426 |
| 11237 | RNF24 | P12T-E | Human | Esophagus | ESCC | 2.16e-27 | 4.52e-01 | 0.1122 |
| 11237 | RNF24 | P15T-E | Human | Esophagus | ESCC | 9.25e-27 | 6.75e-01 | 0.1149 |
| 11237 | RNF24 | P16T-E | Human | Esophagus | ESCC | 5.19e-59 | 1.18e+00 | 0.1153 |
| 11237 | RNF24 | P17T-E | Human | Esophagus | ESCC | 6.56e-04 | 5.02e-01 | 0.1278 |
| 11237 | RNF24 | P19T-E | Human | Esophagus | ESCC | 1.22e-06 | 2.91e-01 | 0.1662 |
| 11237 | RNF24 | P20T-E | Human | Esophagus | ESCC | 1.08e-05 | 6.45e-02 | 0.1124 |
| 11237 | RNF24 | P21T-E | Human | Esophagus | ESCC | 1.04e-23 | 2.44e-01 | 0.1617 |
| Page: 1 2 3 4 5 |
| Tissue | Expression Dynamics | Abbreviation |
| Esophagus | 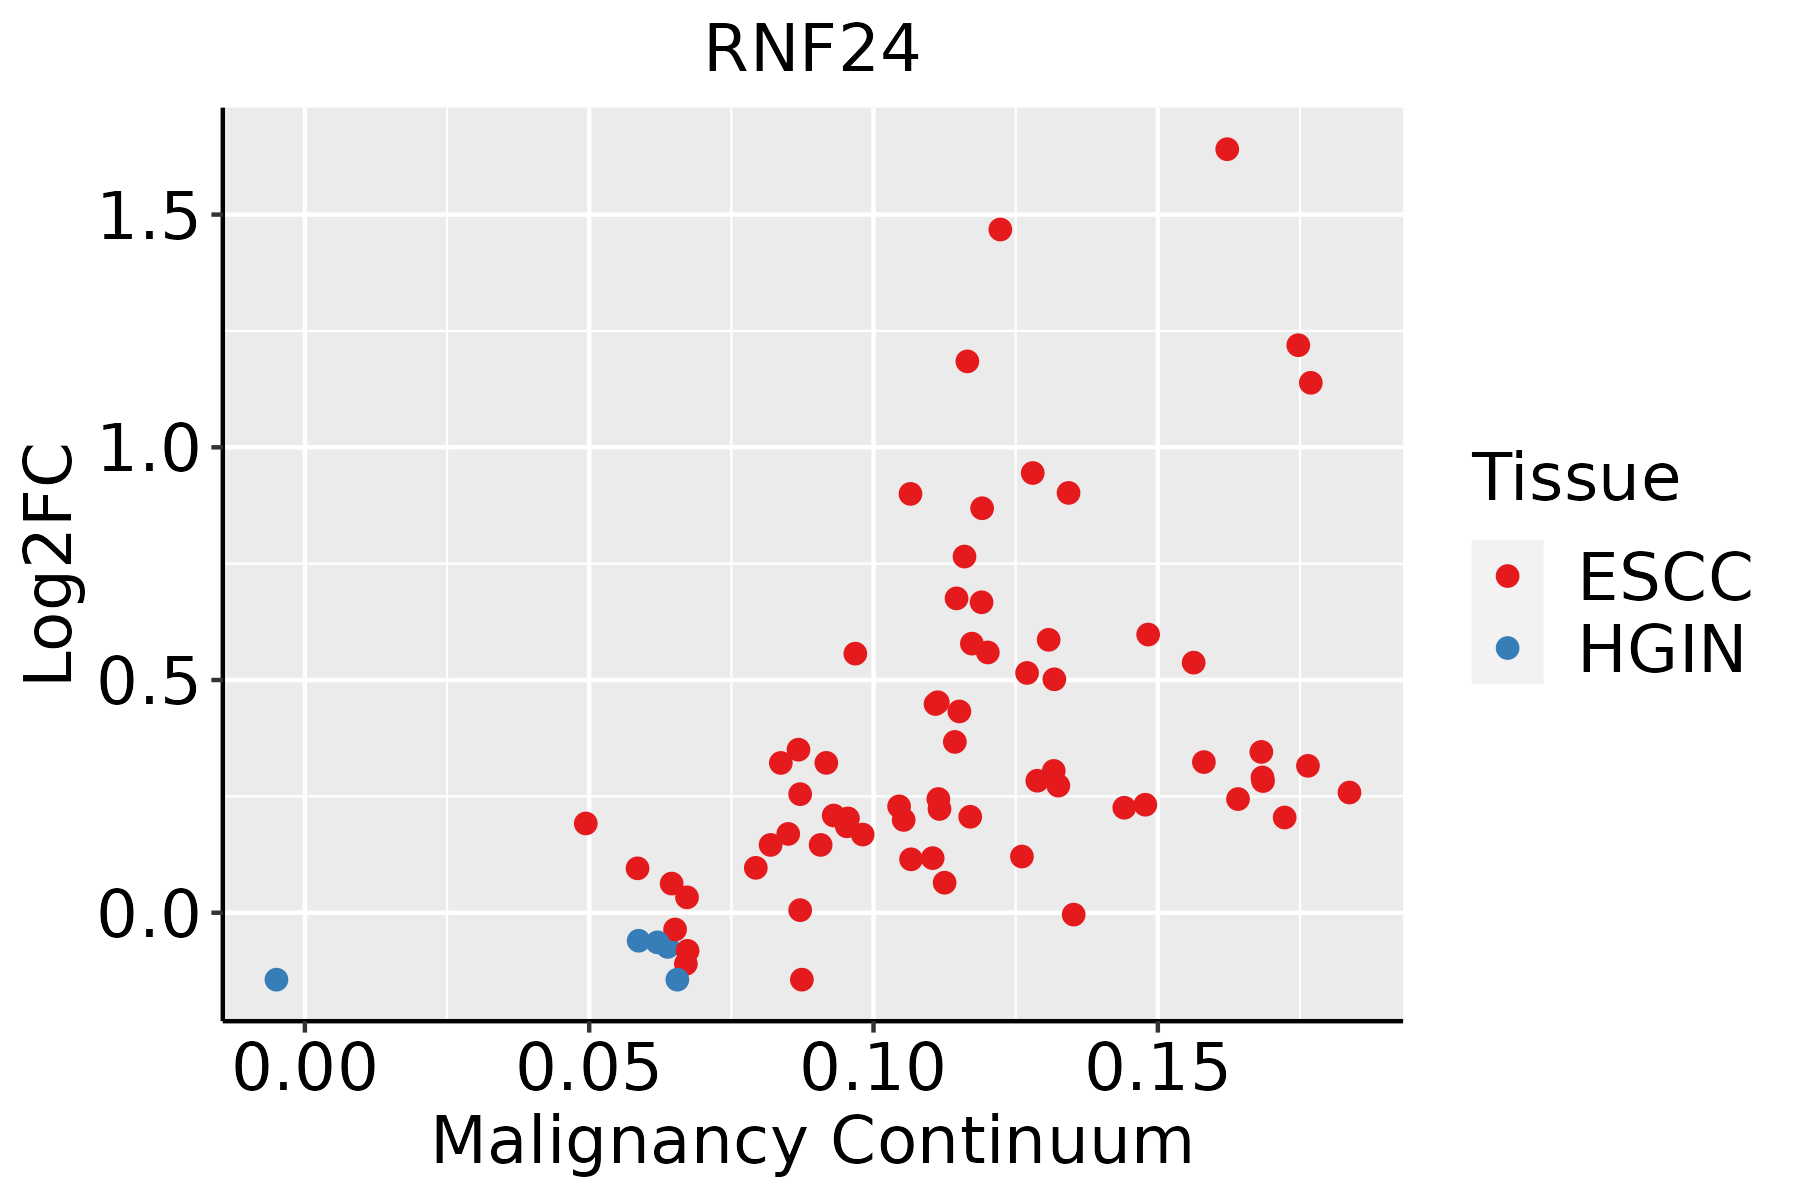 | ESCC: Esophageal squamous cell carcinoma |
| HGIN: High-grade intraepithelial neoplasias | ||
| LGIN: Low-grade intraepithelial neoplasias | ||
| Lung | 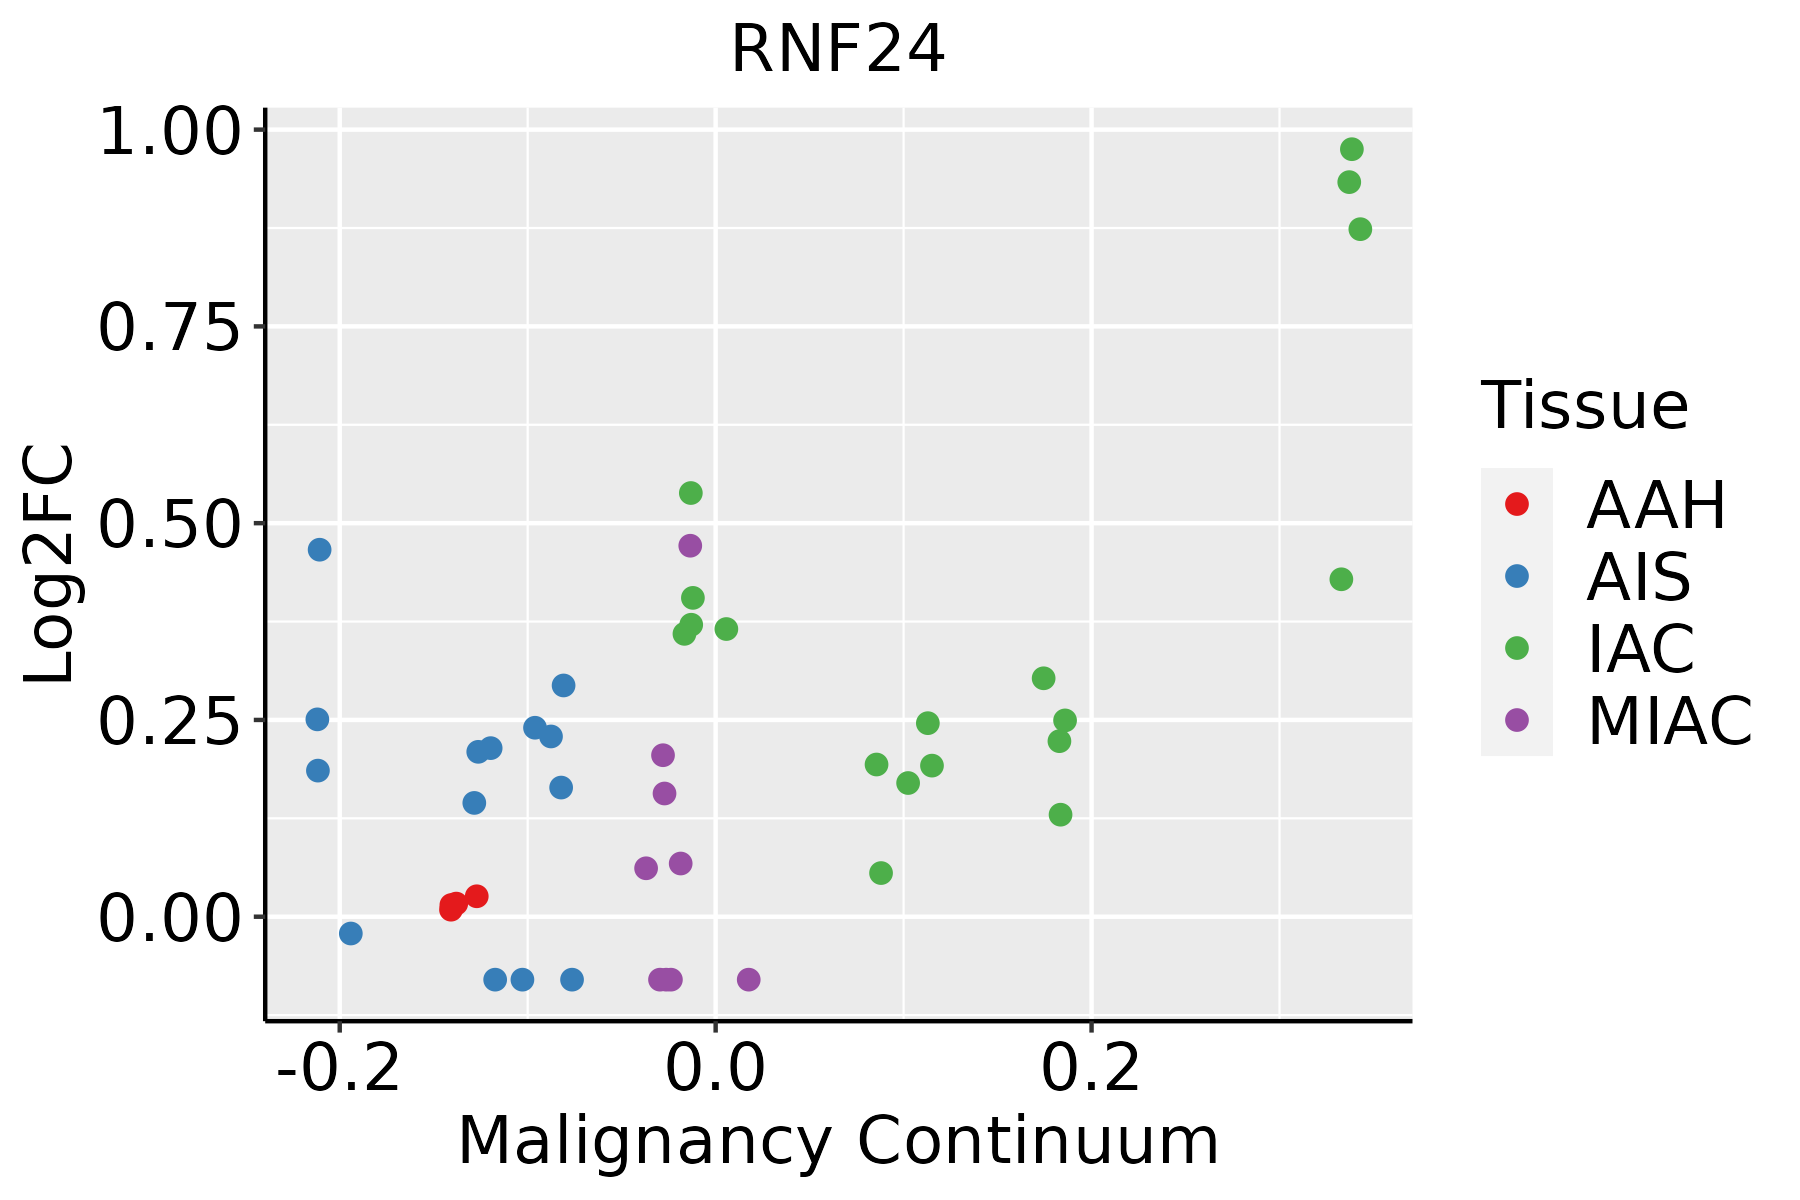 | AAH: Atypical adenomatous hyperplasia |
| AIS: Adenocarcinoma in situ | ||
| IAC: Invasive lung adenocarcinoma | ||
| MIA: Minimally invasive adenocarcinoma | ||
| Oral Cavity | 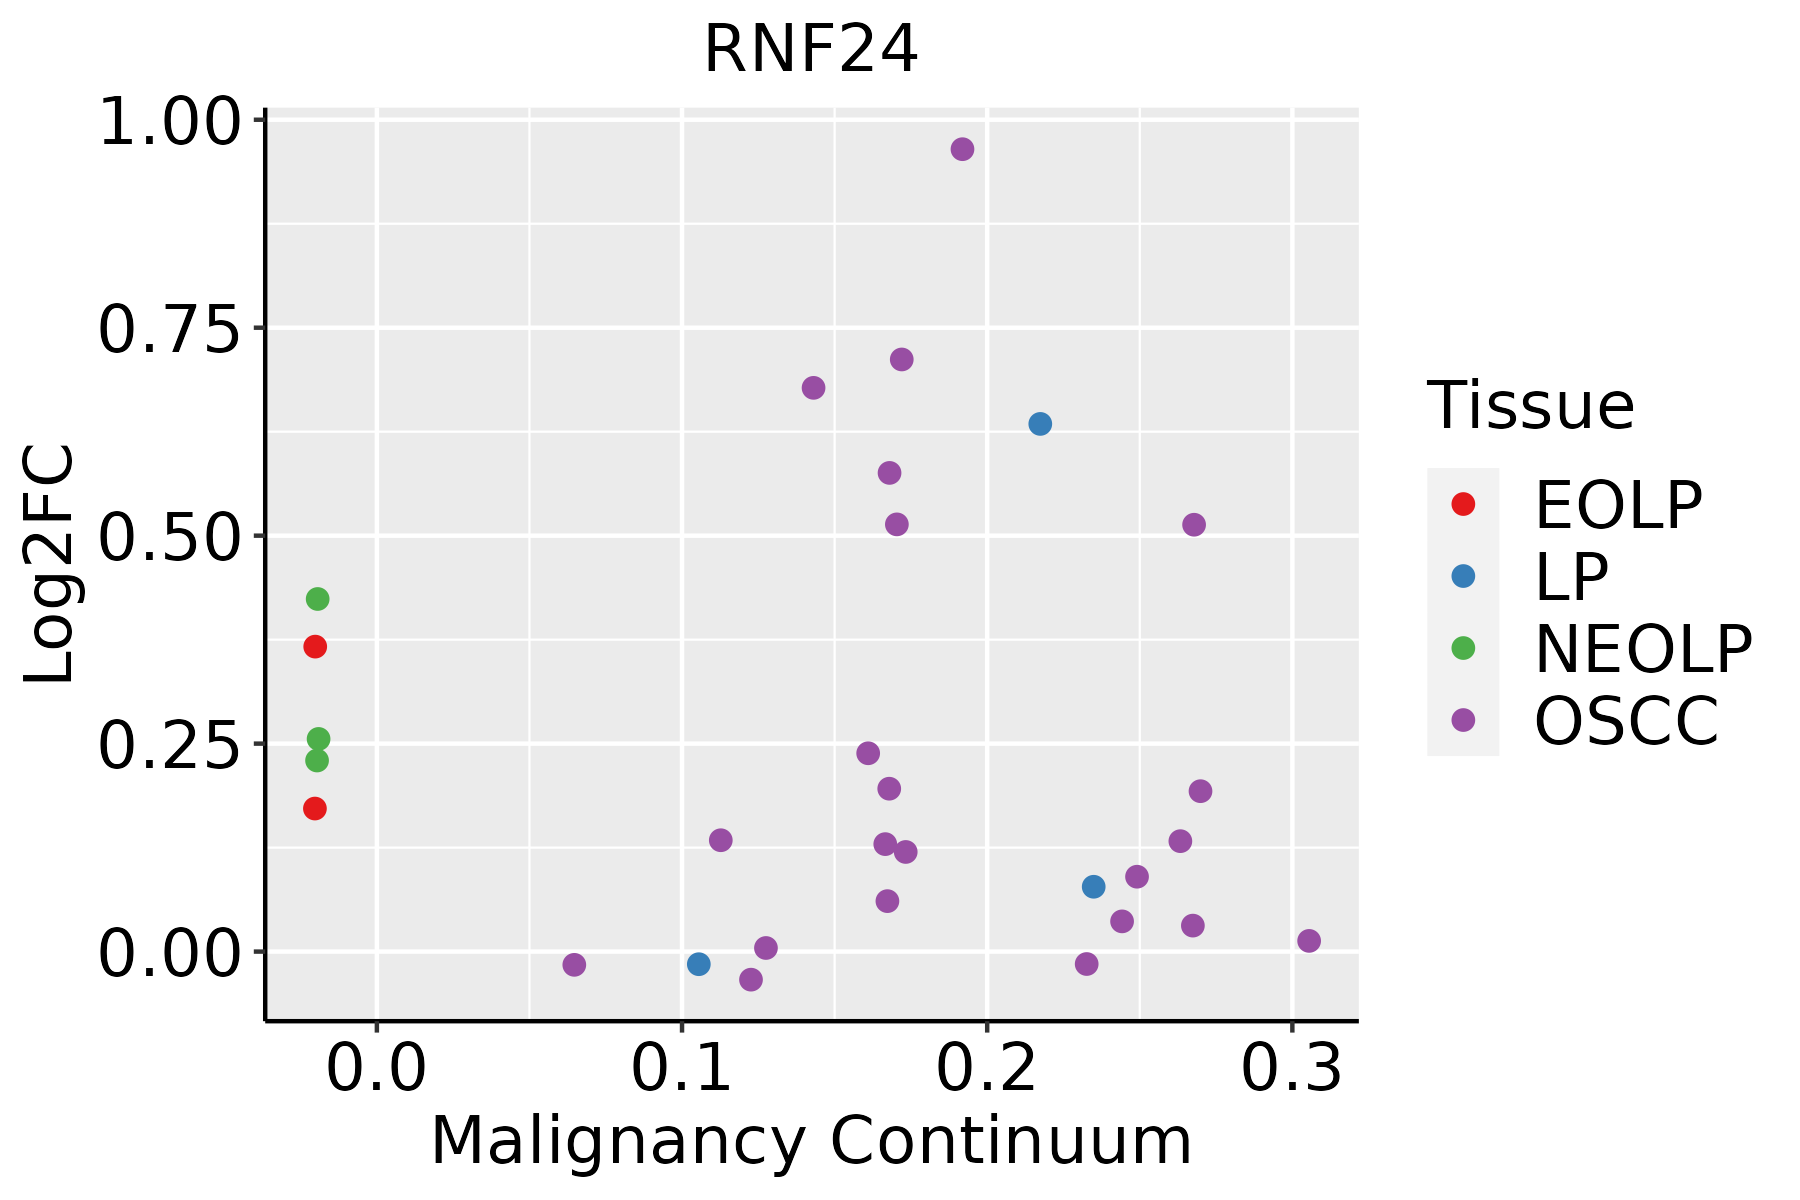 | EOLP: Erosive Oral lichen planus |
| LP: leukoplakia | ||
| NEOLP: Non-erosive oral lichen planus | ||
| OSCC: Oral squamous cell carcinoma | ||
| Thyroid | 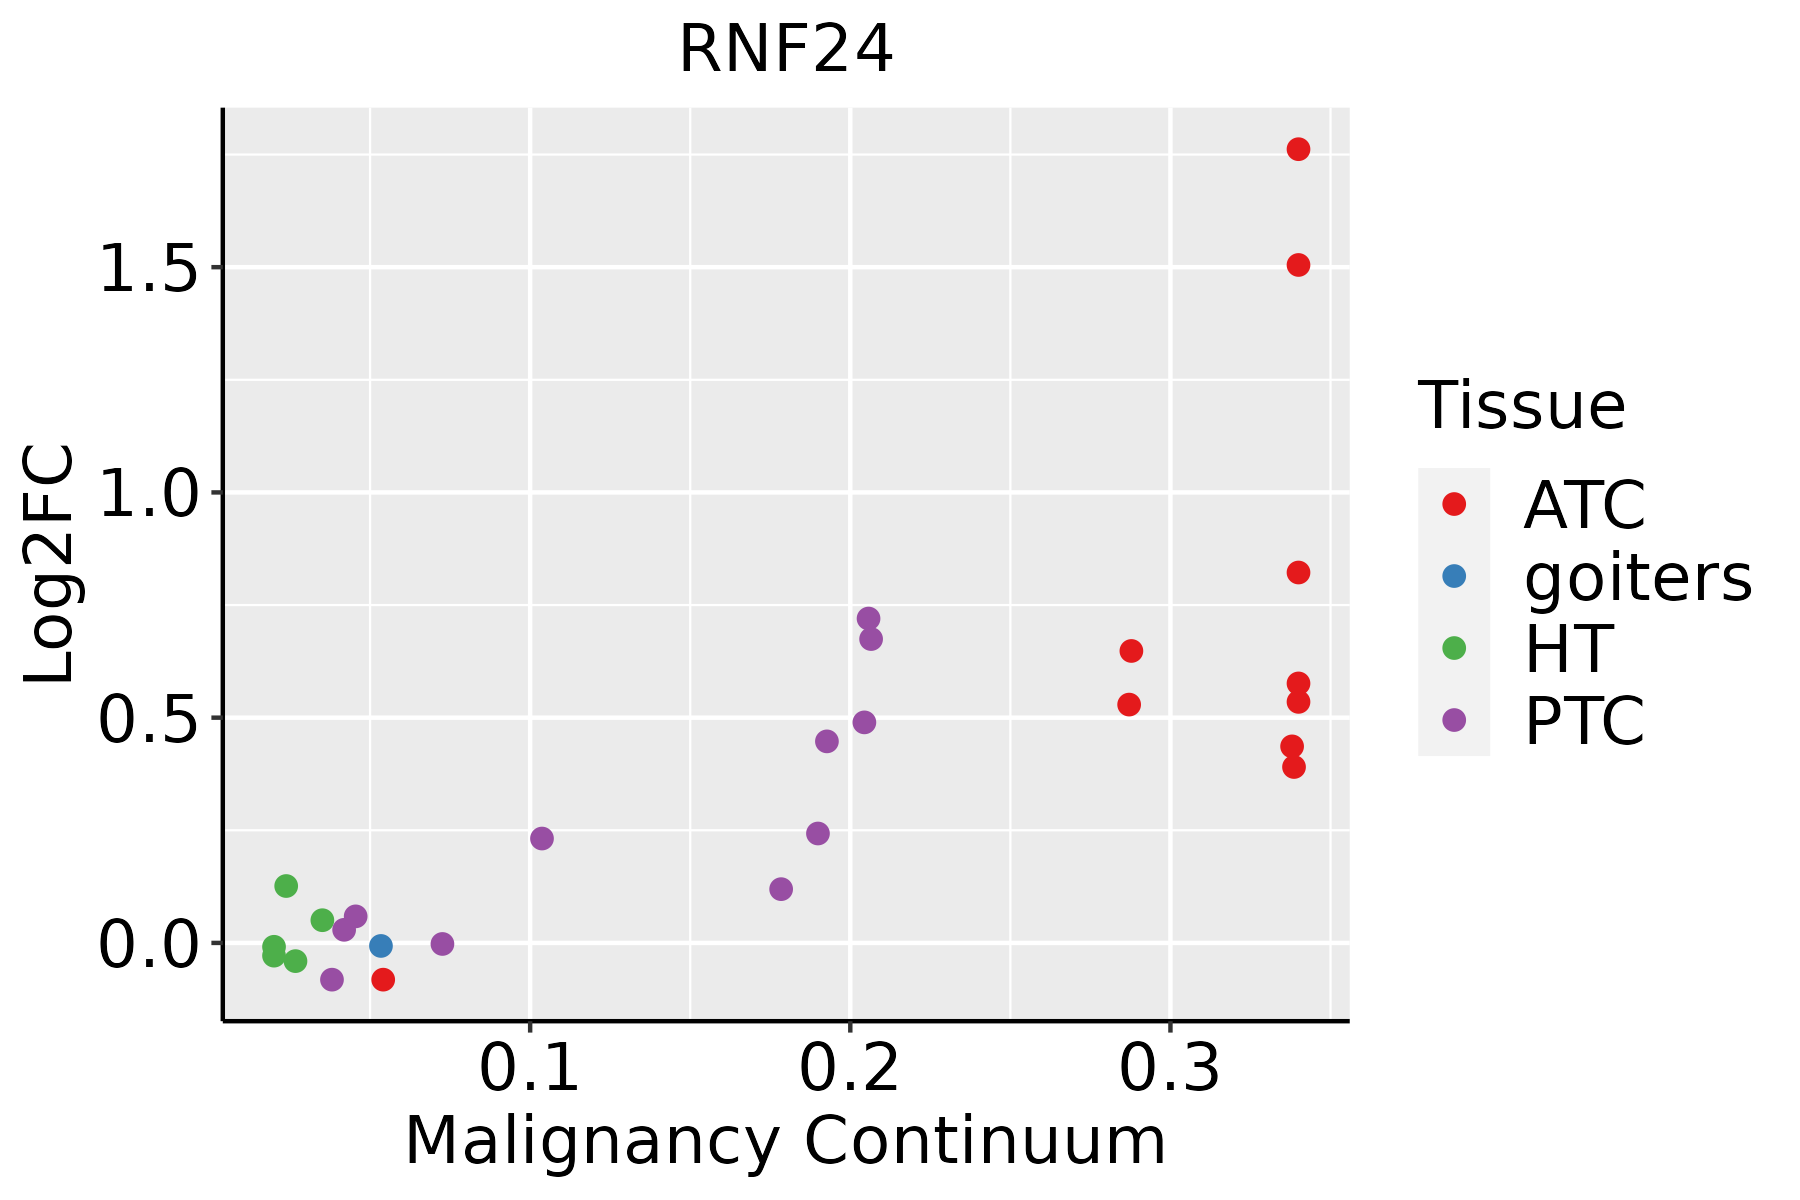 | ATC: Anaplastic thyroid cancer |
| HT: Hashimoto's thyroiditis | ||
| PTC: Papillary thyroid cancer |
| ∗log2FC in expression of this searched gene in stem-like cells from each diseased tissue sample relative to stem-like cells in normal samples in each tissue plotted against the malignancy continuum. Samples are colored based on if they are from different disease stage. |
Top |
Malignant transformation related pathway analysis |
| Find out the enriched GO biological processes and KEGG pathways involved in transition from healthy to precancer to cancer |
| Tissue | Disease Stage | Enriched GO biological Processes |
| Colorectum | AD |  |
| Colorectum | SER |  |
| Colorectum | MSS |  |
| Colorectum | MSI-H |  |
| Colorectum | FAP |  |
| ∗Top 15 enriched GO BP terms are showed in the bar plot of each disease state in each tissue. Each row represents a significant GO biological process which is colored according to the -log10(p.adjust). |
| Page: 1 2 3 4 5 6 7 8 9 |
| GO ID | Tissue | Disease Stage | Description | Gene Ratio | Bg Ratio | pvalue | p.adjust | Count |
| Page: 1 |
| Pathway ID | Tissue | Disease Stage | Description | Gene Ratio | Bg Ratio | pvalue | p.adjust | qvalue | Count |
| Page: 1 |
Top |
Cell-cell communication analysis |
| Identification of potential cell-cell interactions between two cell types and their ligand-receptor pairs for different disease states |
| Ligand | Receptor | LRpair | Pathway | Tissue | Disease Stage |
| Page: 1 |
Top |
Single-cell gene regulatory network inference analysis |
| Find out the significant the regulons (TFs) and the target genes of each regulon across cell types for different disease states |
| TF | Cell Type | Tissue | Disease Stage | Target Gene | RSS | Regulon Activity |
| ∗The dot plots of a searched regulon are shown for all cell subpopulations in each disease state of each tissue based on the regulon specific score inferred using pySCENIC and by calculating the average expression. |
| Page: 1 |
Top |
Somatic mutation of malignant transformation related genes |
| Annotation of somatic variants for genes involved in malignant transformation |
| Hugo Symbol | Variant Class | Variant Classification | dbSNP RS | HGVSc | HGVSp | HGVSp Short | SWISSPROT | BIOTYPE | SIFT | PolyPhen | Tumor Sample Barcode | Tissue | Histology | Sex | Age | Stage | Therapy Types | Drugs | Outcome |
| RNF24 | SNV | Missense_Mutation | c.59C>T | p.Ser20Leu | p.S20L | Q9Y225 | protein_coding | tolerated_low_confidence(0.89) | benign(0) | TCGA-A7-A26G-01 | Breast | breast invasive carcinoma | Female | <65 | I/II | Chemotherapy | taxotere | SD | |
| RNF24 | SNV | Missense_Mutation | c.467N>A | p.Gly156Glu | p.G156E | Q9Y225 | protein_coding | tolerated(0.61) | benign(0.415) | TCGA-A6-2686-01 | Colorectum | colon adenocarcinoma | Female | >=65 | I/II | Unknown | Unknown | SD | |
| RNF24 | SNV | Missense_Mutation | rs866284128 | c.397C>T | p.Arg133Cys | p.R133C | Q9Y225 | protein_coding | deleterious(0) | probably_damaging(0.931) | TCGA-AA-3984-01 | Colorectum | colon adenocarcinoma | Female | <65 | I/II | Unknown | Unknown | SD |
| RNF24 | SNV | Missense_Mutation | c.174N>G | p.Ile58Met | p.I58M | Q9Y225 | protein_coding | tolerated(0.33) | benign(0.135) | TCGA-EI-6508-01 | Colorectum | rectum adenocarcinoma | Female | <65 | III/IV | Chemotherapy | oxaliplatin | SD | |
| RNF24 | SNV | Missense_Mutation | novel | c.374N>A | p.Cys125Tyr | p.C125Y | Q9Y225 | protein_coding | deleterious(0) | probably_damaging(0.992) | TCGA-AX-A06F-01 | Endometrium | uterine corpus endometrioid carcinoma | Female | <65 | III/IV | Chemotherapy | carboplatin | SD |
| RNF24 | SNV | Missense_Mutation | rs772261593 | c.201N>C | p.Leu67Phe | p.L67F | Q9Y225 | protein_coding | tolerated(0.27) | benign(0.224) | TCGA-AX-A2IO-01 | Endometrium | uterine corpus endometrioid carcinoma | Female | >=65 | I/II | Chemotherapy | carboplatin | SD |
| RNF24 | SNV | Missense_Mutation | novel | c.100C>T | p.Pro34Ser | p.P34S | Q9Y225 | protein_coding | tolerated_low_confidence(0.08) | benign(0.143) | TCGA-BG-A2L7-01 | Endometrium | uterine corpus endometrioid carcinoma | Female | >=65 | I/II | Chemotherapy | carboplatin | CR |
| RNF24 | SNV | Missense_Mutation | c.430N>A | p.Leu144Ile | p.L144I | Q9Y225 | protein_coding | tolerated(0.54) | benign(0.098) | TCGA-D1-A17Q-01 | Endometrium | uterine corpus endometrioid carcinoma | Female | <65 | I/II | Unknown | Unknown | SD | |
| RNF24 | SNV | Missense_Mutation | novel | c.206N>T | p.Arg69Met | p.R69M | Q9Y225 | protein_coding | deleterious(0) | probably_damaging(0.991) | TCGA-EY-A1GK-01 | Endometrium | uterine corpus endometrioid carcinoma | Female | >=65 | I/II | Unknown | Unknown | SD |
| RNF24 | SNV | Missense_Mutation | c.409C>T | p.Pro137Ser | p.P137S | Q9Y225 | protein_coding | deleterious(0.03) | possibly_damaging(0.839) | TCGA-78-7220-01 | Lung | lung adenocarcinoma | Female | <65 | III/IV | Unknown | Unknown | PD |
| Page: 1 2 |
Top |
Related drugs of malignant transformation related genes |
| Identification of chemicals and drugs interact with genes involved in malignant transfromation |
| (DGIdb 4.0) |
| Entrez ID | Symbol | Category | Interaction Types | Drug Claim Name | Drug Name | PMIDs |
| Page: 1 |

Copyright 2023-Present -The University of Texas Health Science Center at Houston |