
|
|||||
|
 | |
| |
| |
| |
| |
| |
|
Gene: RNF219 |
Gene summary for RNF219 |
| Gene information | Species | Human | Gene symbol | RNF219 | Gene ID | 79596 |
| Gene name | ORC ubiquitin ligase 1 | |
| Gene Alias | C13orf7 | |
| Cytomap | 13q31.1 | |
| Gene Type | protein-coding | GO ID | GO:0006260 | UniProtAcc | Q5W0B1 |
Top |
Malignant transformation analysis |
| Identification of the aberrant gene expression in precancerous and cancerous lesions by comparing the gene expression of stem-like cells in diseased tissues with normal stem cells |
| Entrez ID | Symbol | Replicates | Species | Organ | Tissue | Adj P-value | Log2FC | Malignancy |
| 79596 | RNF219 | P2T-E | Human | Esophagus | ESCC | 1.26e-13 | 3.23e-01 | 0.1177 |
| 79596 | RNF219 | P4T-E | Human | Esophagus | ESCC | 4.07e-09 | 2.37e-01 | 0.1323 |
| 79596 | RNF219 | P5T-E | Human | Esophagus | ESCC | 2.53e-03 | 1.03e-01 | 0.1327 |
| 79596 | RNF219 | P8T-E | Human | Esophagus | ESCC | 2.15e-14 | 2.83e-01 | 0.0889 |
| 79596 | RNF219 | P10T-E | Human | Esophagus | ESCC | 5.32e-12 | 2.78e-01 | 0.116 |
| 79596 | RNF219 | P11T-E | Human | Esophagus | ESCC | 2.25e-07 | 2.36e-01 | 0.1426 |
| 79596 | RNF219 | P12T-E | Human | Esophagus | ESCC | 6.57e-08 | 2.22e-01 | 0.1122 |
| 79596 | RNF219 | P15T-E | Human | Esophagus | ESCC | 2.62e-08 | 1.90e-01 | 0.1149 |
| 79596 | RNF219 | P16T-E | Human | Esophagus | ESCC | 4.66e-15 | 2.41e-01 | 0.1153 |
| 79596 | RNF219 | P17T-E | Human | Esophagus | ESCC | 3.93e-09 | 3.85e-01 | 0.1278 |
| 79596 | RNF219 | P20T-E | Human | Esophagus | ESCC | 6.61e-08 | 2.08e-01 | 0.1124 |
| 79596 | RNF219 | P21T-E | Human | Esophagus | ESCC | 1.55e-04 | 1.41e-01 | 0.1617 |
| 79596 | RNF219 | P22T-E | Human | Esophagus | ESCC | 2.52e-07 | 1.76e-01 | 0.1236 |
| 79596 | RNF219 | P23T-E | Human | Esophagus | ESCC | 3.09e-04 | 1.63e-01 | 0.108 |
| 79596 | RNF219 | P24T-E | Human | Esophagus | ESCC | 1.24e-05 | 1.29e-01 | 0.1287 |
| 79596 | RNF219 | P26T-E | Human | Esophagus | ESCC | 1.54e-11 | 2.74e-01 | 0.1276 |
| 79596 | RNF219 | P27T-E | Human | Esophagus | ESCC | 1.00e-05 | 1.71e-01 | 0.1055 |
| 79596 | RNF219 | P28T-E | Human | Esophagus | ESCC | 2.11e-03 | 7.83e-02 | 0.1149 |
| 79596 | RNF219 | P30T-E | Human | Esophagus | ESCC | 1.01e-11 | 2.51e-01 | 0.137 |
| 79596 | RNF219 | P31T-E | Human | Esophagus | ESCC | 2.50e-05 | 9.72e-02 | 0.1251 |
| Page: 1 2 3 |
| Tissue | Expression Dynamics | Abbreviation |
| Esophagus | 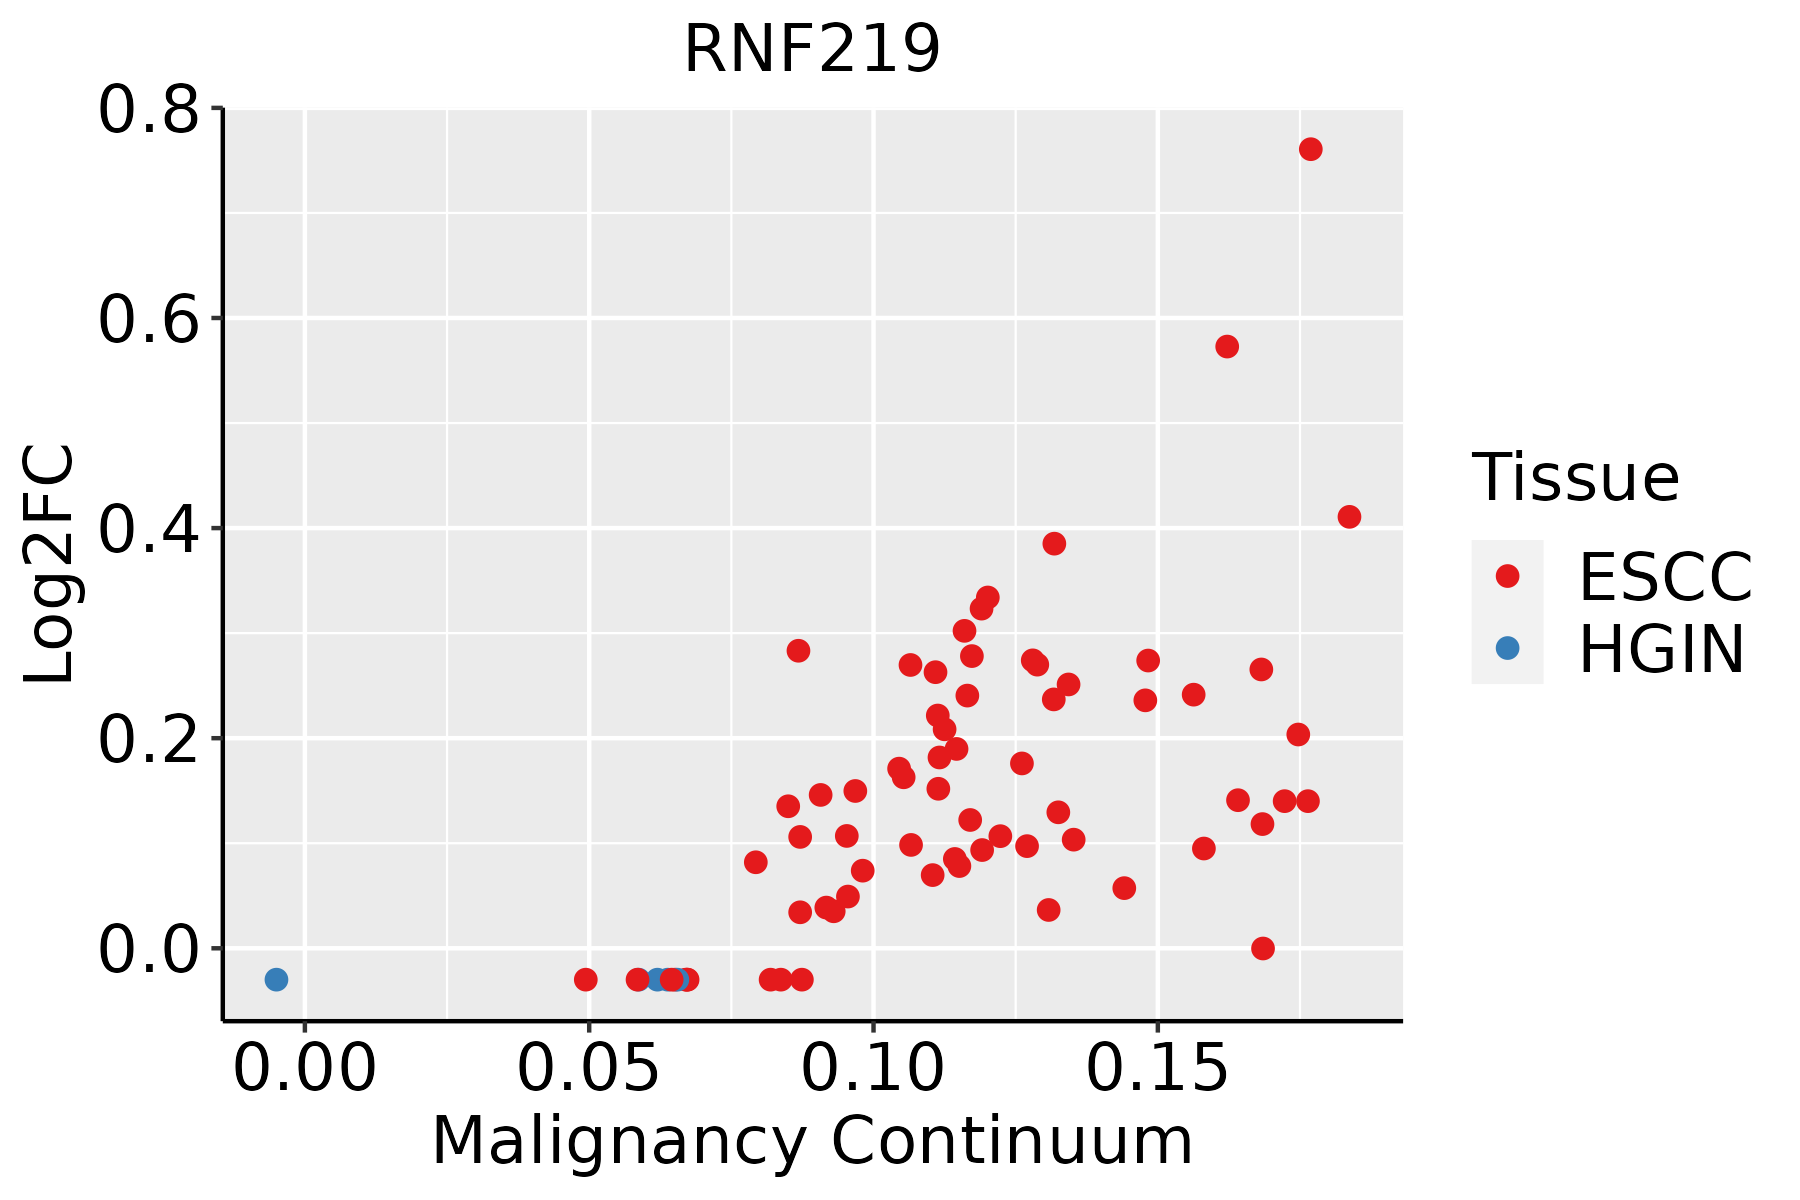 | ESCC: Esophageal squamous cell carcinoma |
| HGIN: High-grade intraepithelial neoplasias | ||
| LGIN: Low-grade intraepithelial neoplasias |
| ∗log2FC in expression of this searched gene in stem-like cells from each diseased tissue sample relative to stem-like cells in normal samples in each tissue plotted against the malignancy continuum. Samples are colored based on if they are from different disease stage. |
Top |
Malignant transformation related pathway analysis |
| Find out the enriched GO biological processes and KEGG pathways involved in transition from healthy to precancer to cancer |
| Tissue | Disease Stage | Enriched GO biological Processes |
| Colorectum | AD |  |
| Colorectum | SER |  |
| Colorectum | MSS |  |
| Colorectum | MSI-H |  |
| Colorectum | FAP |  |
| ∗Top 15 enriched GO BP terms are showed in the bar plot of each disease state in each tissue. Each row represents a significant GO biological process which is colored according to the -log10(p.adjust). |
| Page: 1 2 3 4 5 6 7 8 9 |
| GO ID | Tissue | Disease Stage | Description | Gene Ratio | Bg Ratio | pvalue | p.adjust | Count |
| Page: 1 |
| Pathway ID | Tissue | Disease Stage | Description | Gene Ratio | Bg Ratio | pvalue | p.adjust | qvalue | Count |
| Page: 1 |
Top |
Cell-cell communication analysis |
| Identification of potential cell-cell interactions between two cell types and their ligand-receptor pairs for different disease states |
| Ligand | Receptor | LRpair | Pathway | Tissue | Disease Stage |
| Page: 1 |
Top |
Single-cell gene regulatory network inference analysis |
| Find out the significant the regulons (TFs) and the target genes of each regulon across cell types for different disease states |
| TF | Cell Type | Tissue | Disease Stage | Target Gene | RSS | Regulon Activity |
| ∗The dot plots of a searched regulon are shown for all cell subpopulations in each disease state of each tissue based on the regulon specific score inferred using pySCENIC and by calculating the average expression. |
| Page: 1 |
Top |
Somatic mutation of malignant transformation related genes |
| Annotation of somatic variants for genes involved in malignant transformation |
| Hugo Symbol | Variant Class | Variant Classification | dbSNP RS | HGVSc | HGVSp | HGVSp Short | SWISSPROT | BIOTYPE | SIFT | PolyPhen | Tumor Sample Barcode | Tissue | Histology | Sex | Age | Stage | Therapy Types | Drugs | Outcome |
| RNF219 | SNV | Missense_Mutation | c.1614N>G | p.Ile538Met | p.I538M | Q5W0B1 | protein_coding | deleterious(0) | possibly_damaging(0.535) | TCGA-A8-A099-01 | Breast | breast invasive carcinoma | Female | >=65 | III/IV | Hormone Therapy | exemestane | SD | |
| RNF219 | SNV | Missense_Mutation | c.514N>C | p.Glu172Gln | p.E172Q | Q5W0B1 | protein_coding | deleterious(0.03) | probably_damaging(0.941) | TCGA-AC-A23H-01 | Breast | breast invasive carcinoma | Female | >=65 | I/II | Unknown | Unknown | PD | |
| RNF219 | SNV | Missense_Mutation | novel | c.226N>A | p.Glu76Lys | p.E76K | Q5W0B1 | protein_coding | tolerated(0.1) | benign(0.395) | TCGA-AC-A23H-01 | Breast | breast invasive carcinoma | Female | >=65 | I/II | Unknown | Unknown | PD |
| RNF219 | SNV | Missense_Mutation | c.1441N>C | p.Glu481Gln | p.E481Q | Q5W0B1 | protein_coding | tolerated(0.2) | benign(0.399) | TCGA-AN-A0FJ-01 | Breast | breast invasive carcinoma | Female | <65 | III/IV | Unknown | Unknown | SD | |
| RNF219 | SNV | Missense_Mutation | c.600A>C | p.Leu200Phe | p.L200F | Q5W0B1 | protein_coding | tolerated(0.12) | possibly_damaging(0.523) | TCGA-AO-A0JD-01 | Breast | breast invasive carcinoma | Female | <65 | III/IV | Chemotherapy | cyclophosphamide | SD | |
| RNF219 | SNV | Missense_Mutation | rs772512784 | c.2122N>G | p.Lys708Glu | p.K708E | Q5W0B1 | protein_coding | deleterious(0) | benign(0.019) | TCGA-BH-A0AV-01 | Breast | breast invasive carcinoma | Female | <65 | I/II | Chemotherapy | taxotere | CR |
| RNF219 | SNV | Missense_Mutation | rs778312965 | c.386N>T | p.Asp129Val | p.D129V | Q5W0B1 | protein_coding | deleterious(0.03) | benign(0.397) | TCGA-C8-A1HJ-01 | Breast | breast invasive carcinoma | Female | <65 | I/II | Unknown | Unknown | SD |
| RNF219 | SNV | Missense_Mutation | novel | c.2089N>C | p.Glu697Gln | p.E697Q | Q5W0B1 | protein_coding | deleterious(0) | possibly_damaging(0.601) | TCGA-UU-A93S-01 | Breast | breast invasive carcinoma | Female | <65 | III/IV | Unknown | Unknown | PD |
| RNF219 | insertion | Frame_Shift_Ins | novel | c.862_863insTTATTTTTGTGTTTTGGGGTTGGTTGGTTGG | p.Asp288ValfsTer20 | p.D288Vfs*20 | Q5W0B1 | protein_coding | TCGA-AN-A0G0-01 | Breast | breast invasive carcinoma | Female | <65 | I/II | Unknown | Unknown | SD | ||
| RNF219 | insertion | Frame_Shift_Ins | novel | c.1129_1130insTAATGAAATCAAA | p.Pro377LeufsTer9 | p.P377Lfs*9 | Q5W0B1 | protein_coding | TCGA-BH-A0HK-01 | Breast | breast invasive carcinoma | Female | >=65 | I/II | Hormone Therapy | arimidex | SD |
| Page: 1 2 3 4 5 6 7 8 9 10 |
Top |
Related drugs of malignant transformation related genes |
| Identification of chemicals and drugs interact with genes involved in malignant transfromation |
| (DGIdb 4.0) |
| Entrez ID | Symbol | Category | Interaction Types | Drug Claim Name | Drug Name | PMIDs |
| Page: 1 |

Copyright 2023-Present -The University of Texas Health Science Center at Houston |