| Tissue | Expression Dynamics | Abbreviation |
| Cervix | 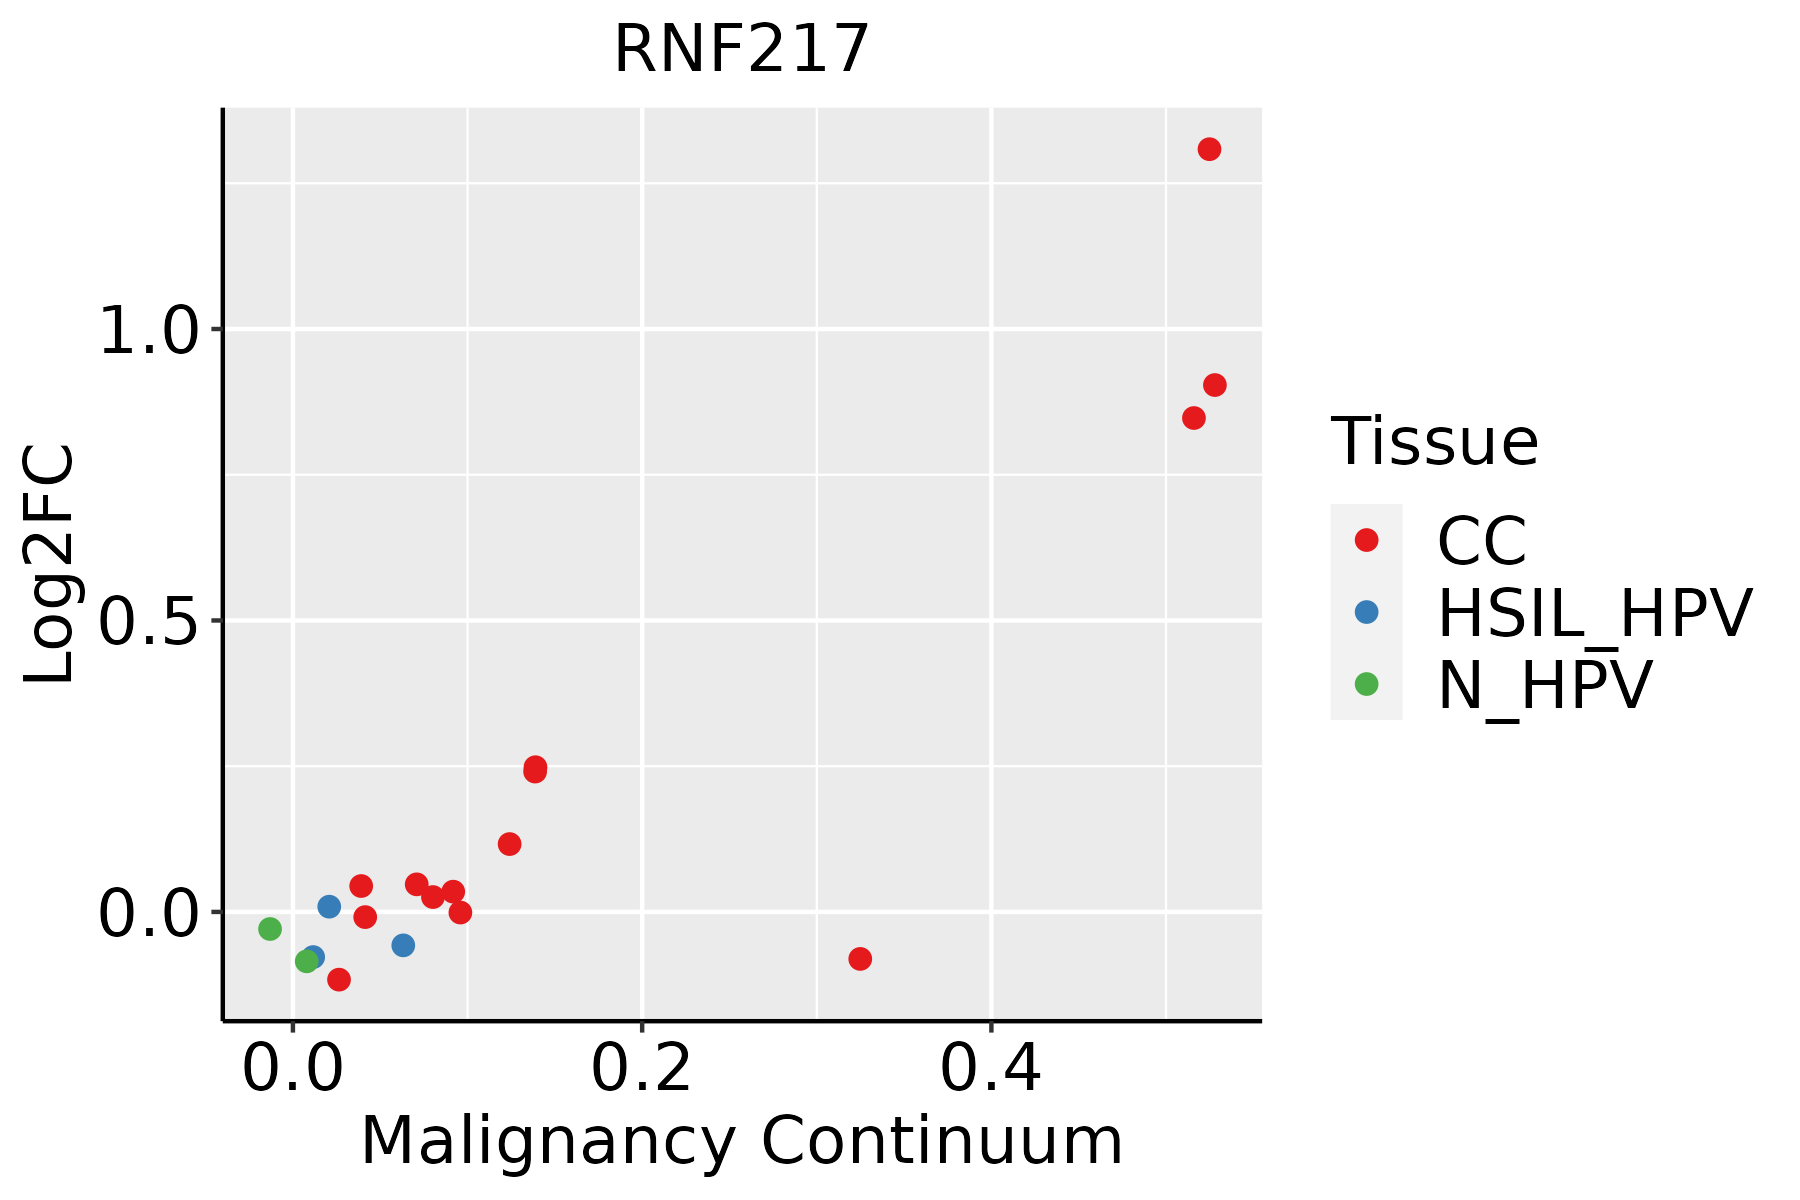 | CC: Cervix cancer |
| HSIL_HPV: HPV-infected high-grade squamous intraepithelial lesions |
| N_HPV: HPV-infected normal cervix |
| Esophagus |  | ESCC: Esophageal squamous cell carcinoma |
| HGIN: High-grade intraepithelial neoplasias |
| LGIN: Low-grade intraepithelial neoplasias |
| Liver | 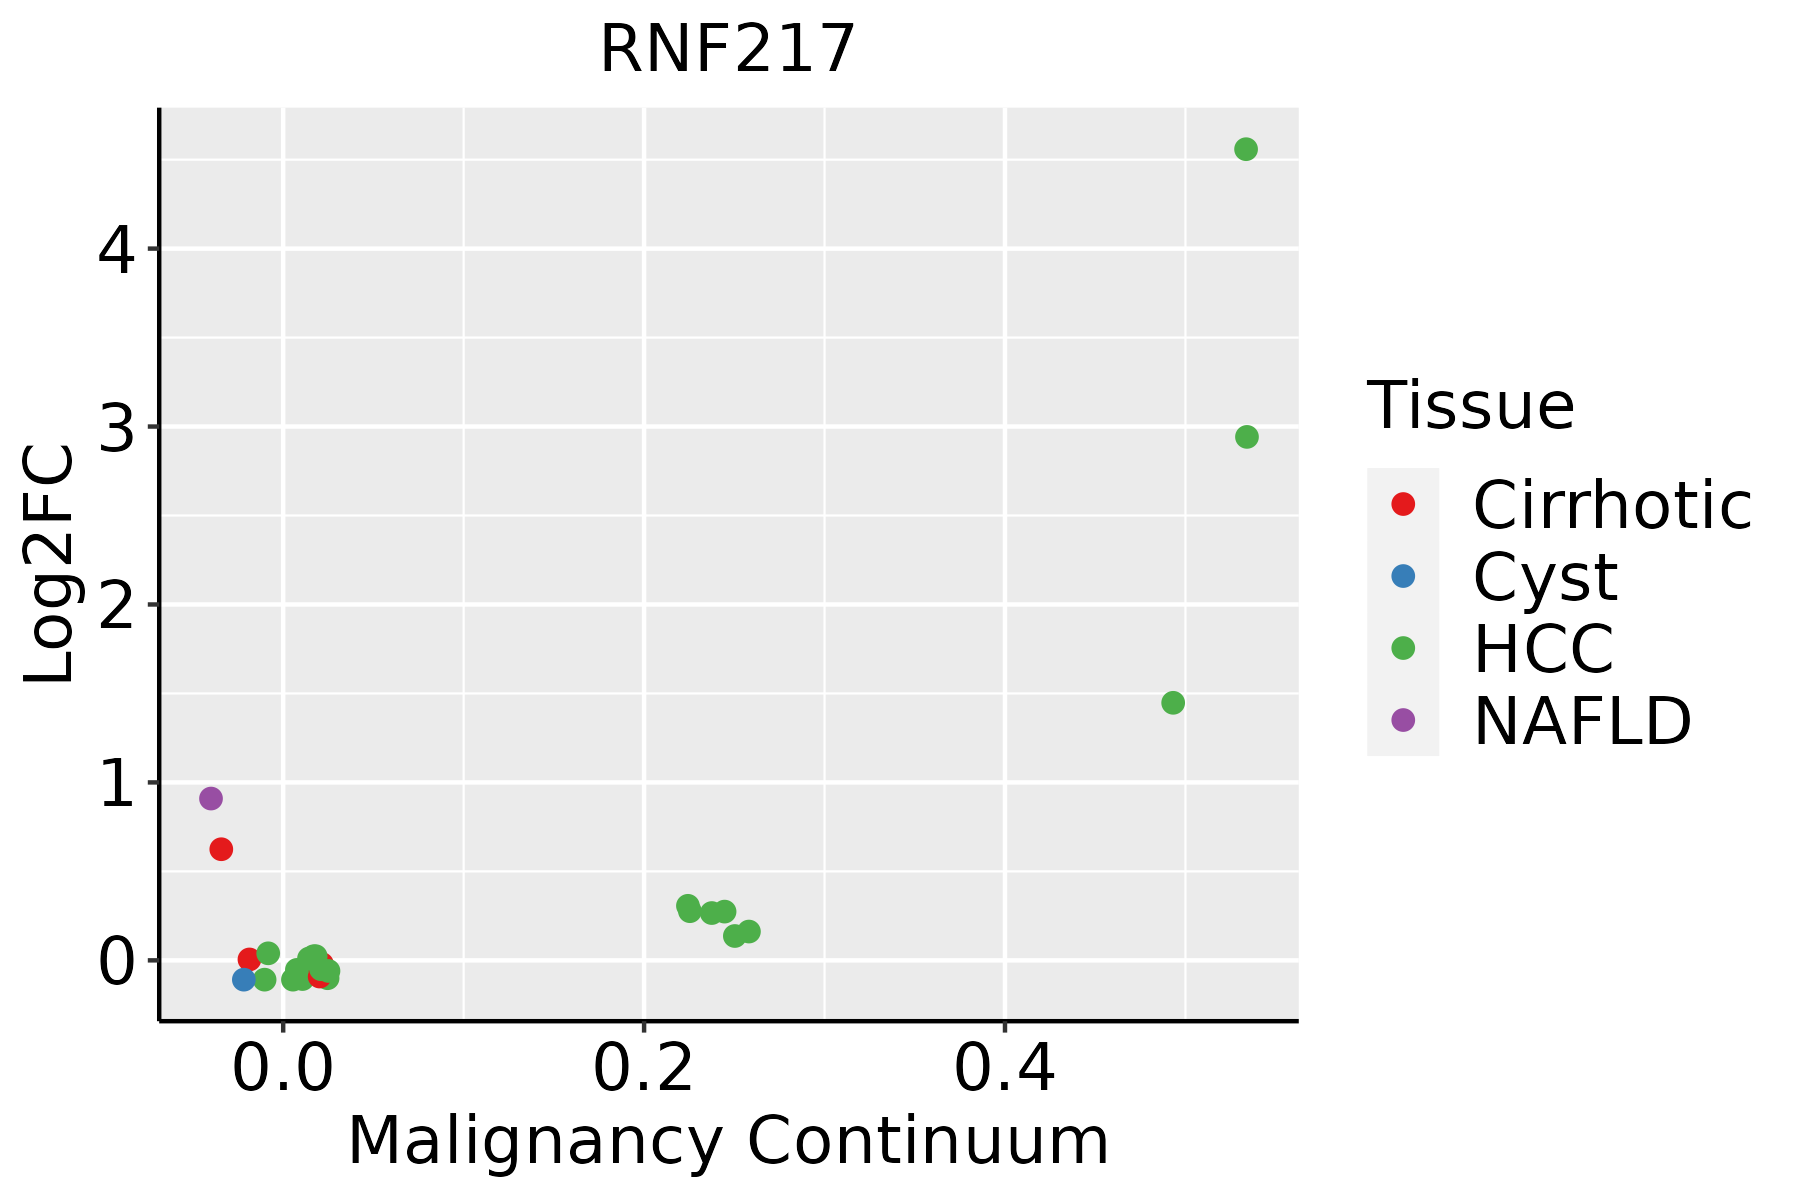 | HCC: Hepatocellular carcinoma |
| NAFLD: Non-alcoholic fatty liver disease |
| Lung | 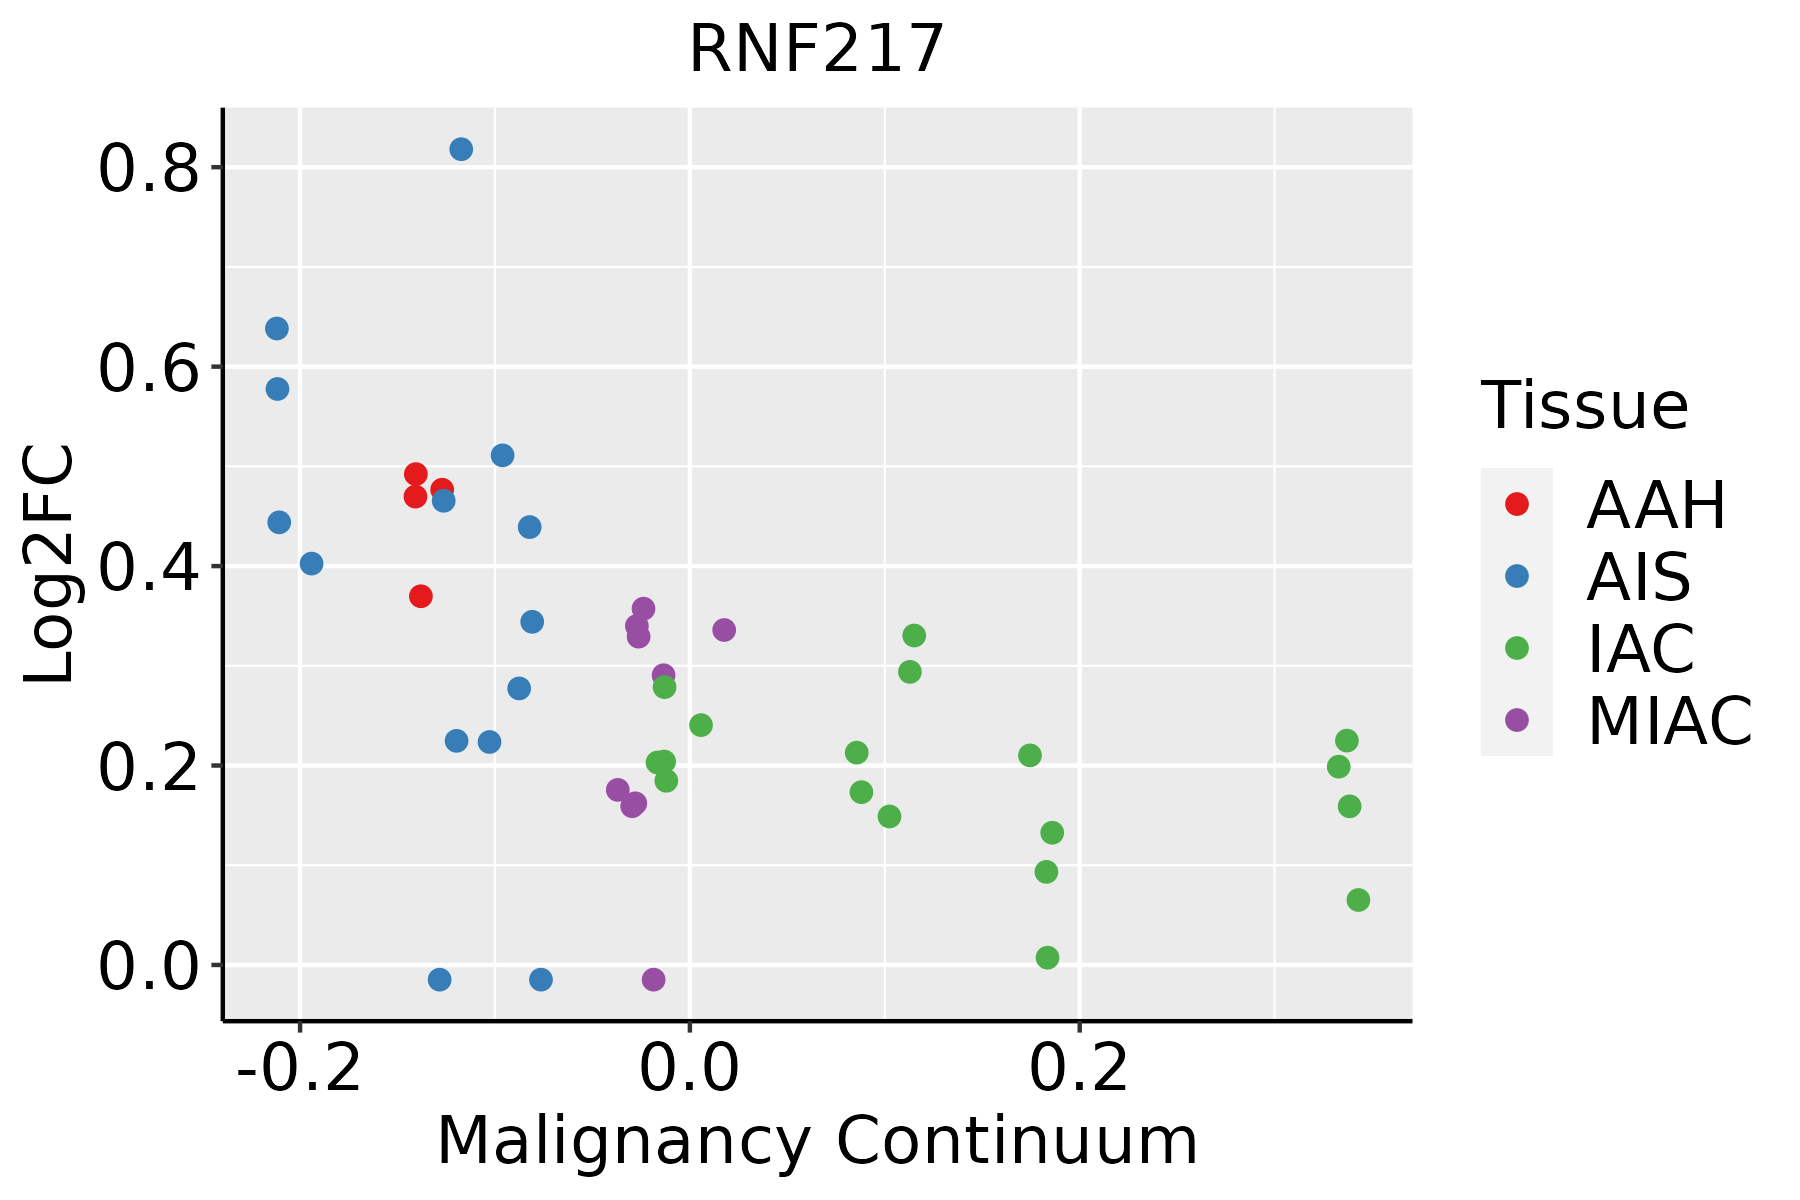 | AAH: Atypical adenomatous hyperplasia |
| AIS: Adenocarcinoma in situ |
| IAC: Invasive lung adenocarcinoma |
| MIA: Minimally invasive adenocarcinoma |
| Oral Cavity |  | EOLP: Erosive Oral lichen planus |
| LP: leukoplakia |
| NEOLP: Non-erosive oral lichen planus |
| OSCC: Oral squamous cell carcinoma |
| Prostate |  | BPH: Benign Prostatic Hyperplasia |
| Thyroid | 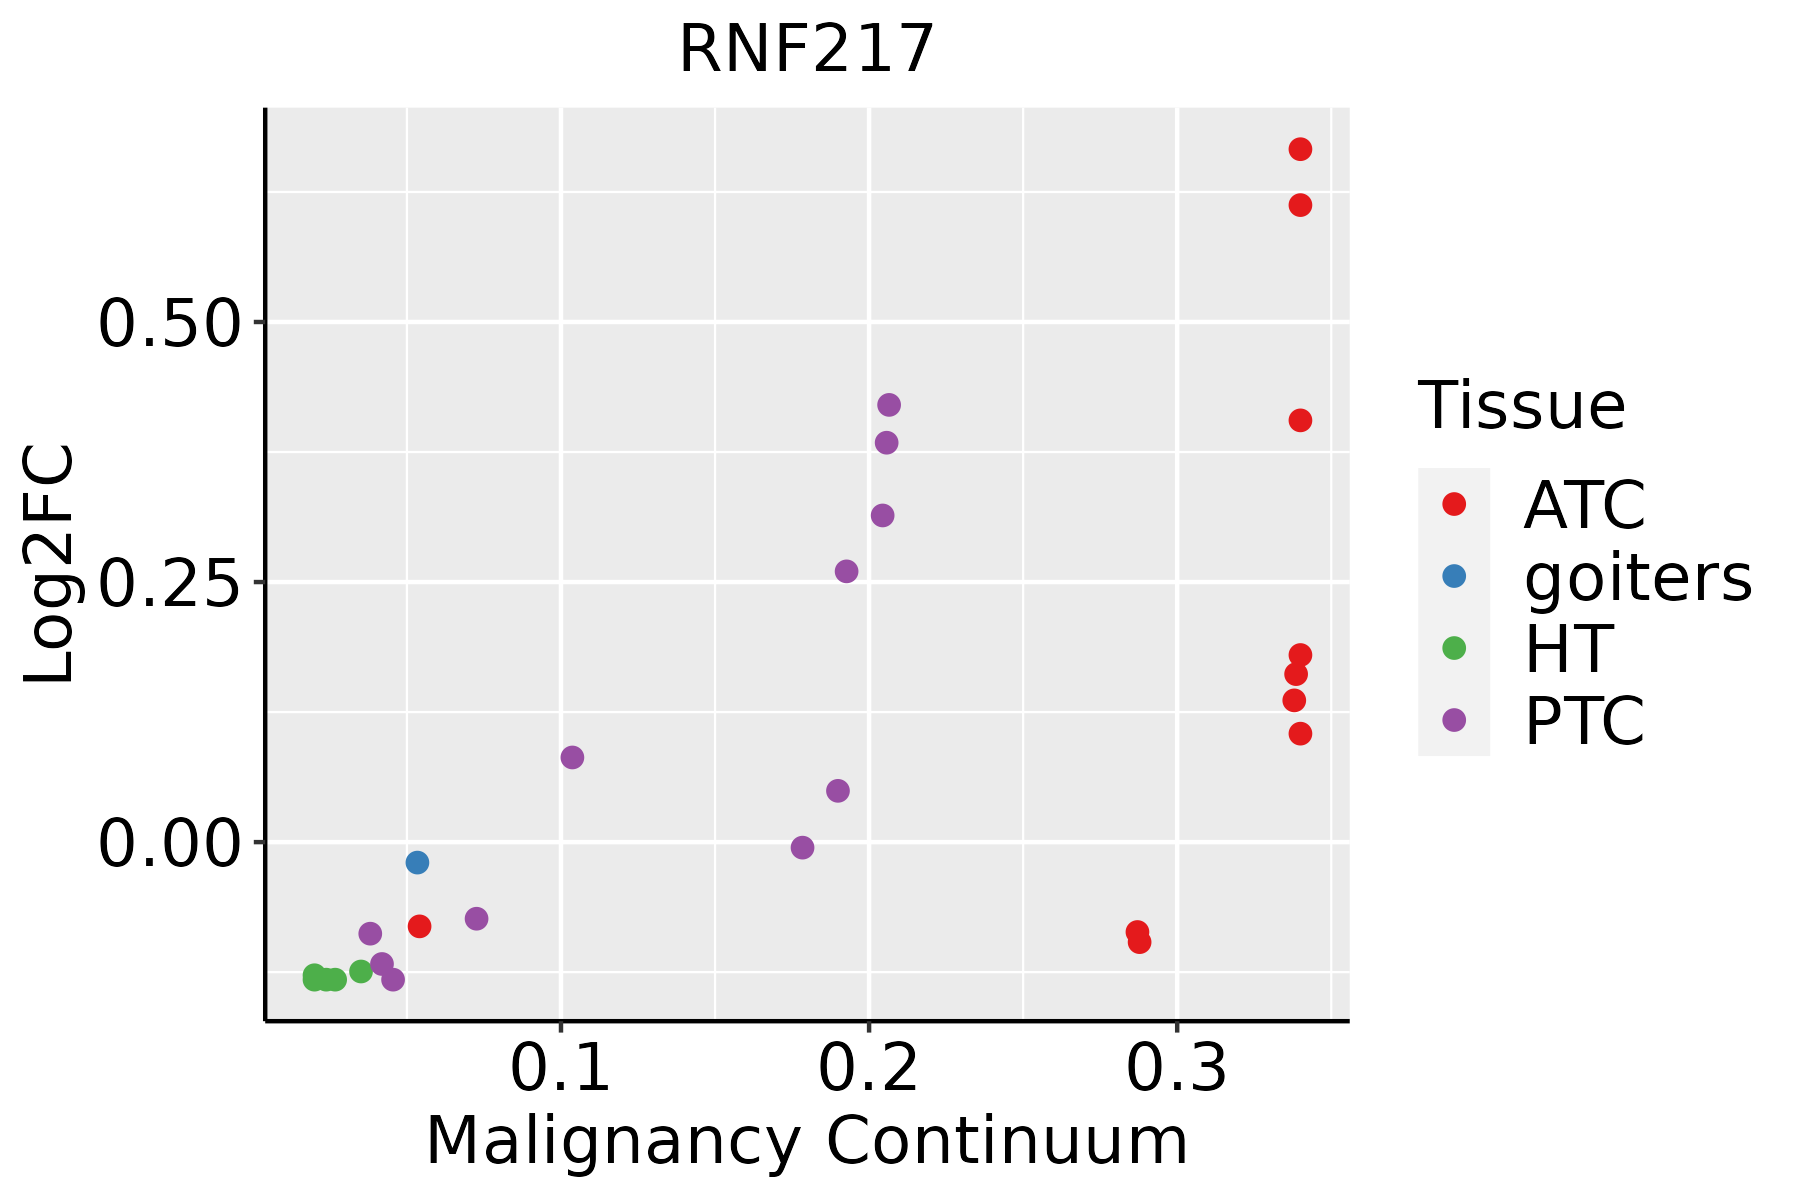 | ATC: Anaplastic thyroid cancer |
| HT: Hashimoto's thyroiditis |
| PTC: Papillary thyroid cancer |
| GO ID | Tissue | Disease Stage | Description | Gene Ratio | Bg Ratio | pvalue | p.adjust | Count |
| GO:004217610 | Cervix | CC | regulation of protein catabolic process | 104/2311 | 391/18723 | 9.39e-15 | 9.36e-12 | 104 |
| GO:004586210 | Cervix | CC | positive regulation of proteolysis | 95/2311 | 372/18723 | 1.84e-12 | 6.86e-10 | 95 |
| GO:190336210 | Cervix | CC | regulation of cellular protein catabolic process | 72/2311 | 255/18723 | 5.98e-12 | 2.10e-09 | 72 |
| GO:004573210 | Cervix | CC | positive regulation of protein catabolic process | 65/2311 | 231/18723 | 7.44e-11 | 1.39e-08 | 65 |
| GO:001049810 | Cervix | CC | proteasomal protein catabolic process | 111/2311 | 490/18723 | 8.98e-11 | 1.58e-08 | 111 |
| GO:000989610 | Cervix | CC | positive regulation of catabolic process | 109/2311 | 492/18723 | 5.26e-10 | 6.99e-08 | 109 |
| GO:190305010 | Cervix | CC | regulation of proteolysis involved in cellular protein catabolic process | 60/2311 | 221/18723 | 1.82e-09 | 1.98e-07 | 60 |
| GO:200005810 | Cervix | CC | regulation of ubiquitin-dependent protein catabolic process | 47/2311 | 164/18723 | 1.63e-08 | 1.25e-06 | 47 |
| GO:004316110 | Cervix | CC | proteasome-mediated ubiquitin-dependent protein catabolic process | 91/2311 | 412/18723 | 1.65e-08 | 1.25e-06 | 91 |
| GO:003133110 | Cervix | CC | positive regulation of cellular catabolic process | 91/2311 | 427/18723 | 9.64e-08 | 5.25e-06 | 91 |
| GO:00002097 | Cervix | CC | protein polyubiquitination | 58/2311 | 236/18723 | 1.57e-07 | 7.41e-06 | 58 |
| GO:190336410 | Cervix | CC | positive regulation of cellular protein catabolic process | 43/2311 | 155/18723 | 1.80e-07 | 8.28e-06 | 43 |
| GO:006113610 | Cervix | CC | regulation of proteasomal protein catabolic process | 48/2311 | 187/18723 | 4.63e-07 | 1.77e-05 | 48 |
| GO:003243410 | Cervix | CC | regulation of proteasomal ubiquitin-dependent protein catabolic process | 38/2311 | 134/18723 | 4.99e-07 | 1.88e-05 | 38 |
| GO:19030528 | Cervix | CC | positive regulation of proteolysis involved in cellular protein catabolic process | 34/2311 | 133/18723 | 2.28e-05 | 4.01e-04 | 34 |
| GO:200006010 | Cervix | CC | positive regulation of ubiquitin-dependent protein catabolic process | 29/2311 | 107/18723 | 2.77e-05 | 4.62e-04 | 29 |
| GO:00324369 | Cervix | CC | positive regulation of proteasomal ubiquitin-dependent protein catabolic process | 25/2311 | 90/18723 | 6.22e-05 | 8.90e-04 | 25 |
| GO:19018008 | Cervix | CC | positive regulation of proteasomal protein catabolic process | 29/2311 | 114/18723 | 9.71e-05 | 1.27e-03 | 29 |
| GO:0010498111 | Esophagus | ESCC | proteasomal protein catabolic process | 369/8552 | 490/18723 | 1.13e-41 | 1.80e-38 | 369 |
| GO:0043161111 | Esophagus | ESCC | proteasome-mediated ubiquitin-dependent protein catabolic process | 312/8552 | 412/18723 | 3.53e-36 | 4.48e-33 | 312 |
| Hugo Symbol | Variant Class | Variant Classification | dbSNP RS | HGVSc | HGVSp | HGVSp Short | SWISSPROT | BIOTYPE | SIFT | PolyPhen | Tumor Sample Barcode | Tissue | Histology | Sex | Age | Stage | Therapy Types | Drugs | Outcome |
| RNF217 | SNV | Missense_Mutation | rs865840139 | c.943G>A | p.Glu315Lys | p.E315K | Q8TC41 | protein_coding | tolerated(0.07) | probably_damaging(0.999) | TCGA-AC-A23H-01 | Breast | breast invasive carcinoma | Female | >=65 | I/II | Unknown | Unknown | PD |
| RNF217 | insertion | Frame_Shift_Ins | novel | c.1240_1241insGATGCAGTGTTGATGTCTGTATGTGTTTGCGTAAGGCC | p.Glu414GlyfsTer39 | p.E414Gfs*39 | Q8TC41 | protein_coding | | | TCGA-B6-A0I6-01 | Breast | breast invasive carcinoma | Female | <65 | I/II | Unknown | Unknown | PD |
| RNF217 | deletion | Frame_Shift_Del | novel | c.1623delN | p.Trp542GlyfsTer10 | p.W542Gfs*10 | Q8TC41 | protein_coding | | | TCGA-D8-A27V-01 | Breast | breast invasive carcinoma | Female | <65 | I/II | Hormone Therapy | tamoxiphen | SD |
| RNF217 | SNV | Missense_Mutation | novel | c.346G>A | p.Asp116Asn | p.D116N | Q8TC41 | protein_coding | deleterious_low_confidence(0.02) | benign(0.078) | TCGA-2W-A8YY-01 | Cervix | cervical & endocervical cancer | Female | <65 | I/II | Chemotherapy | cisplatin | CR |
| RNF217 | SNV | Missense_Mutation | | c.1277N>A | p.Cys426Tyr | p.C426Y | Q8TC41 | protein_coding | deleterious(0.04) | probably_damaging(0.924) | TCGA-JW-A5VJ-01 | Cervix | cervical & endocervical cancer | Female | <65 | I/II | Unknown | Unknown | PD |
| RNF217 | SNV | Missense_Mutation | novel | c.601N>G | p.Arg201Gly | p.R201G | Q8TC41 | protein_coding | tolerated_low_confidence(0.35) | benign(0.03) | TCGA-VS-A953-01 | Cervix | cervical & endocervical cancer | Female | <65 | I/II | Unknown | Unknown | PD |
| RNF217 | insertion | Frame_Shift_Ins | novel | c.1587_1588insA | p.Gln532ThrfsTer16 | p.Q532Tfs*16 | Q8TC41 | protein_coding | | | TCGA-EA-A3HU-01 | Cervix | cervical & endocervical cancer | Female | <65 | I/II | Unknown | Unknown | SD |
| RNF217 | SNV | Missense_Mutation | | c.1568N>G | p.Phe523Cys | p.F523C | Q8TC41 | protein_coding | deleterious(0) | probably_damaging(0.996) | TCGA-AA-A010-01 | Colorectum | colon adenocarcinoma | Female | <65 | I/II | Chemotherapy | folinic | CR |
| RNF217 | SNV | Missense_Mutation | rs778499520 | c.1352N>A | p.Arg451Gln | p.R451Q | Q8TC41 | protein_coding | tolerated(0.06) | probably_damaging(0.999) | TCGA-DM-A1D4-01 | Colorectum | colon adenocarcinoma | Male | >=65 | I/II | Unknown | Unknown | PD |
| RNF217 | SNV | Missense_Mutation | | c.1528G>C | p.Ala510Pro | p.A510P | Q8TC41 | protein_coding | deleterious(0.01) | possibly_damaging(0.896) | TCGA-AG-3592-01 | Colorectum | rectum adenocarcinoma | Male | >=65 | I/II | Unknown | Unknown | SD |


