Schematic overview of the cellular and molecular mechanisms involved in the cancer progression, including the proposed cellular and molecular mechanisms in cancer cells trajectory. AT1: alveolar type 1 cells; AT2: alveolar type 2 cells; AAH: atypical adenomatous hyperplasia; AIS: adenocarcinoma in situ; MIA: minimally invasive adenocarcinoma; IA: invasive adenocarcinoma; EMT: epithelial-mesenchymal transition

Home

Download

Statistics

Help

Contact

Center for Computational Systems Medicine
leaf

Gene summary

leaf

Malignant transformation analysis

leaf

Malignant transformation related pathway analysis

leaf

Cell-cell communication analysis

leaf

Single-cell gene regulatory network inference analysis

leaf

Somatic mutation of malignant transformation related genes

leaf

Related drugs of malignant transformation related genes

Gene: RNF216

Gene summary for RNF216

check button Gene summary.

Gene informationSpeciesHuman
Gene symbol

RNF216

Gene ID

54476

Gene namering finger protein 216
Gene AliasCAHH
Cytomap7p22.1
Gene Typeprotein-coding
GO ID

GO:0000209

UniProtAcc

A8K8N1


Top

Malignant transformation analysis

check button Identification of the aberrant gene expression in precancerous and cancerous lesions by comparing the gene expression of stem-like cells in diseased tissues with normal stem cells
check button Malignant transformation involving gene list.
Entrez IDSymbolReplicatesSpeciesOrganTissueAdj P-valueLog2FCMalignancy
54476RNF216AEH-subject4HumanEndometriumAEH5.62e-032.32e-01-0.2657
54476RNF216AEH-subject5HumanEndometriumAEH2.88e-062.41e-01-0.2953
54476RNF216EEC-subject1HumanEndometriumEEC1.71e-031.75e-01-0.2682
54476RNF216GSM6177620_NYU_UCEC1_lib1_lib1HumanEndometriumEEC6.45e-07-2.83e-02-0.1869
54476RNF216GSM6177620_NYU_UCEC1_lib2_lib2HumanEndometriumEEC4.54e-04-8.48e-02-0.1875
54476RNF216GSM6177620_NYU_UCEC1_lib3_lib3HumanEndometriumEEC1.74e-06-8.26e-02-0.1883
54476RNF216GSM6177621_NYU_UCEC2_lib1_lib1HumanEndometriumEEC2.09e-03-5.26e-02-0.1934
54476RNF216GSM6177622_NYU_UCEC3_lib1_lib1HumanEndometriumEEC1.88e-14-3.08e-02-0.1917
54476RNF216GSM6177622_NYU_UCEC3_lib2_lib2HumanEndometriumEEC4.80e-09-3.45e-02-0.1916
54476RNF216LZE2THumanEsophagusESCC6.95e-086.36e-010.082
54476RNF216LZE4THumanEsophagusESCC1.22e-113.47e-010.0811
54476RNF216LZE7THumanEsophagusESCC1.12e-146.26e-010.0667
54476RNF216LZE8THumanEsophagusESCC3.45e-041.41e-010.067
54476RNF216LZE22THumanEsophagusESCC1.16e-021.92e-010.068
54476RNF216LZE24THumanEsophagusESCC4.26e-203.67e-010.0596
54476RNF216LZE21THumanEsophagusESCC8.94e-032.17e-010.0655
54476RNF216LZE6THumanEsophagusESCC1.49e-052.22e-010.0845
54476RNF216P1T-EHumanEsophagusESCC1.76e-124.04e-010.0875
54476RNF216P2T-EHumanEsophagusESCC1.06e-415.37e-010.1177
54476RNF216P4T-EHumanEsophagusESCC7.37e-153.10e-010.1323
Page: 1 2 3 4 5 6 

check button Transcriptomic changes along malignancy continuum.
TissueExpression DynamicsAbbreviation
EndometriumThe image shows the transcriptomic changes along malignancy continuum.log2FC in expression of this searched gene in stem-like cells from each diseased tissue sample relative to stem-like cells in normal samples in each tissue plotted against the malignancy continuum. Samples are colored based on if they are from different disease stage.
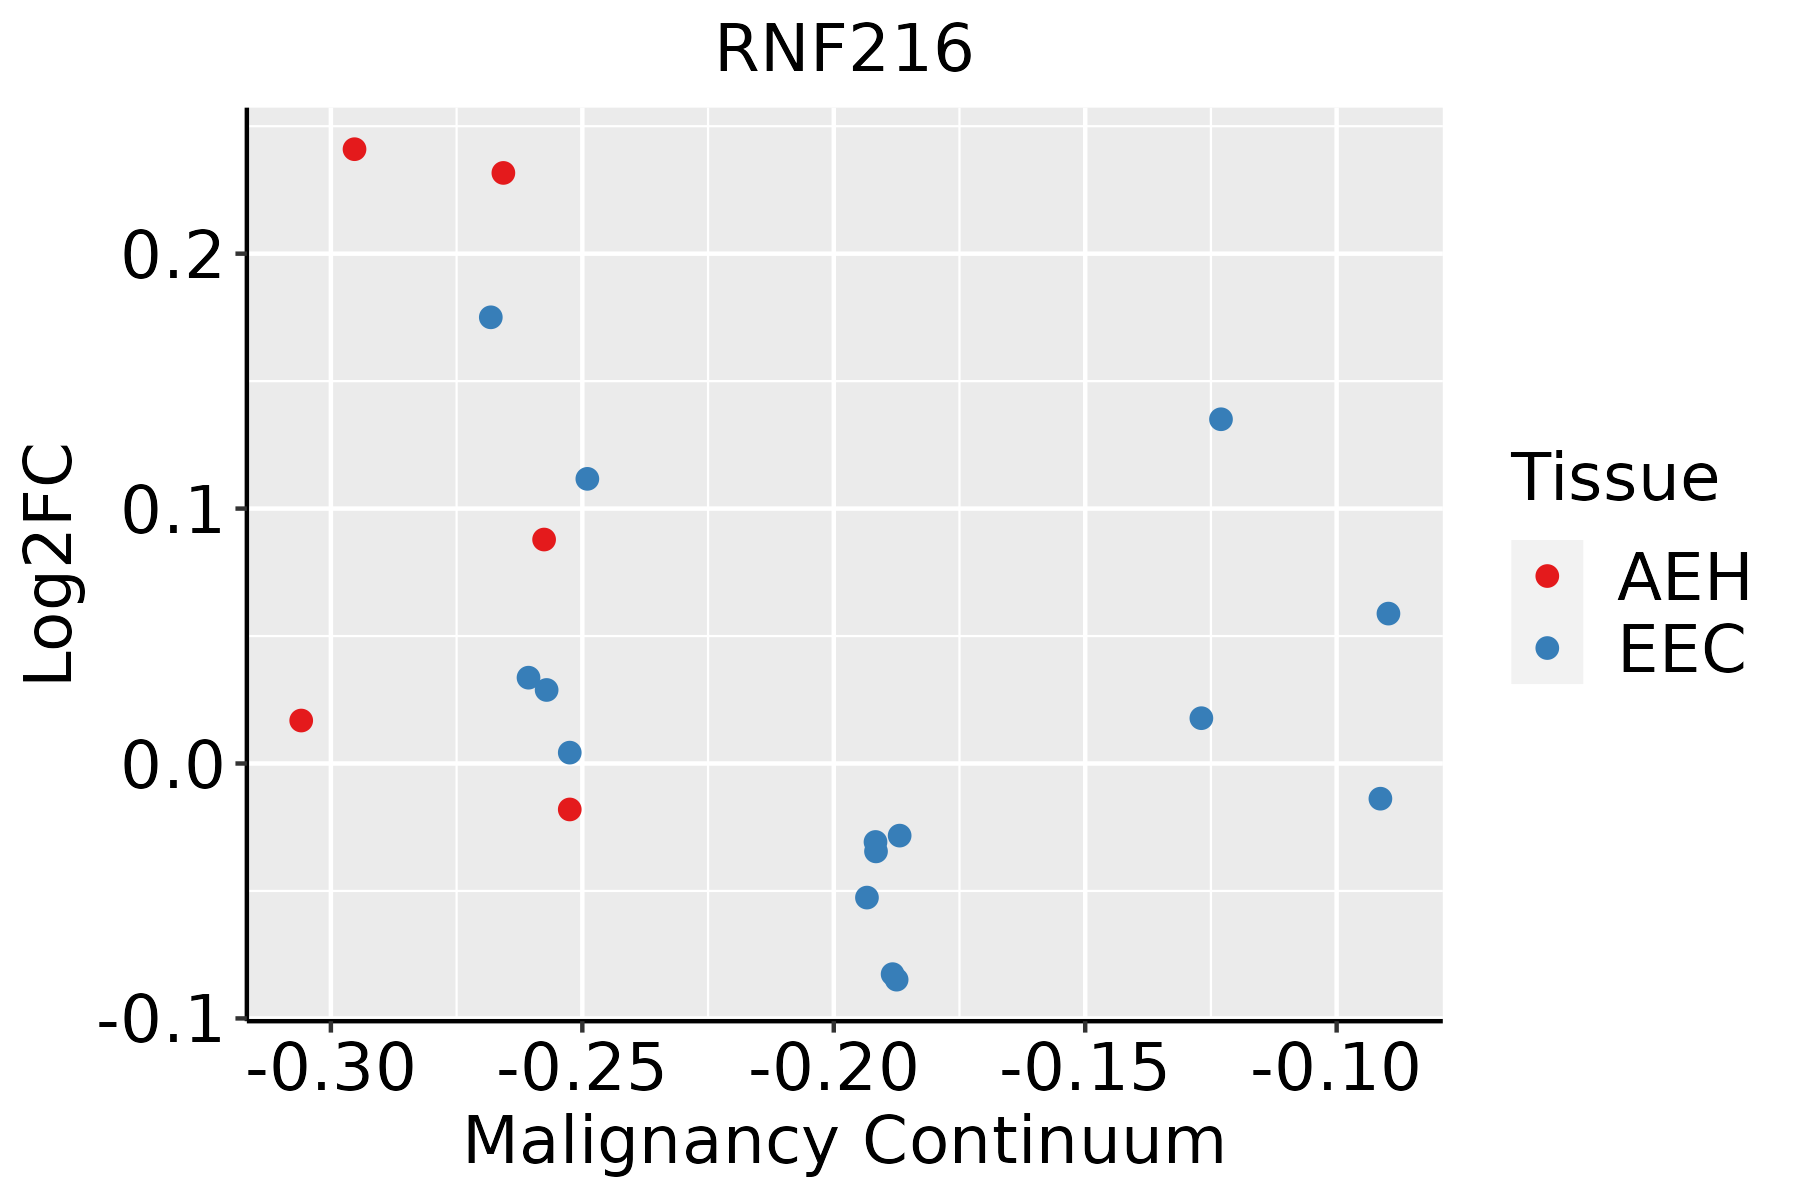
AEH: Atypical endometrial hyperplasia
EEC: Endometrioid Cancer
EsophagusThe image shows the transcriptomic changes along malignancy continuum.log2FC in expression of this searched gene in stem-like cells from each diseased tissue sample relative to stem-like cells in normal samples in each tissue plotted against the malignancy continuum. Samples are colored based on if they are from different disease stage.
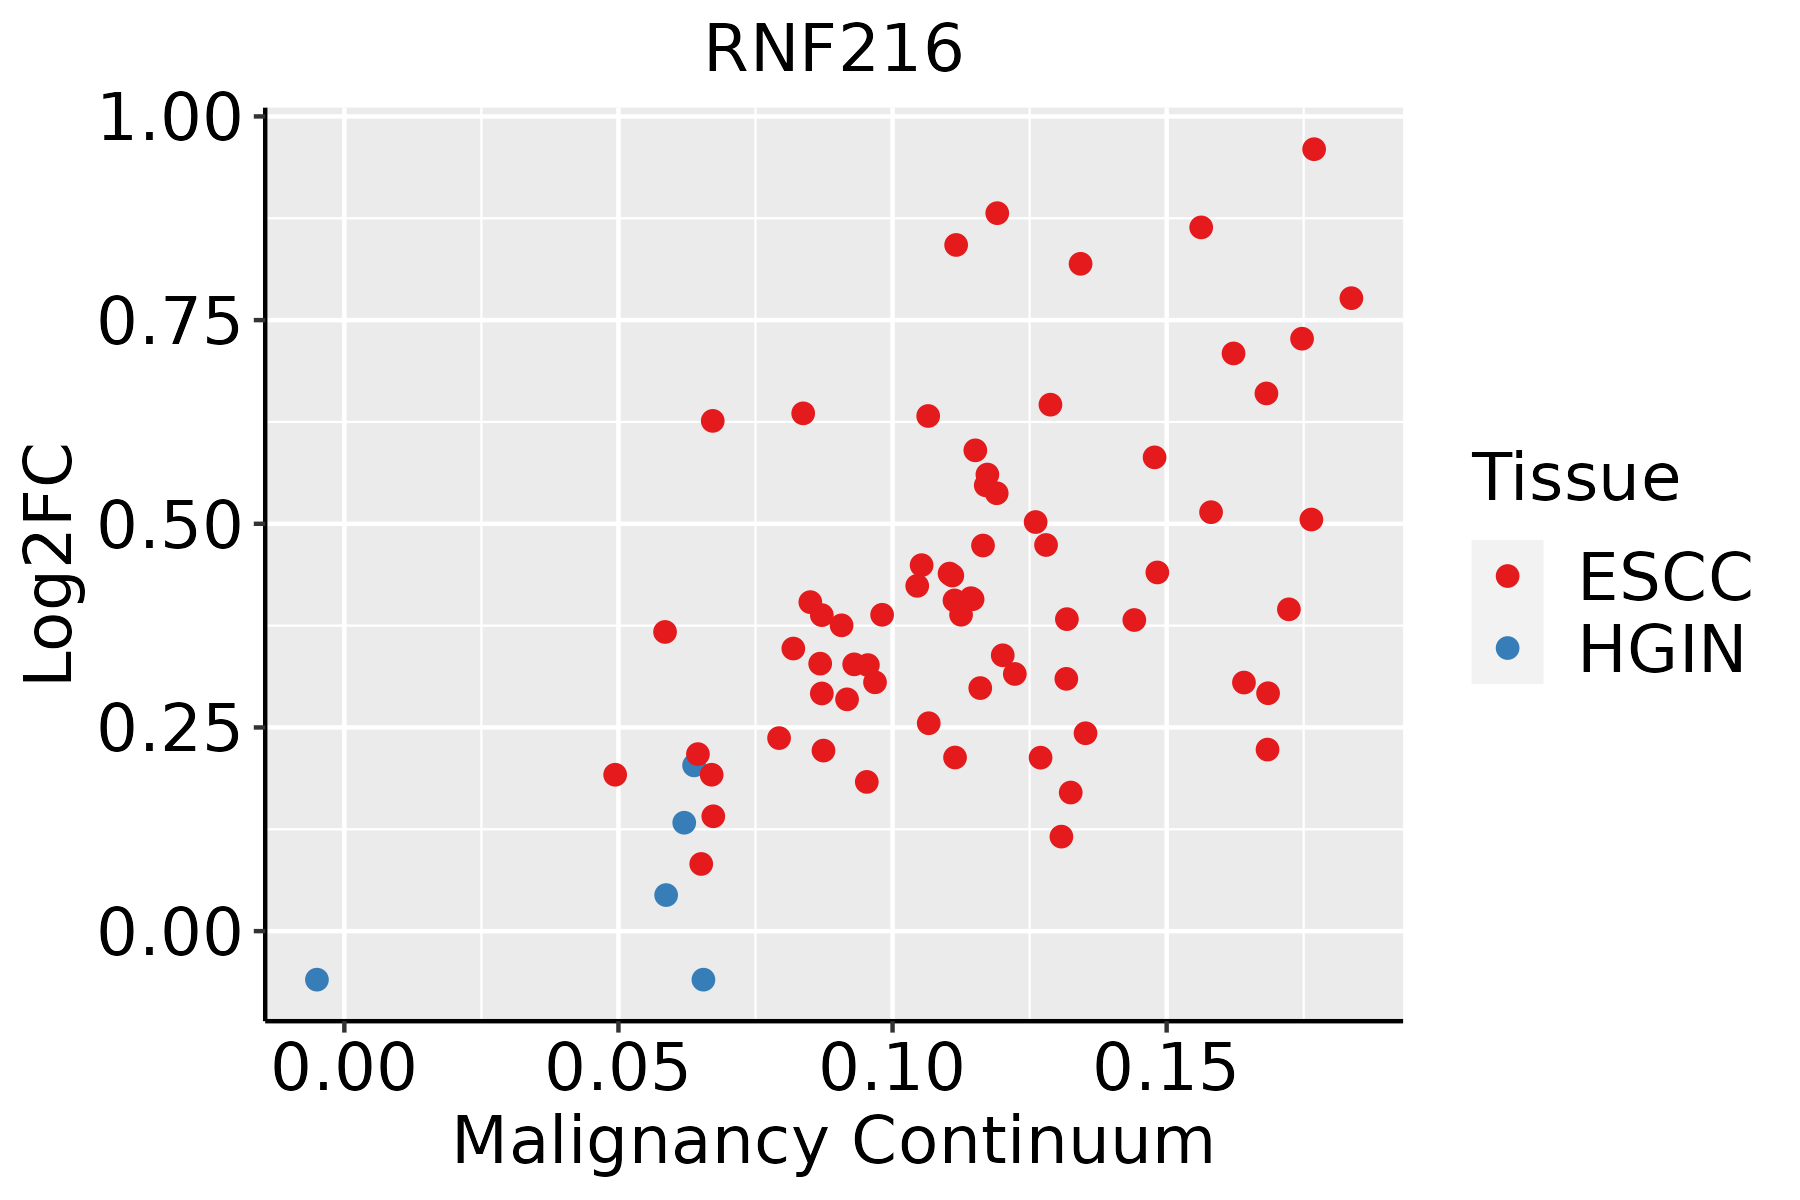
ESCC: Esophageal squamous cell carcinoma
HGIN: High-grade intraepithelial neoplasias
LGIN: Low-grade intraepithelial neoplasias
LiverThe image shows the transcriptomic changes along malignancy continuum.log2FC in expression of this searched gene in stem-like cells from each diseased tissue sample relative to stem-like cells in normal samples in each tissue plotted against the malignancy continuum. Samples are colored based on if they are from different disease stage.
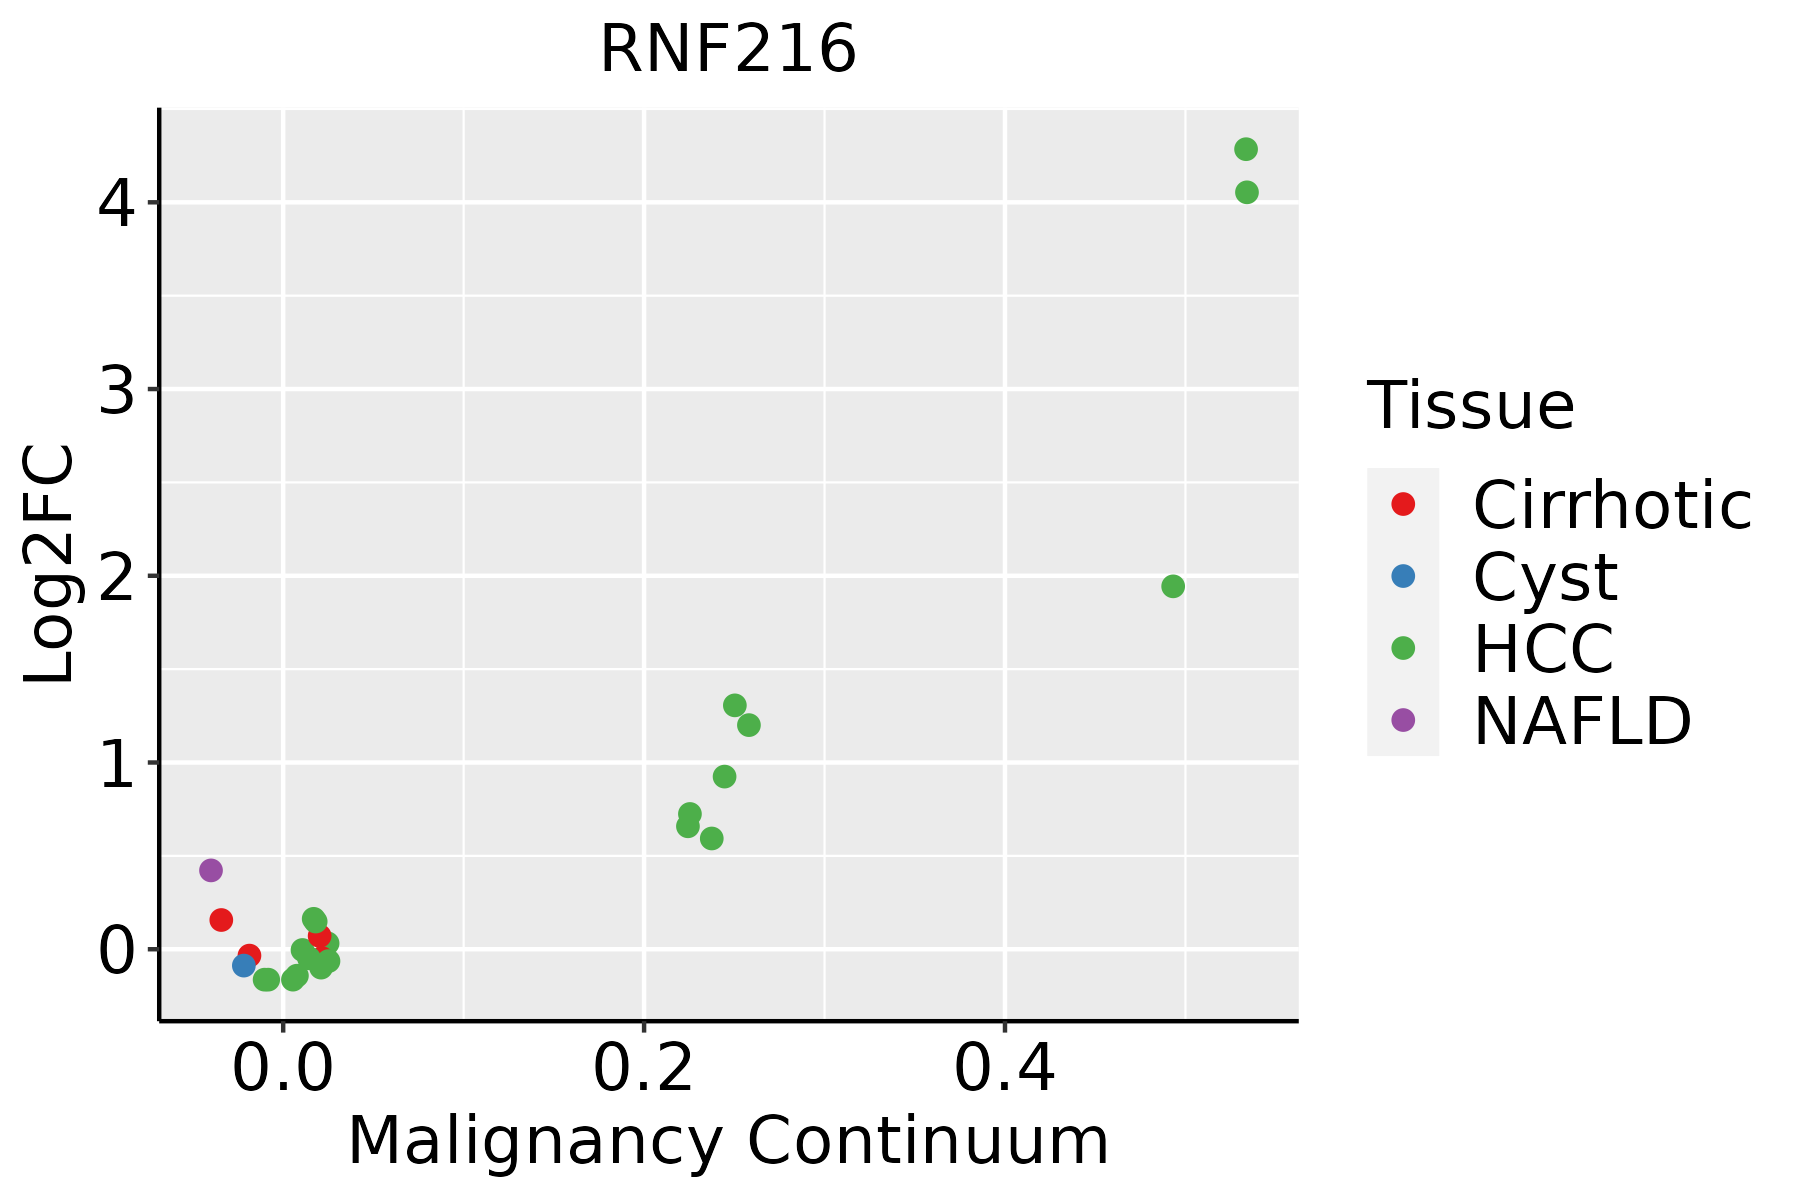
HCC: Hepatocellular carcinoma
NAFLD: Non-alcoholic fatty liver disease
Oral CavityThe image shows the transcriptomic changes along malignancy continuum.log2FC in expression of this searched gene in stem-like cells from each diseased tissue sample relative to stem-like cells in normal samples in each tissue plotted against the malignancy continuum. Samples are colored based on if they are from different disease stage.EOLP: Erosive Oral lichen planus
LP: leukoplakia
NEOLP: Non-erosive oral lichen planus
OSCC: Oral squamous cell carcinoma
ThyroidThe image shows the transcriptomic changes along malignancy continuum.log2FC in expression of this searched gene in stem-like cells from each diseased tissue sample relative to stem-like cells in normal samples in each tissue plotted against the malignancy continuum. Samples are colored based on if they are from different disease stage.ATC: Anaplastic thyroid cancer
HT: Hashimoto's thyroiditis
PTC: Papillary thyroid cancer
∗log2FC in expression of this searched gene in stem-like cells from each diseased tissue sample relative to stem-like cells in normal samples in each tissue plotted against the malignancy continuum. Samples are colored based on if they are from different disease stage.

Top

Malignant transformation related pathway analysis

check buttonFind out the enriched GO biological processes and KEGG pathways involved in transition from healthy to precancer to cancer
check button Figure of enriched GO biological processes.
TissueDisease StageEnriched GO biological Processes
ColorectumADGO analysis - Figure of enriched GO biological processes: Top 15 enriched GO BP terms are showed in the bar plot of each disease state in each tissue. Each row represents a significant GO biological process which is colored according to the -log10(p.adjust).
ColorectumSERGO analysis - Figure of enriched GO biological processes: Top 15 enriched GO BP terms are showed in the bar plot of each disease state in each tissue. Each row represents a significant GO biological process which is colored according to the -log10(p.adjust).
ColorectumMSSGO analysis - Figure of enriched GO biological processes: Top 15 enriched GO BP terms are showed in the bar plot of each disease state in each tissue. Each row represents a significant GO biological process which is colored according to the -log10(p.adjust).
ColorectumMSI-HGO analysis - Figure of enriched GO biological processes: Top 15 enriched GO BP terms are showed in the bar plot of each disease state in each tissue. Each row represents a significant GO biological process which is colored according to the -log10(p.adjust).
ColorectumFAPGO analysis - Figure of enriched GO biological processes: Top 15 enriched GO BP terms are showed in the bar plot of each disease state in each tissue. Each row represents a significant GO biological process which is colored according to the -log10(p.adjust).
∗Top 15 enriched GO BP terms are showed in the bar plot of each disease state in each tissue. Each row represents a significant GO biological process which is colored according to the -log10(p.adjust).
Page: 1 2 3 4 5 6 7 8 9 

check button Enriched GO biological processes.
GO IDTissueDisease StageDescriptionGene RatioBg Ratiopvaluep.adjustCount
GO:001049816EndometriumAEHproteasomal protein catabolic process108/2100490/187232.73e-124.67e-10108
GO:004316116EndometriumAEHproteasome-mediated ubiquitin-dependent protein catabolic process88/2100412/187231.54e-091.36e-0788
GO:00709367EndometriumAEHprotein K48-linked ubiquitination21/210065/187234.56e-061.18e-0421
GO:00096159EndometriumAEHresponse to virus63/2100367/187233.81e-044.10e-0363
GO:00002098EndometriumAEHprotein polyubiquitination44/2100236/187234.83e-044.97e-0344
GO:001049817EndometriumEECproteasomal protein catabolic process112/2168490/187236.99e-131.40e-10112
GO:004316117EndometriumEECproteasome-mediated ubiquitin-dependent protein catabolic process92/2168412/187233.01e-103.23e-0892
GO:007093614EndometriumEECprotein K48-linked ubiquitination22/216865/187231.92e-065.79e-0522
GO:000961513EndometriumEECresponse to virus66/2168367/187231.78e-042.20e-0366
GO:000020913EndometriumEECprotein polyubiquitination46/2168236/187232.65e-043.04e-0346
GO:0010498111EsophagusESCCproteasomal protein catabolic process369/8552490/187231.13e-411.80e-38369
GO:0043161111EsophagusESCCproteasome-mediated ubiquitin-dependent protein catabolic process312/8552412/187233.53e-364.48e-33312
GO:000020917EsophagusESCCprotein polyubiquitination170/8552236/187231.40e-161.09e-14170
GO:000961518EsophagusESCCresponse to virus238/8552367/187236.65e-143.32e-12238
GO:007093617EsophagusESCCprotein K48-linked ubiquitination55/855265/187238.42e-112.58e-0955
GO:00516075EsophagusESCCdefense response to virus171/8552265/187233.91e-101.05e-08171
GO:01405465EsophagusESCCdefense response to symbiont171/8552265/187233.91e-101.05e-08171
GO:00028318EsophagusESCCregulation of response to biotic stimulus191/8552327/187232.12e-062.45e-05191
GO:00326084EsophagusESCCinterferon-beta production40/855256/187238.36e-056.08e-0440
GO:00326484EsophagusESCCregulation of interferon-beta production40/855256/187238.36e-056.08e-0440
Page: 1 2 3 4 5 6 

check button Enriched KEGG pathways.
Pathway IDTissueDisease StageDescriptionGene RatioBg Ratiopvaluep.adjustqvalueCount
Page: 1 

Top

Cell-cell communication analysis

check buttonIdentification of potential cell-cell interactions between two cell types and their ligand-receptor pairs for different disease states
LigandReceptorLRpairPathwayTissueDisease Stage
Page: 1 

Top

Single-cell gene regulatory network inference analysis

check buttonFind out the significant the regulons (TFs) and the target genes of each regulon across cell types for different disease states
TFCell TypeTissueDisease StageTarget GeneRSSRegulon Activity
∗The dot plots of a searched regulon are shown for all cell subpopulations in each disease state of each tissue based on the regulon specific score inferred using pySCENIC and by calculating the average expression.
Page: 1 

Top

Somatic mutation of malignant transformation related genes

check buttonAnnotation of somatic variants for genes involved in malignant transformation
Hugo SymbolVariant ClassVariant ClassificationdbSNP RSHGVScHGVSpHGVSp ShortSWISSPROTBIOTYPESIFTPolyPhenTumor Sample BarcodeTissueHistologySexAgeStageTherapy TypesDrugsOutcome
RNF216SNVMissense_Mutationnovelc.2129N>Cp.Glu710Alap.E710AQ9NWF9protein_codingdeleterious(0)probably_damaging(0.959)TCGA-A2-A0ER-01Breastbreast invasive carcinomaFemale<65I/IIChemotherapycytoxanSD
RNF216SNVMissense_Mutationc.1771N>Tp.His591Tyrp.H591YQ9NWF9protein_codingdeleterious(0)probably_damaging(0.999)TCGA-A8-A0A7-01Breastbreast invasive carcinomaFemale<65I/IIUnknownUnknownSD
RNF216SNVMissense_Mutationnovelc.1430N>Tp.Pro477Leup.P477LQ9NWF9protein_codingdeleterious(0.03)probably_damaging(0.927)TCGA-BH-A0WA-01Breastbreast invasive carcinomaFemale>=65I/IIUnknownUnknownSD
RNF216SNVMissense_Mutationnovelc.2725N>Ap.His909Asnp.H909NQ9NWF9protein_codingdeleterious(0.02)possibly_damaging(0.889)TCGA-E9-A1R6-01Breastbreast invasive carcinomaFemale<65I/IIHormone TherapytamoxiphenSD
RNF216SNVMissense_Mutationc.1165N>Cp.Glu389Glnp.E389QQ9NWF9protein_codingdeleterious(0.04)probably_damaging(0.973)TCGA-GM-A2DH-01Breastbreast invasive carcinomaFemale<65I/IIChemotherapytaxolCR
RNF216insertionNonsense_Mutationnovelc.2127_2128insTTCTCTTCTCTCATAACAATCTAGCCTTACCATGCAp.Ala709_Glu710insPheSerSerLeuIleThrIleTerProTyrHisAlap.A709_E710insFSSLITI*PYHAQ9NWF9protein_codingTCGA-A2-A0ER-01Breastbreast invasive carcinomaFemale<65I/IIChemotherapycytoxanSD
RNF216insertionIn_Frame_Insnovelc.683_684insTCTTACp.Cys228_Trp229insLeuThrp.C228_W229insLTQ9NWF9protein_codingTCGA-A8-A06P-01Breastbreast invasive carcinomaFemale<65III/IVUnspecificSD
RNF216insertionNonsense_Mutationnovelc.682_683insAGCTCCTTGTGGCTGTTTACATTTAAATp.Cys228Terp.C228*Q9NWF9protein_codingTCGA-A8-A06P-01Breastbreast invasive carcinomaFemale<65III/IVUnspecificSD
RNF216insertionNonsense_Mutationnovelc.2180_2181insTAACAGCCACCCCTAATAATCAAATAAATGGAAATGAAAATp.Arg728AsnfsTer5p.R728Nfs*5Q9NWF9protein_codingTCGA-AN-A041-01Breastbreast invasive carcinomaFemale<65I/IIUnknownUnknownSD
RNF216deletionFrame_Shift_Delnovelc.927delNp.Glu310SerfsTer27p.E310Sfs*27Q9NWF9protein_codingTCGA-D8-A27V-01Breastbreast invasive carcinomaFemale<65I/IIHormone TherapytamoxiphenSD
Page: 1 2 3 4 5 6 7 8 9 10 

Top

Related drugs of malignant transformation related genes

check buttonIdentification of chemicals and drugs interact with genes involved in malignant transfromation
(DGIdb 4.0)
Entrez IDSymbolCategoryInteraction TypesDrug Claim NameDrug NamePMIDs
Page: 1