| Tissue | Expression Dynamics | Abbreviation |
| Breast |  | IDC: Invasive ductal carcinoma |
| DCIS: Ductal carcinoma in situ |
| Precancer(BRCA1-mut): Precancerous lesion from BRCA1 mutation carriers |
| Cervix | 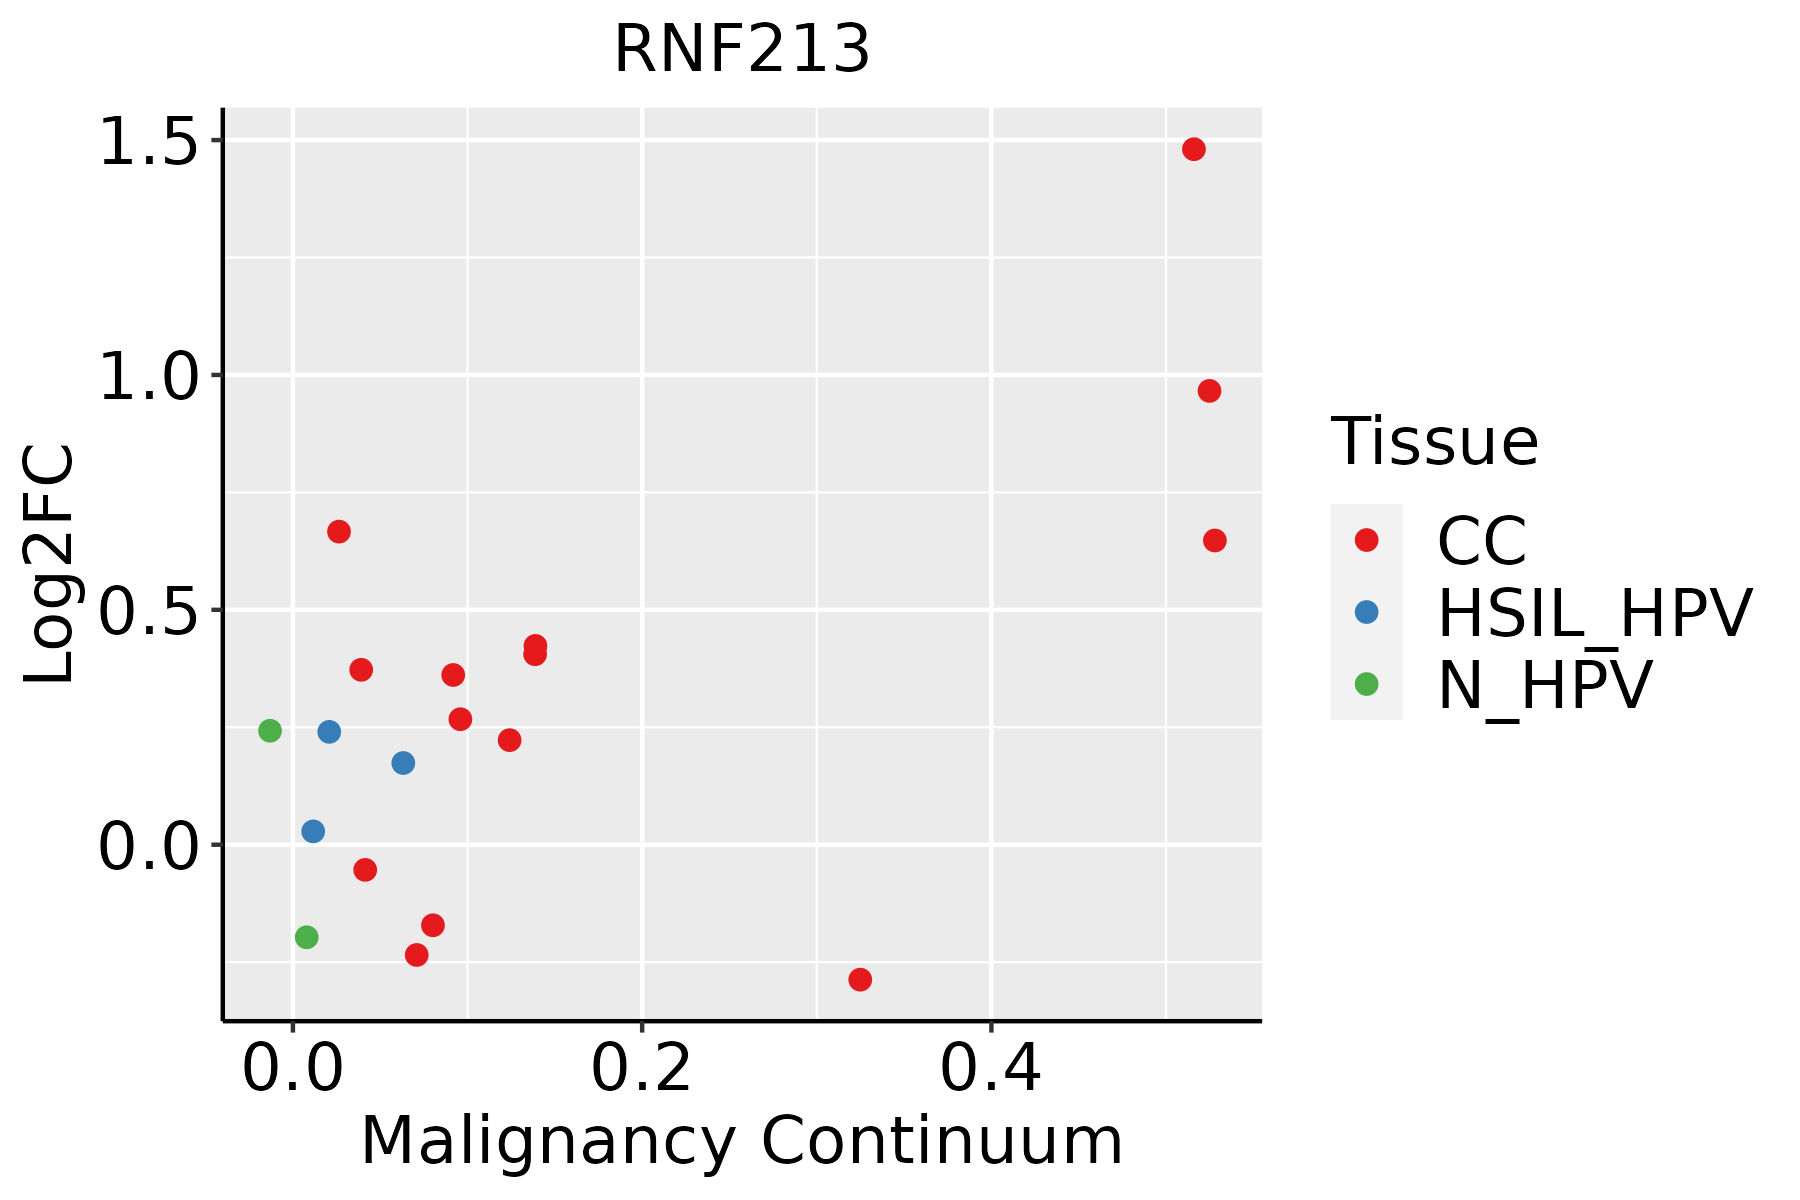 | CC: Cervix cancer |
| HSIL_HPV: HPV-infected high-grade squamous intraepithelial lesions |
| N_HPV: HPV-infected normal cervix |
| Endometrium | 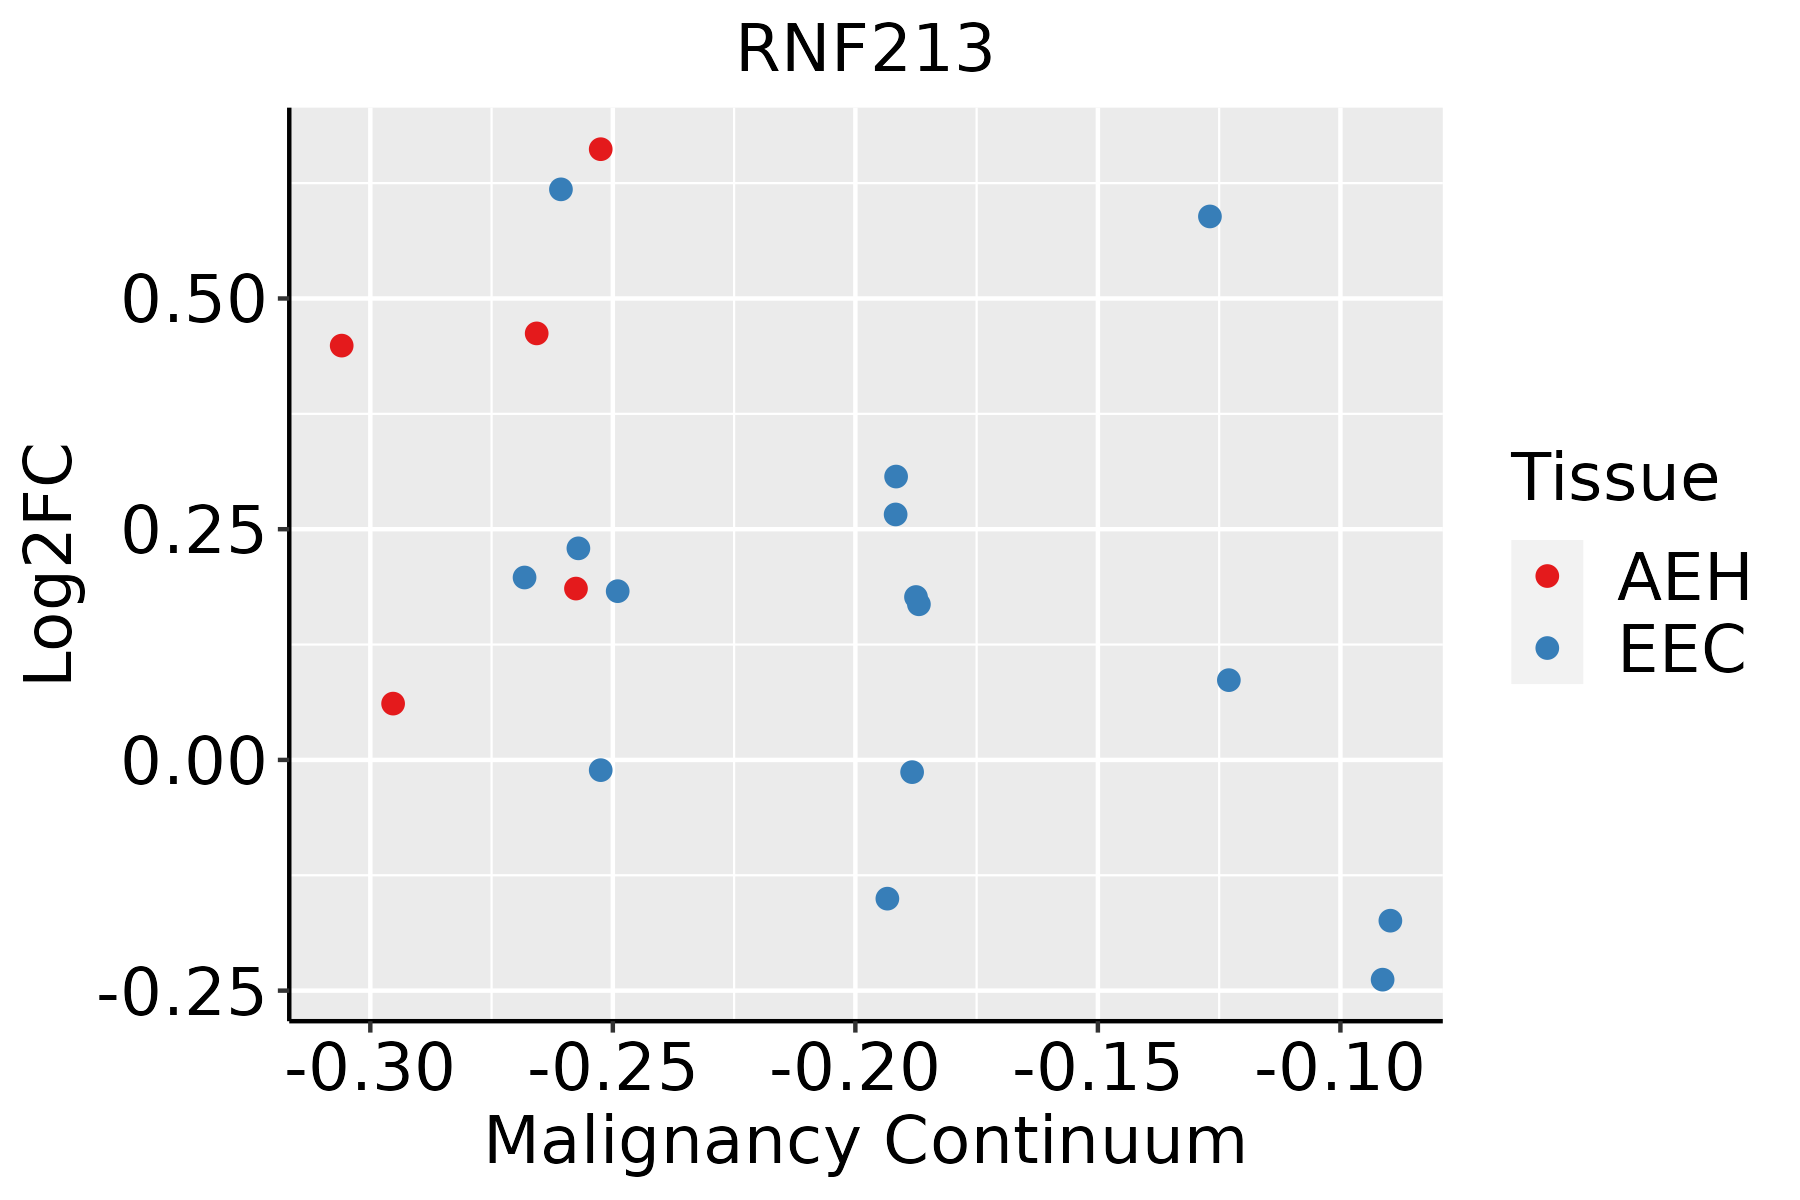 | AEH: Atypical endometrial hyperplasia |
| EEC: Endometrioid Cancer |
| Esophagus | 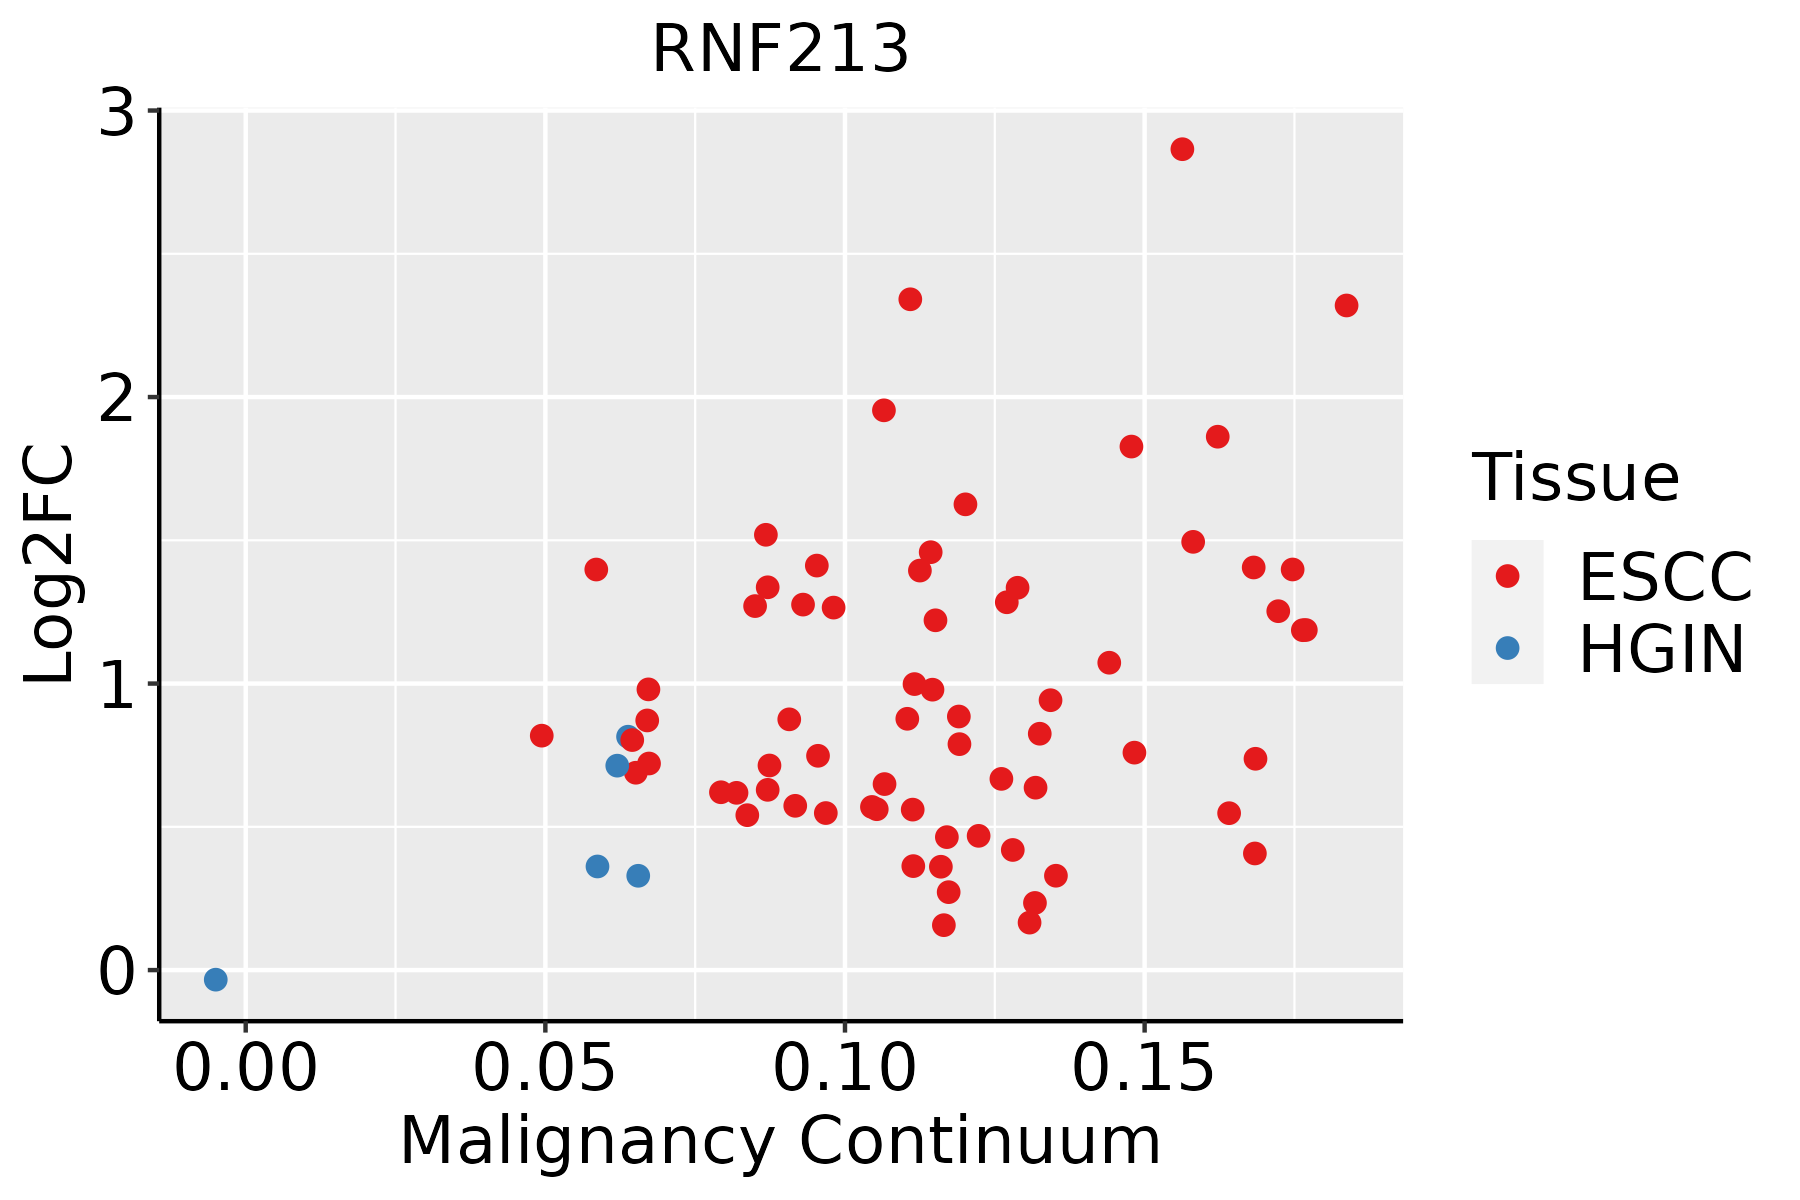 | ESCC: Esophageal squamous cell carcinoma |
| HGIN: High-grade intraepithelial neoplasias |
| LGIN: Low-grade intraepithelial neoplasias |
| GC | 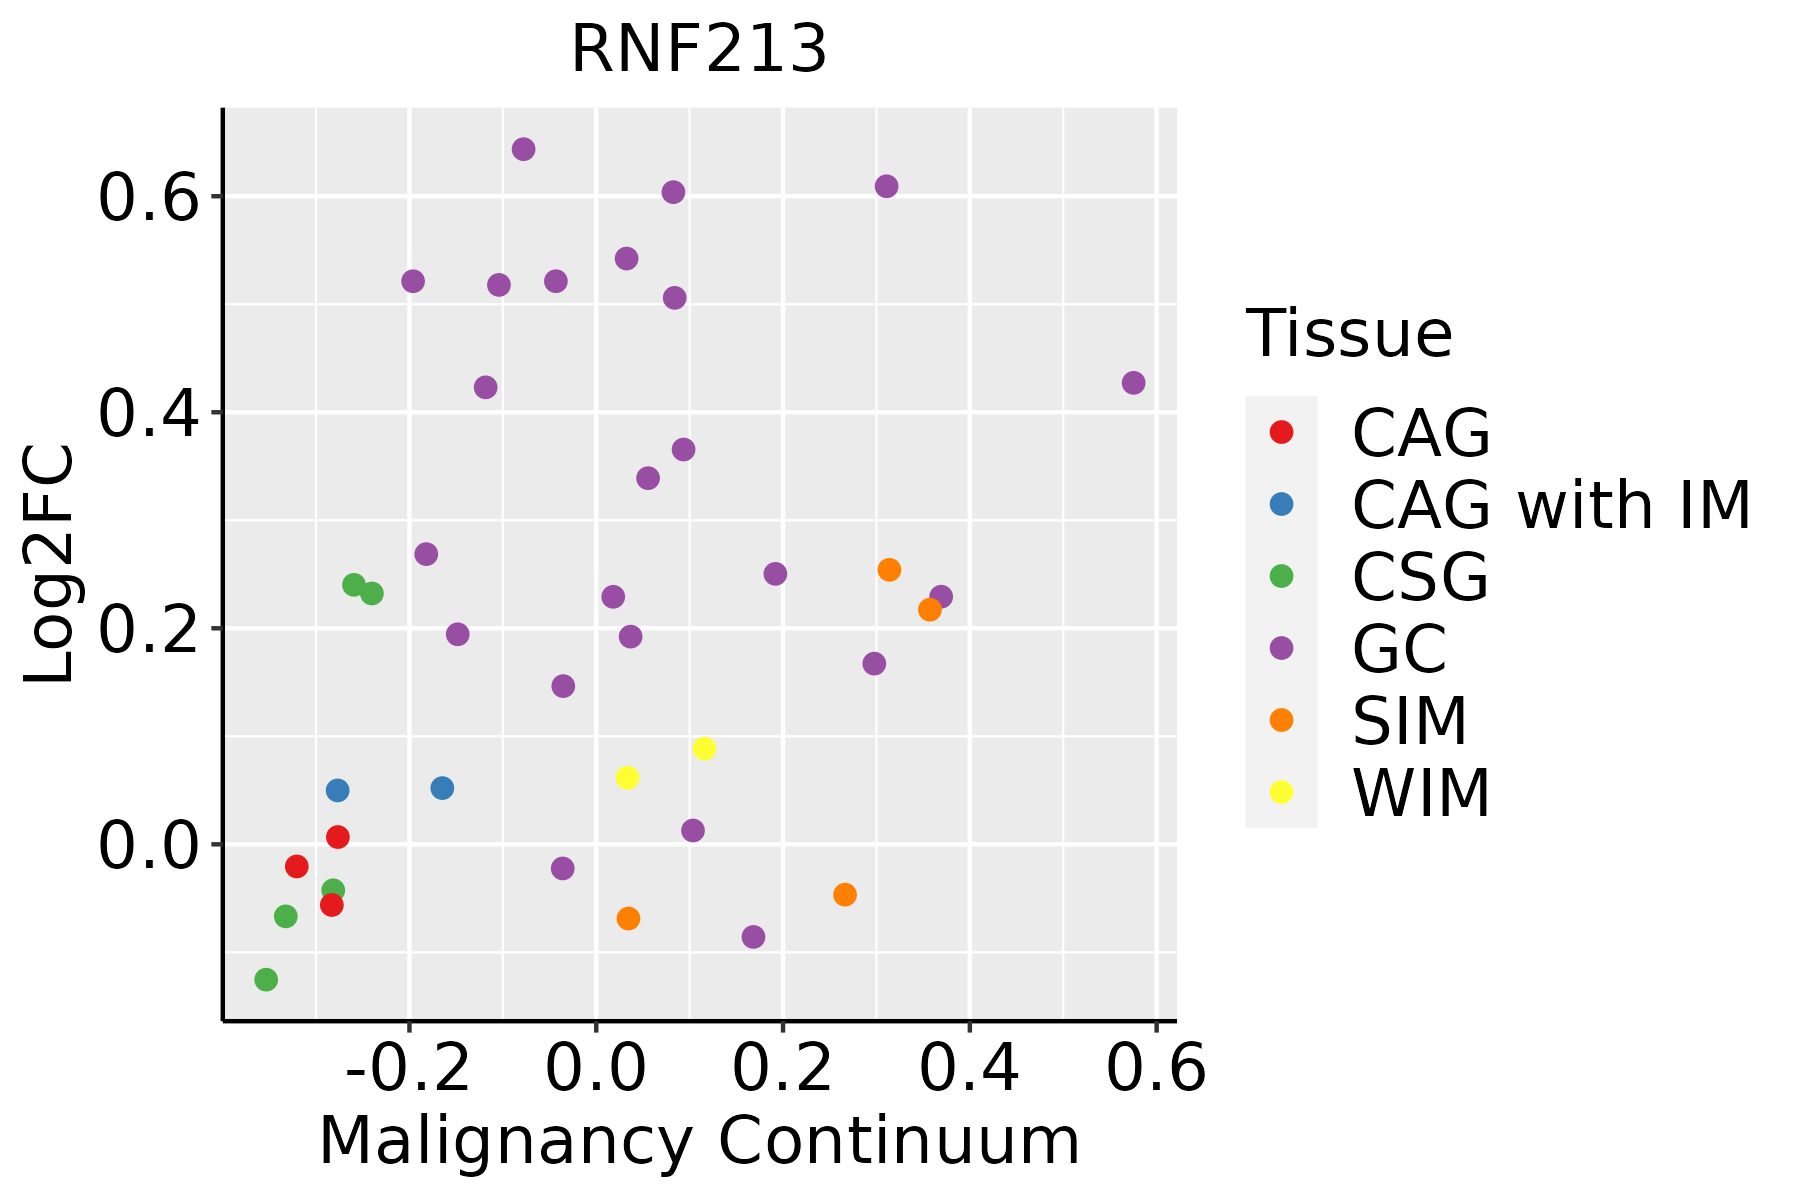 | CAG: Chronic atrophic gastritis |
| CAG with IM: Chronic atrophic gastritis with intestinal metaplasia |
| CSG: Chronic superficial gastritis |
| GC: Gastric cancer |
| SIM: Severe intestinal metaplasia |
| WIM: Wild intestinal metaplasia |
| Liver | 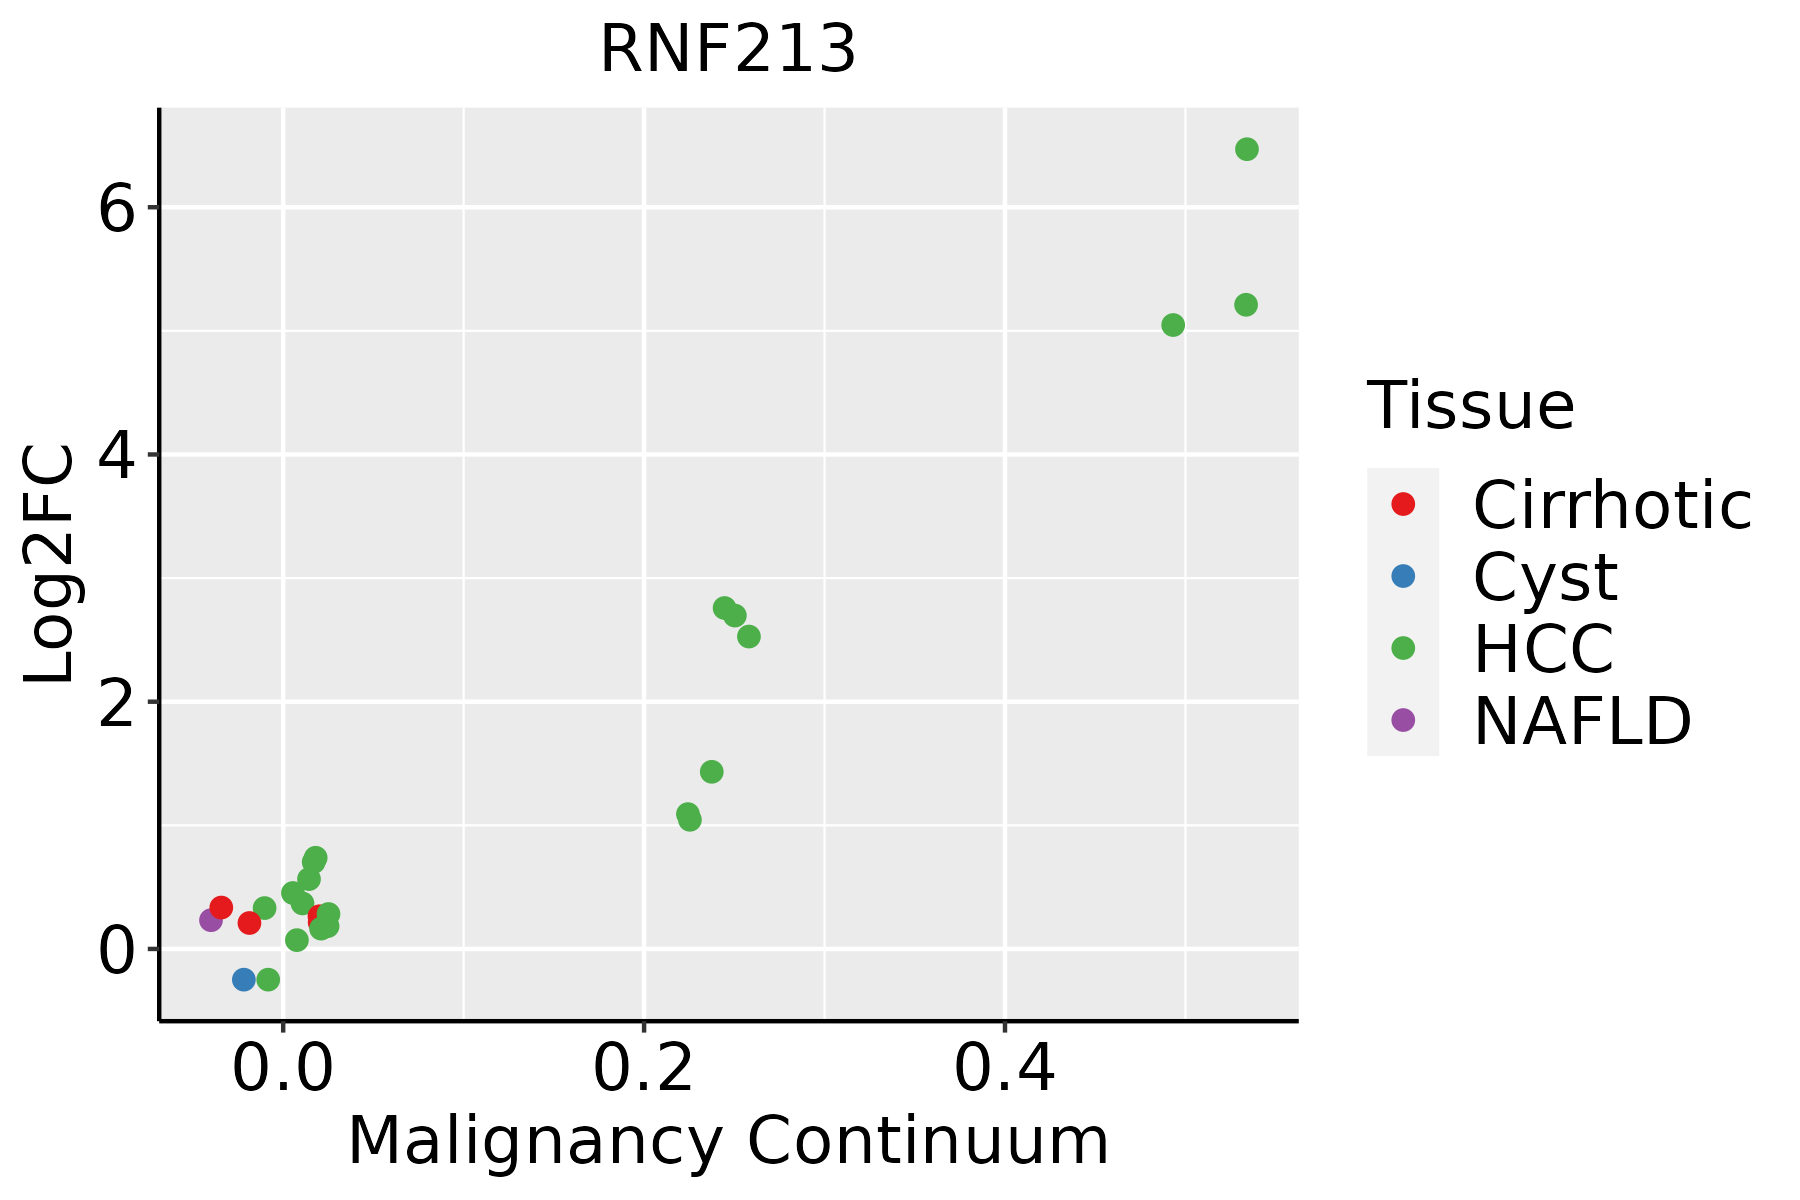 | HCC: Hepatocellular carcinoma |
| NAFLD: Non-alcoholic fatty liver disease |
| Lung | 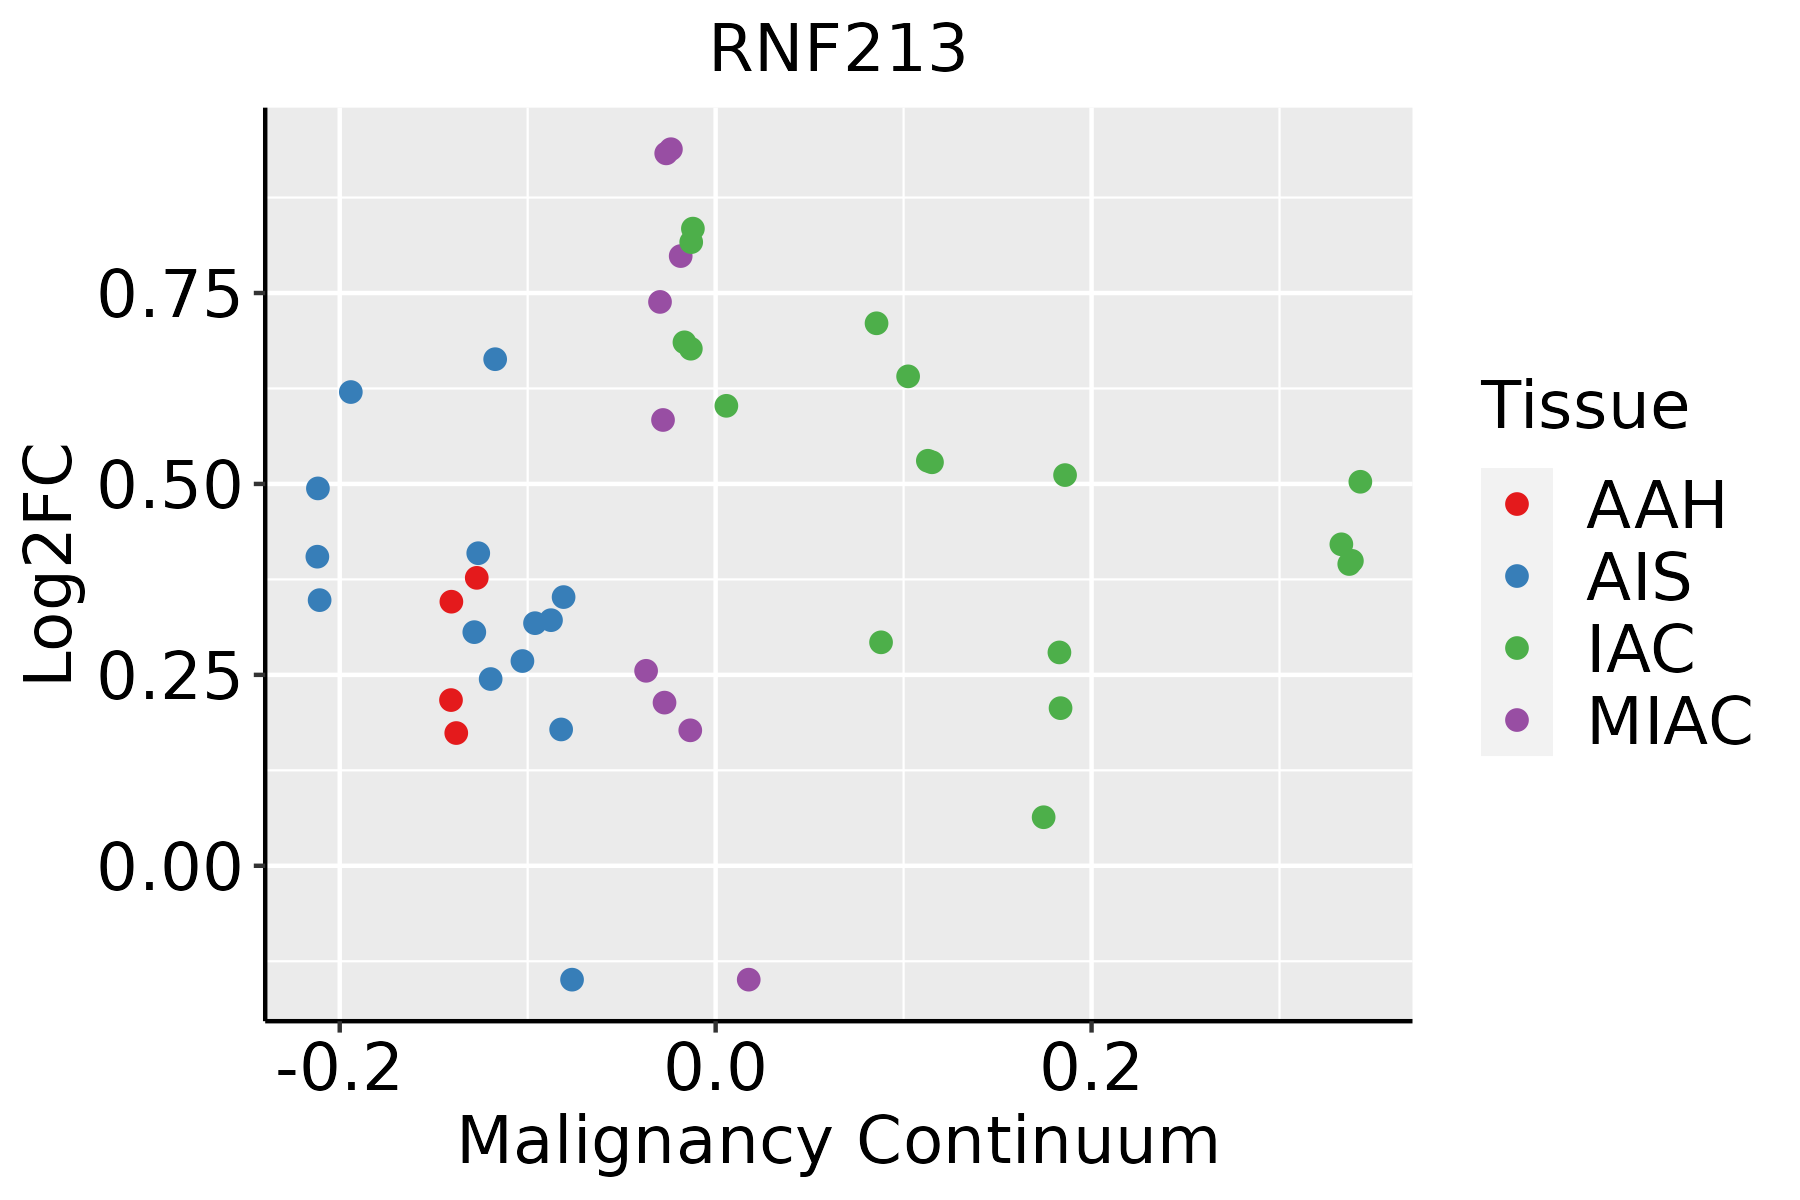 | AAH: Atypical adenomatous hyperplasia |
| AIS: Adenocarcinoma in situ |
| IAC: Invasive lung adenocarcinoma |
| MIA: Minimally invasive adenocarcinoma |
| Oral Cavity | 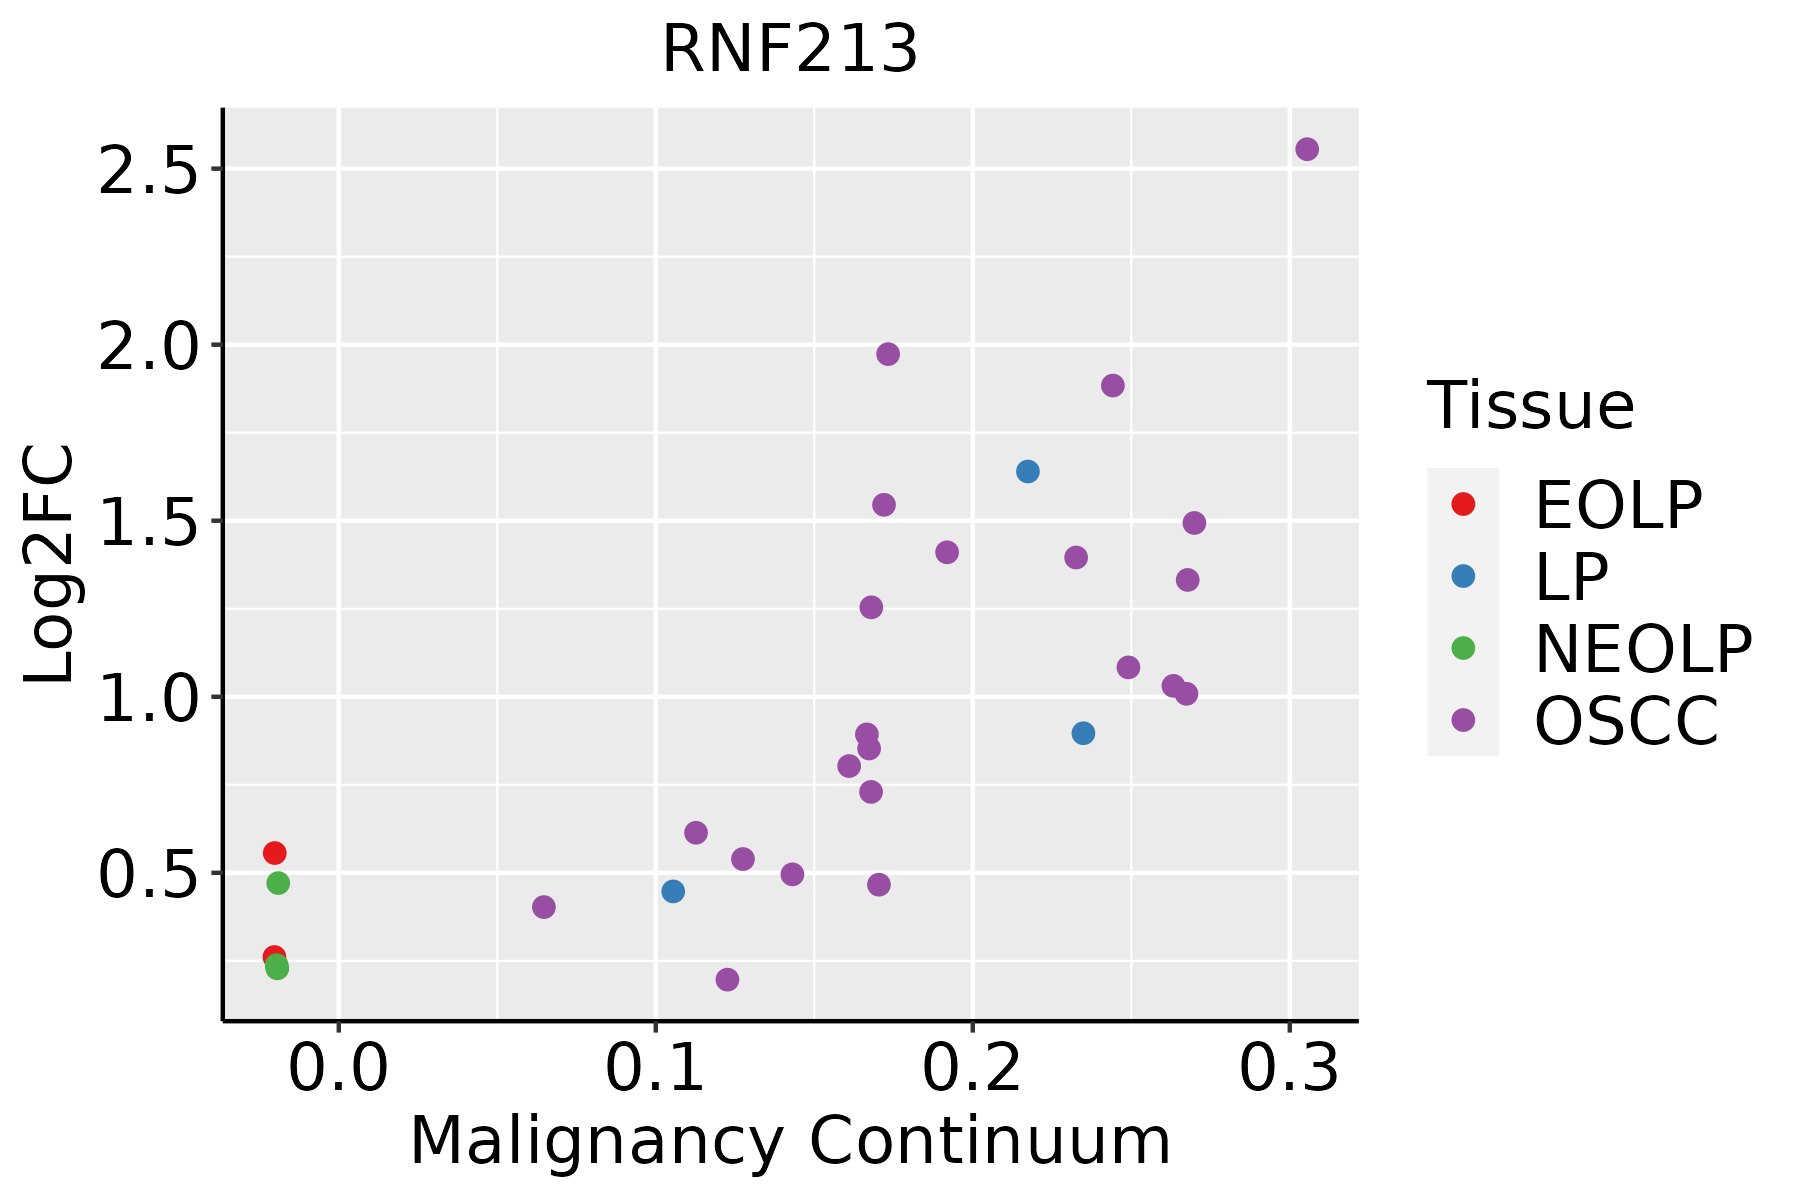 | EOLP: Erosive Oral lichen planus |
| LP: leukoplakia |
| NEOLP: Non-erosive oral lichen planus |
| OSCC: Oral squamous cell carcinoma |
| Prostate |  | BPH: Benign Prostatic Hyperplasia |
| Skin | 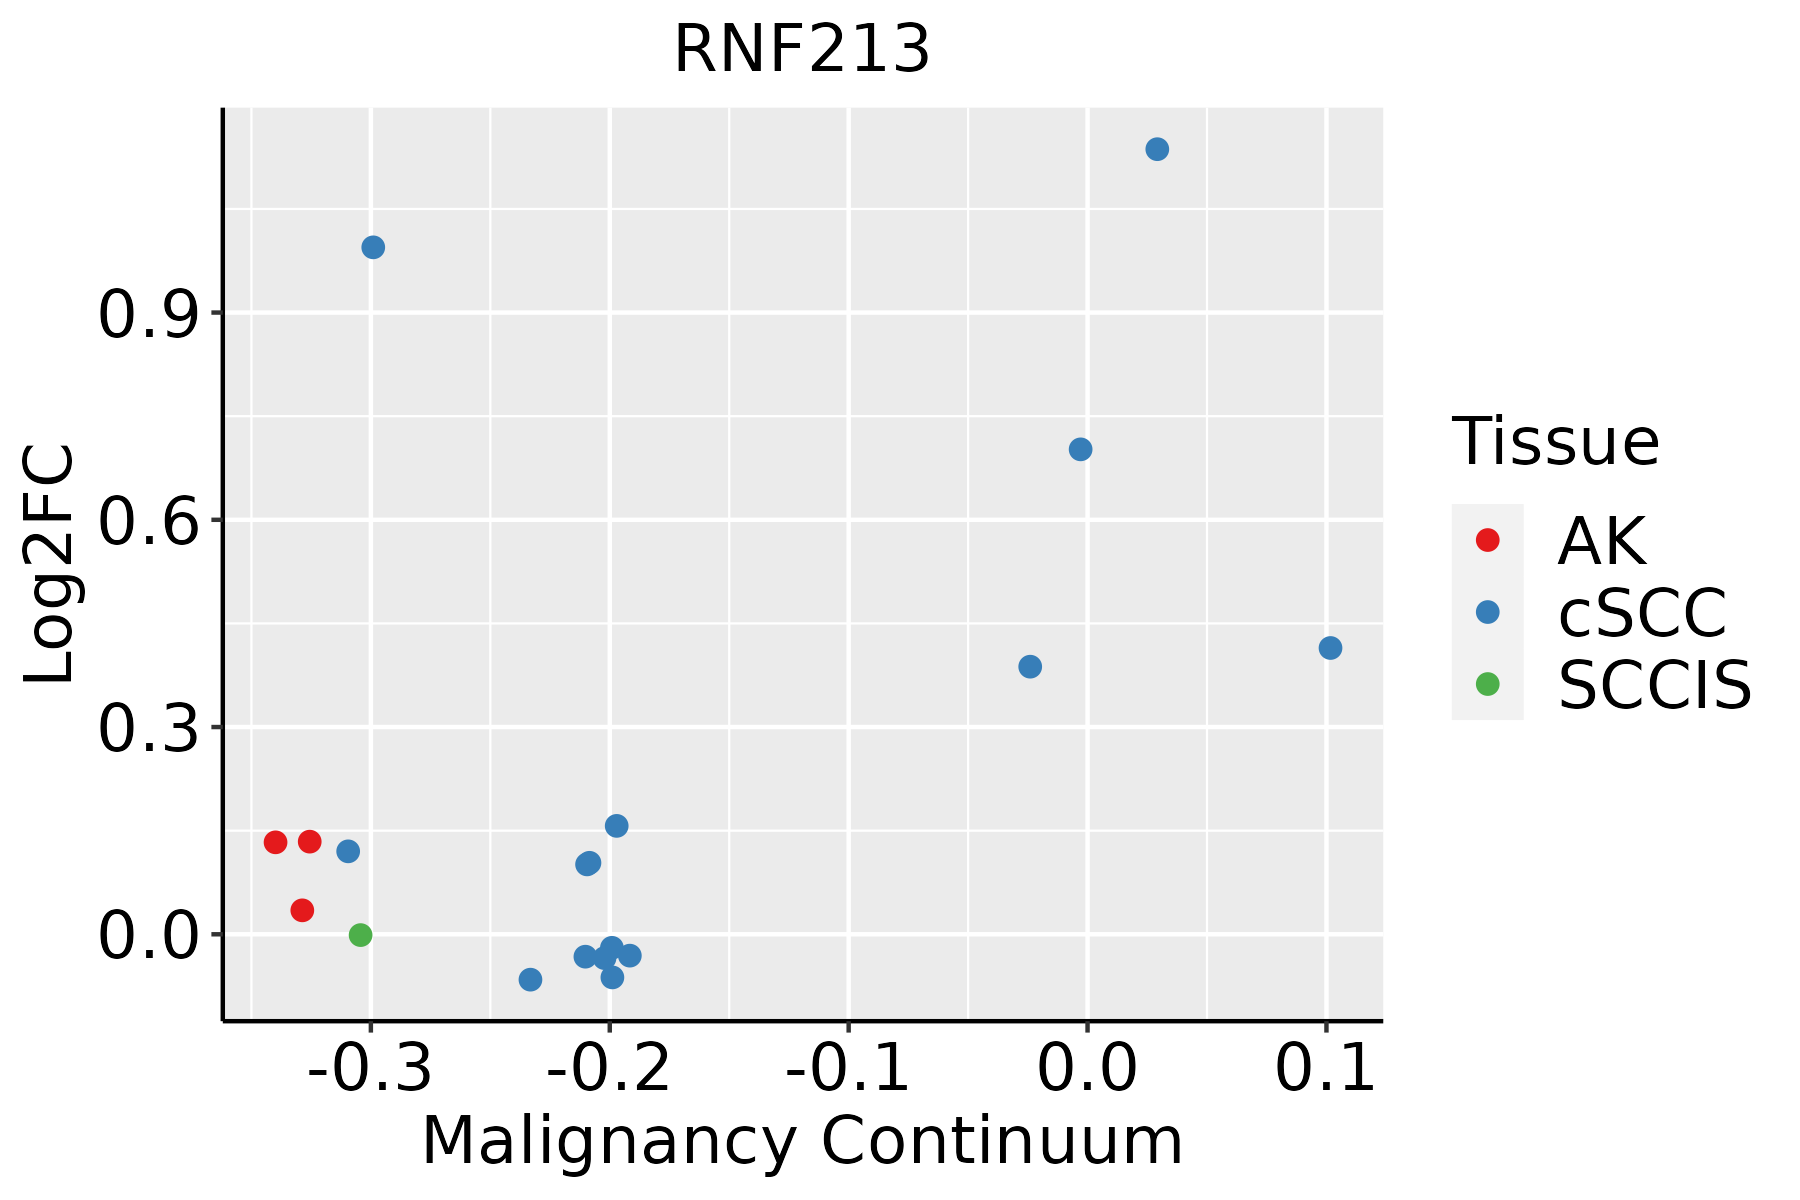 | AK: Actinic keratosis |
| cSCC: Cutaneous squamous cell carcinoma |
| SCCIS:squamous cell carcinoma in situ |
| Thyroid |  | ATC: Anaplastic thyroid cancer |
| HT: Hashimoto's thyroiditis |
| PTC: Papillary thyroid cancer |
| GO ID | Tissue | Disease Stage | Description | Gene Ratio | Bg Ratio | pvalue | p.adjust | Count |
| GO:00160557 | Cervix | CC | Wnt signaling pathway | 98/2311 | 444/18723 | 4.82e-09 | 4.65e-07 | 98 |
| GO:01987387 | Cervix | CC | cell-cell signaling by wnt | 98/2311 | 446/18723 | 6.16e-09 | 5.58e-07 | 98 |
| GO:00301117 | Cervix | CC | regulation of Wnt signaling pathway | 76/2311 | 328/18723 | 3.05e-08 | 2.08e-06 | 76 |
| GO:00301784 | Cervix | CC | negative regulation of Wnt signaling pathway | 35/2311 | 170/18723 | 1.52e-03 | 1.17e-02 | 35 |
| GO:00518656 | Cervix | CC | protein autoubiquitination | 17/2311 | 73/18723 | 6.71e-03 | 3.70e-02 | 17 |
| GO:00301118 | Endometrium | AEH | regulation of Wnt signaling pathway | 71/2100 | 328/18723 | 3.31e-08 | 1.87e-06 | 71 |
| GO:00160558 | Endometrium | AEH | Wnt signaling pathway | 85/2100 | 444/18723 | 4.99e-07 | 1.97e-05 | 85 |
| GO:01987388 | Endometrium | AEH | cell-cell signaling by wnt | 85/2100 | 446/18723 | 6.07e-07 | 2.29e-05 | 85 |
| GO:00301785 | Endometrium | AEH | negative regulation of Wnt signaling pathway | 34/2100 | 170/18723 | 5.63e-04 | 5.62e-03 | 34 |
| GO:003011113 | Endometrium | EEC | regulation of Wnt signaling pathway | 74/2168 | 328/18723 | 1.03e-08 | 6.47e-07 | 74 |
| GO:001605513 | Endometrium | EEC | Wnt signaling pathway | 90/2168 | 444/18723 | 6.65e-08 | 3.50e-06 | 90 |
| GO:019873813 | Endometrium | EEC | cell-cell signaling by wnt | 90/2168 | 446/18723 | 8.25e-08 | 4.23e-06 | 90 |
| GO:003017812 | Endometrium | EEC | negative regulation of Wnt signaling pathway | 35/2168 | 170/18723 | 4.84e-04 | 4.96e-03 | 35 |
| GO:003011116 | Esophagus | HGIN | regulation of Wnt signaling pathway | 65/2587 | 328/18723 | 1.53e-03 | 1.77e-02 | 65 |
| GO:001605516 | Esophagus | HGIN | Wnt signaling pathway | 83/2587 | 444/18723 | 2.27e-03 | 2.33e-02 | 83 |
| GO:019873816 | Esophagus | HGIN | cell-cell signaling by wnt | 83/2587 | 446/18723 | 2.58e-03 | 2.55e-02 | 83 |
| GO:001605517 | Esophagus | ESCC | Wnt signaling pathway | 268/8552 | 444/18723 | 2.32e-10 | 6.58e-09 | 268 |
| GO:019873817 | Esophagus | ESCC | cell-cell signaling by wnt | 269/8552 | 446/18723 | 2.41e-10 | 6.79e-09 | 269 |
| GO:003011117 | Esophagus | ESCC | regulation of Wnt signaling pathway | 194/8552 | 328/18723 | 5.39e-07 | 7.14e-06 | 194 |
| GO:00518658 | Esophagus | ESCC | protein autoubiquitination | 47/8552 | 73/18723 | 9.72e-04 | 4.93e-03 | 47 |
| Hugo Symbol | Variant Class | Variant Classification | dbSNP RS | HGVSc | HGVSp | HGVSp Short | SWISSPROT | BIOTYPE | SIFT | PolyPhen | Tumor Sample Barcode | Tissue | Histology | Sex | Age | Stage | Therapy Types | Drugs | Outcome |
| RNF213 | SNV | Missense_Mutation | novel | c.11465N>A | p.Arg3822Lys | p.R3822K | | protein_coding | tolerated(0.7) | benign(0.049) | TCGA-5L-AAT1-01 | Breast | breast invasive carcinoma | Female | <65 | III/IV | Hormone Therapy | letrozol | SD |
| RNF213 | SNV | Missense_Mutation | novel | c.1146N>A | p.Phe382Leu | p.F382L | | protein_coding | deleterious(0.01) | benign(0.063) | TCGA-A2-A0CP-01 | Breast | breast invasive carcinoma | Female | <65 | I/II | Chemotherapy | cytoxan | SD |
| RNF213 | SNV | Missense_Mutation | rs776579145 | c.14665N>T | p.Arg4889Cys | p.R4889C | | protein_coding | deleterious(0.01) | possibly_damaging(0.781) | TCGA-A2-A0CW-01 | Breast | breast invasive carcinoma | Female | >=65 | I/II | Hormone Therapy | anastrozole | SD |
| RNF213 | SNV | Missense_Mutation | novel | c.15172N>T | p.Asp5058Tyr | p.D5058Y | | protein_coding | deleterious(0) | probably_damaging(0.917) | TCGA-A2-A0CX-01 | Breast | breast invasive carcinoma | Female | <65 | I/II | Chemotherapy | adriamycin | SD |
| RNF213 | SNV | Missense_Mutation | | c.9712N>A | p.Gly3238Ser | p.G3238S | | protein_coding | tolerated(0.19) | benign(0.253) | TCGA-A8-A095-01 | Breast | breast invasive carcinoma | Female | <65 | I/II | Chemotherapy | 5-fluorouracil | CR |
| RNF213 | SNV | Missense_Mutation | rs769984642 | c.7425N>C | p.Lys2475Asn | p.K2475N | | protein_coding | deleterious(0.01) | possibly_damaging(0.894) | TCGA-A8-A0A4-01 | Breast | breast invasive carcinoma | Female | >=65 | I/II | Hormone Therapy | tamoxiphen | CR |
| RNF213 | SNV | Missense_Mutation | | c.15067N>A | p.Glu5023Lys | p.E5023K | | protein_coding | deleterious(0.01) | benign(0.249) | TCGA-AC-A23H-01 | Breast | breast invasive carcinoma | Female | >=65 | I/II | Unknown | Unknown | PD |
| RNF213 | SNV | Missense_Mutation | novel | c.8727N>T | p.Glu2909Asp | p.E2909D | | protein_coding | deleterious(0) | possibly_damaging(0.781) | TCGA-AC-A5EH-01 | Breast | breast invasive carcinoma | Female | >=65 | I/II | Unknown | Unknown | SD |
| RNF213 | SNV | Missense_Mutation | | c.14951A>G | p.Asp4984Gly | p.D4984G | | protein_coding | deleterious(0.04) | probably_damaging(0.913) | TCGA-B6-A0I6-01 | Breast | breast invasive carcinoma | Female | <65 | I/II | Unknown | Unknown | PD |
| RNF213 | SNV | Missense_Mutation | novel | c.7678N>G | p.Pro2560Ala | p.P2560A | | protein_coding | deleterious(0) | probably_damaging(1) | TCGA-BH-A0B6-01 | Breast | breast invasive carcinoma | Female | <65 | I/II | Unknown | Unknown | SD |


