
|
|||||
|
 | |
| |
| |
| |
| |
| |
|
Gene: RNF212 |
Gene summary for RNF212 |
| Gene information | Species | Human | Gene symbol | RNF212 | Gene ID | 285498 |
| Gene name | ring finger protein 212 | |
| Gene Alias | ZHP3 | |
| Cytomap | 4p16.3 | |
| Gene Type | protein-coding | GO ID | GO:0000003 | UniProtAcc | Q495C1 |
Top |
Malignant transformation analysis |
| Identification of the aberrant gene expression in precancerous and cancerous lesions by comparing the gene expression of stem-like cells in diseased tissues with normal stem cells |
| Entrez ID | Symbol | Replicates | Species | Organ | Tissue | Adj P-value | Log2FC | Malignancy |
| 285498 | RNF212 | CA_HPV_2 | Human | Cervix | CC | 3.40e-02 | 7.81e-02 | 0.0391 |
| 285498 | RNF212 | CA_HPV_3 | Human | Cervix | CC | 4.00e-05 | 1.18e-01 | 0.0414 |
| 285498 | RNF212 | HSIL_HPV_2 | Human | Cervix | HSIL_HPV | 1.40e-02 | 1.18e-01 | 0.0208 |
| 285498 | RNF212 | CCI_1 | Human | Cervix | CC | 2.38e-13 | 8.63e-01 | 0.528 |
| 285498 | RNF212 | CCI_3 | Human | Cervix | CC | 1.84e-11 | 5.07e-01 | 0.516 |
| 285498 | RNF212 | Tumor | Human | Cervix | CC | 4.02e-10 | 1.84e-01 | 0.1241 |
| 285498 | RNF212 | sample3 | Human | Cervix | CC | 1.95e-07 | 1.75e-01 | 0.1387 |
| 285498 | RNF212 | T1 | Human | Cervix | CC | 2.58e-02 | 1.29e-01 | 0.0918 |
| 285498 | RNF212 | T3 | Human | Cervix | CC | 8.77e-10 | 1.71e-01 | 0.1389 |
| 285498 | RNF212 | LZE6T | Human | Esophagus | ESCC | 5.27e-03 | 2.38e-01 | 0.0845 |
| 285498 | RNF212 | P2T-E | Human | Esophagus | ESCC | 2.20e-17 | 4.05e-01 | 0.1177 |
| 285498 | RNF212 | P10T-E | Human | Esophagus | ESCC | 2.07e-05 | 1.79e-01 | 0.116 |
| 285498 | RNF212 | P27T-E | Human | Esophagus | ESCC | 4.80e-04 | 1.26e-01 | 0.1055 |
| 285498 | RNF212 | P28T-E | Human | Esophagus | ESCC | 5.07e-27 | 5.19e-01 | 0.1149 |
| 285498 | RNF212 | P30T-E | Human | Esophagus | ESCC | 2.20e-02 | 1.20e-01 | 0.137 |
| 285498 | RNF212 | P32T-E | Human | Esophagus | ESCC | 1.85e-02 | 1.10e-01 | 0.1666 |
| 285498 | RNF212 | P36T-E | Human | Esophagus | ESCC | 4.95e-14 | 4.35e-01 | 0.1187 |
| 285498 | RNF212 | P47T-E | Human | Esophagus | ESCC | 1.88e-02 | 1.40e-01 | 0.1067 |
| 285498 | RNF212 | P48T-E | Human | Esophagus | ESCC | 1.25e-02 | 1.11e-01 | 0.0959 |
| 285498 | RNF212 | P56T-E | Human | Esophagus | ESCC | 6.62e-16 | 1.32e+00 | 0.1613 |
| Page: 1 2 3 |
| Tissue | Expression Dynamics | Abbreviation |
| Cervix |  | CC: Cervix cancer |
| HSIL_HPV: HPV-infected high-grade squamous intraepithelial lesions | ||
| N_HPV: HPV-infected normal cervix | ||
| Esophagus | 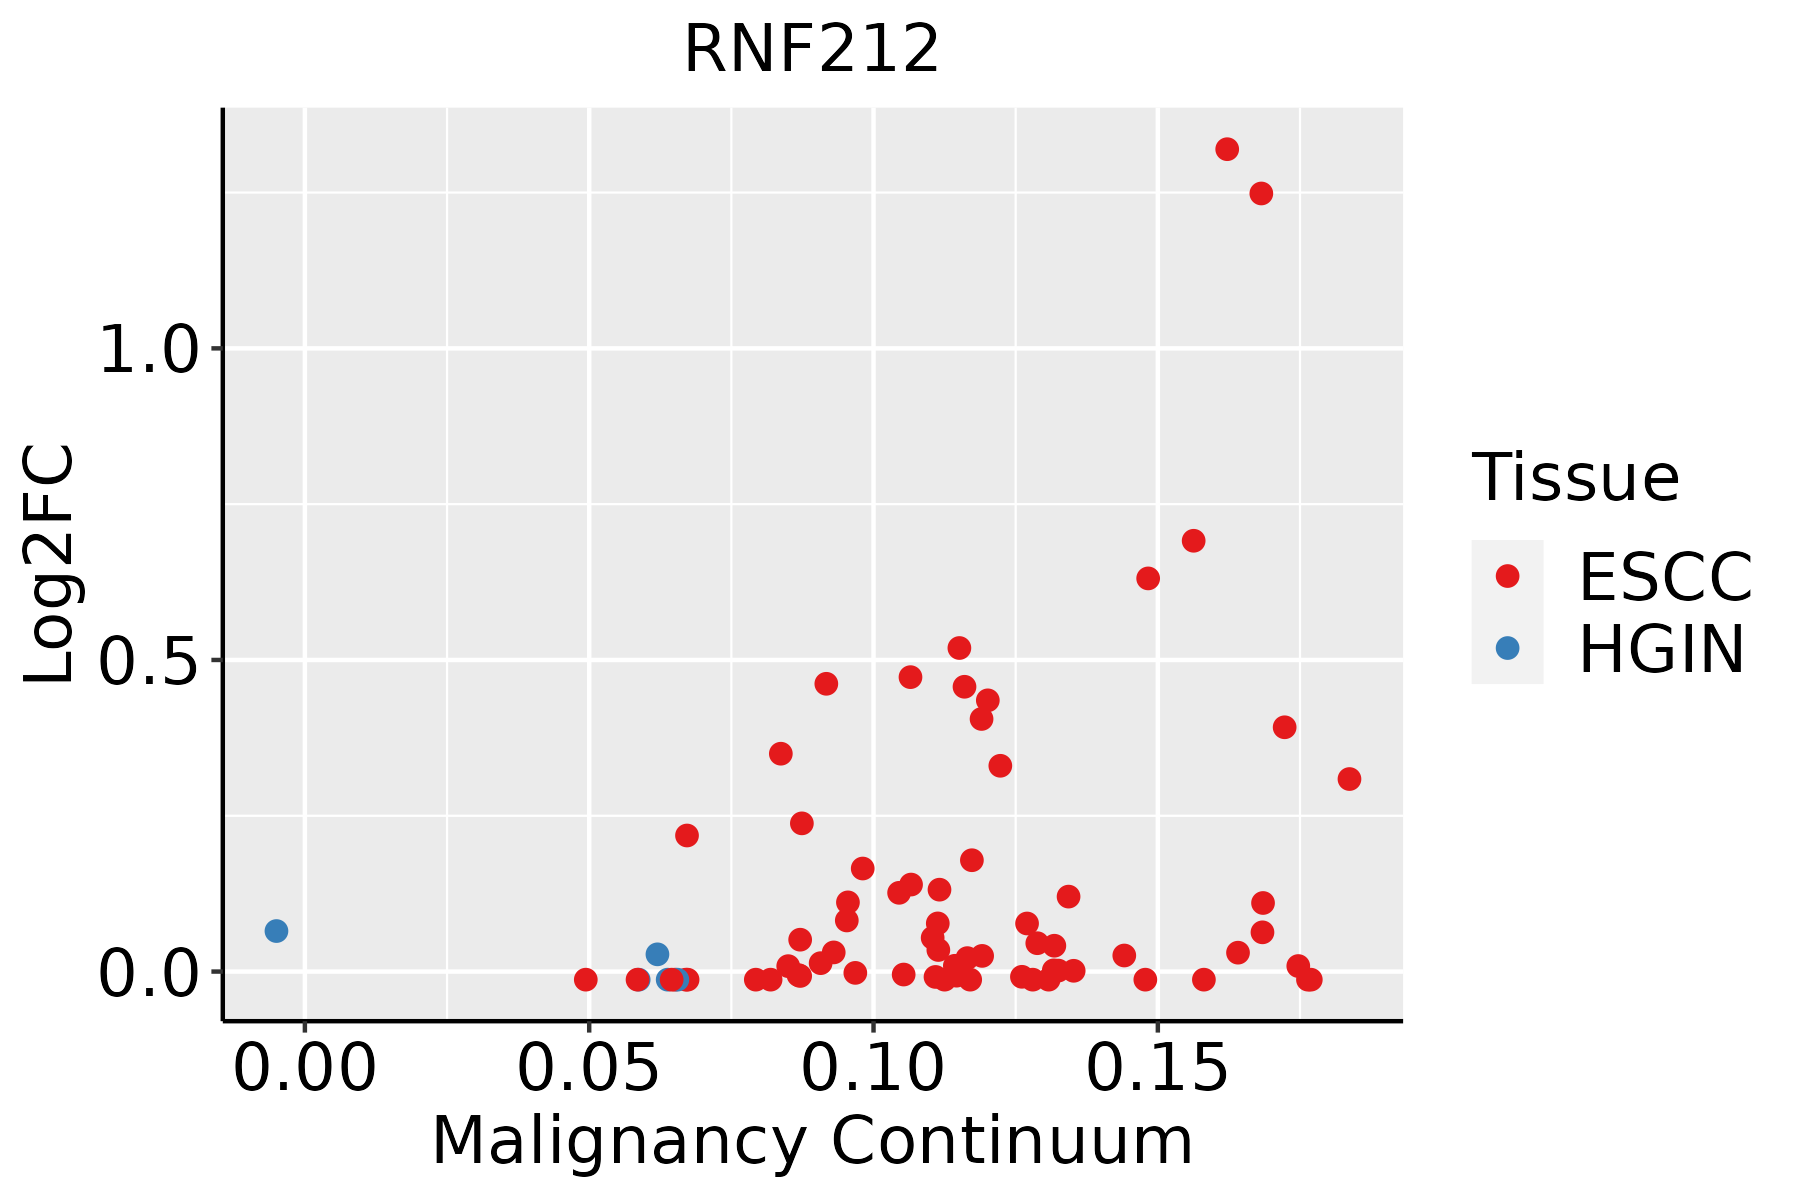 | ESCC: Esophageal squamous cell carcinoma |
| HGIN: High-grade intraepithelial neoplasias | ||
| LGIN: Low-grade intraepithelial neoplasias | ||
| Oral Cavity | 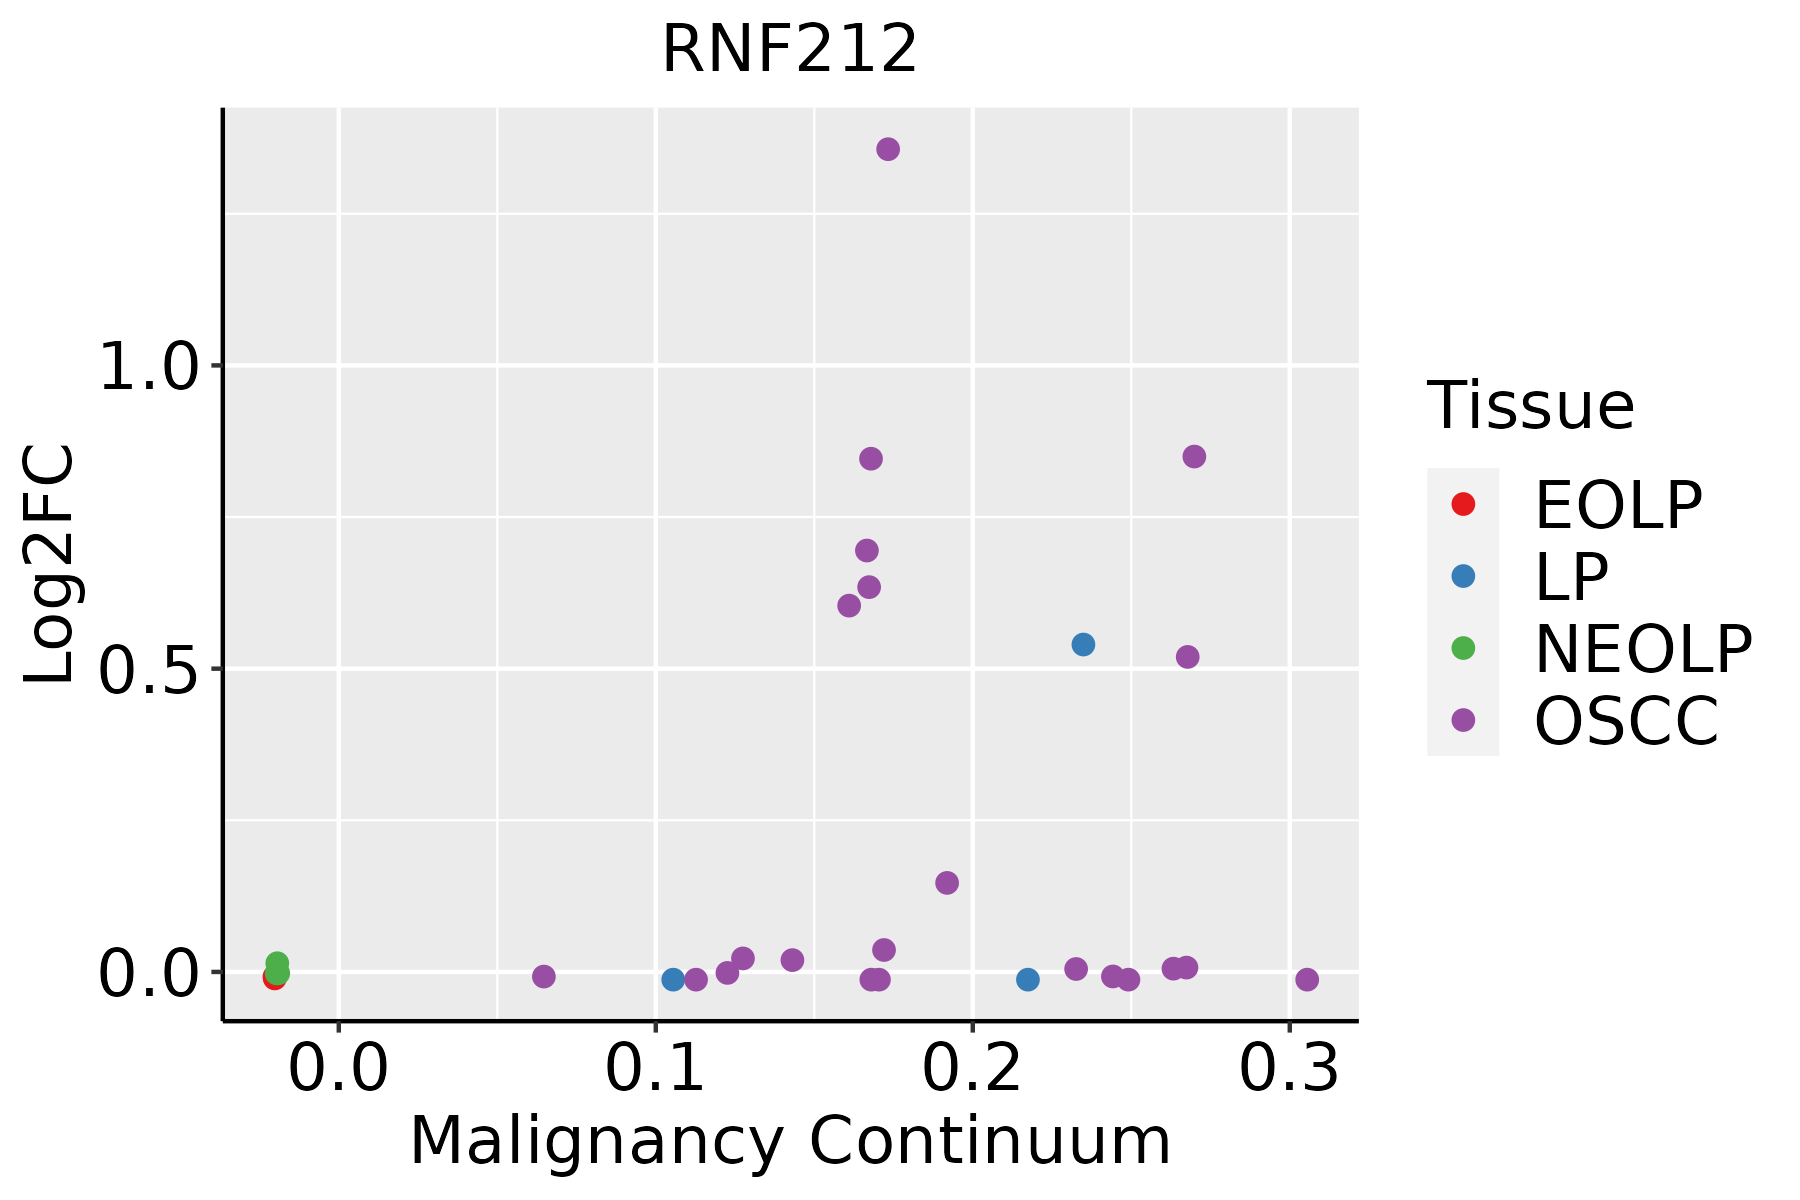 | EOLP: Erosive Oral lichen planus |
| LP: leukoplakia | ||
| NEOLP: Non-erosive oral lichen planus | ||
| OSCC: Oral squamous cell carcinoma | ||
| Thyroid |  | ATC: Anaplastic thyroid cancer |
| HT: Hashimoto's thyroiditis | ||
| PTC: Papillary thyroid cancer |
| ∗log2FC in expression of this searched gene in stem-like cells from each diseased tissue sample relative to stem-like cells in normal samples in each tissue plotted against the malignancy continuum. Samples are colored based on if they are from different disease stage. |
Top |
Malignant transformation related pathway analysis |
| Find out the enriched GO biological processes and KEGG pathways involved in transition from healthy to precancer to cancer |
| Tissue | Disease Stage | Enriched GO biological Processes |
| Colorectum | AD |  |
| Colorectum | SER |  |
| Colorectum | MSS |  |
| Colorectum | MSI-H |  |
| Colorectum | FAP |  |
| ∗Top 15 enriched GO BP terms are showed in the bar plot of each disease state in each tissue. Each row represents a significant GO biological process which is colored according to the -log10(p.adjust). |
| Page: 1 2 3 4 5 6 7 8 9 |
| GO ID | Tissue | Disease Stage | Description | Gene Ratio | Bg Ratio | pvalue | p.adjust | Count |
| GO:00482851 | Cervix | CC | organelle fission | 78/2311 | 488/18723 | 9.70e-03 | 4.79e-02 | 78 |
| GO:00182054 | Cervix | CC | peptidyl-lysine modification | 62/2311 | 376/18723 | 1.04e-02 | 4.97e-02 | 62 |
| GO:001820514 | Esophagus | ESCC | peptidyl-lysine modification | 259/8552 | 376/18723 | 3.90e-20 | 5.26e-18 | 259 |
| GO:000705911 | Esophagus | ESCC | chromosome segregation | 238/8552 | 346/18723 | 1.72e-18 | 1.82e-16 | 238 |
| GO:00482853 | Esophagus | ESCC | organelle fission | 301/8552 | 488/18723 | 4.64e-13 | 2.12e-11 | 301 |
| GO:00988133 | Esophagus | ESCC | nuclear chromosome segregation | 187/8552 | 281/18723 | 1.00e-12 | 4.36e-11 | 187 |
| GO:00002802 | Esophagus | ESCC | nuclear division | 270/8552 | 439/18723 | 1.17e-11 | 4.24e-10 | 270 |
| GO:001692512 | Esophagus | ESCC | protein sumoylation | 41/8552 | 53/18723 | 2.49e-06 | 2.86e-05 | 41 |
| GO:00063101 | Esophagus | ESCC | DNA recombination | 168/8552 | 305/18723 | 5.58e-04 | 3.05e-03 | 168 |
| GO:00070592 | Oral cavity | OSCC | chromosome segregation | 206/7305 | 346/18723 | 5.82e-15 | 3.76e-13 | 206 |
| GO:00182056 | Oral cavity | OSCC | peptidyl-lysine modification | 216/7305 | 376/18723 | 2.32e-13 | 1.16e-11 | 216 |
| GO:00482852 | Oral cavity | OSCC | organelle fission | 265/7305 | 488/18723 | 3.22e-12 | 1.27e-10 | 265 |
| GO:00002801 | Oral cavity | OSCC | nuclear division | 237/7305 | 439/18723 | 9.62e-11 | 2.90e-09 | 237 |
| GO:00988132 | Oral cavity | OSCC | nuclear chromosome segregation | 162/7305 | 281/18723 | 1.56e-10 | 4.56e-09 | 162 |
| GO:00169253 | Oral cavity | OSCC | protein sumoylation | 33/7305 | 53/18723 | 5.11e-04 | 2.98e-03 | 33 |
| GO:0006310 | Oral cavity | OSCC | DNA recombination | 147/7305 | 305/18723 | 6.33e-04 | 3.56e-03 | 147 |
| GO:001820513 | Oral cavity | LP | peptidyl-lysine modification | 136/4623 | 376/18723 | 3.64e-07 | 1.06e-05 | 136 |
| GO:00070591 | Oral cavity | LP | chromosome segregation | 117/4623 | 346/18723 | 7.61e-05 | 9.91e-04 | 117 |
| GO:001692511 | Oral cavity | LP | protein sumoylation | 24/4623 | 53/18723 | 8.55e-04 | 7.45e-03 | 24 |
| GO:004828511 | Oral cavity | LP | organelle fission | 145/4623 | 488/18723 | 6.02e-03 | 3.57e-02 | 145 |
| Page: 1 2 |
| Pathway ID | Tissue | Disease Stage | Description | Gene Ratio | Bg Ratio | pvalue | p.adjust | qvalue | Count |
| Page: 1 |
Top |
Cell-cell communication analysis |
| Identification of potential cell-cell interactions between two cell types and their ligand-receptor pairs for different disease states |
| Ligand | Receptor | LRpair | Pathway | Tissue | Disease Stage |
| Page: 1 |
Top |
Single-cell gene regulatory network inference analysis |
| Find out the significant the regulons (TFs) and the target genes of each regulon across cell types for different disease states |
| TF | Cell Type | Tissue | Disease Stage | Target Gene | RSS | Regulon Activity |
| ∗The dot plots of a searched regulon are shown for all cell subpopulations in each disease state of each tissue based on the regulon specific score inferred using pySCENIC and by calculating the average expression. |
| Page: 1 |
Top |
Somatic mutation of malignant transformation related genes |
| Annotation of somatic variants for genes involved in malignant transformation |
| Hugo Symbol | Variant Class | Variant Classification | dbSNP RS | HGVSc | HGVSp | HGVSp Short | SWISSPROT | BIOTYPE | SIFT | PolyPhen | Tumor Sample Barcode | Tissue | Histology | Sex | Age | Stage | Therapy Types | Drugs | Outcome |
| RNF212 | SNV | Missense_Mutation | novel | c.535N>G | p.Arg179Gly | p.R179G | Q495C1 | protein_coding | deleterious(0) | probably_damaging(0.994) | TCGA-A8-A09Q-01 | Breast | breast invasive carcinoma | Female | >=65 | III/IV | Hormone Therapy | anastrozole | SD |
| RNF212 | deletion | Frame_Shift_Del | novel | c.798delN | p.Phe267SerfsTer39 | p.F267Sfs*39 | Q495C1 | protein_coding | TCGA-D8-A27V-01 | Breast | breast invasive carcinoma | Female | <65 | I/II | Hormone Therapy | tamoxiphen | SD | ||
| RNF212 | SNV | Missense_Mutation | c.259N>G | p.Gln87Glu | p.Q87E | Q495C1 | protein_coding | deleterious(0.01) | probably_damaging(0.98) | TCGA-EK-A2PG-01 | Cervix | cervical & endocervical cancer | Female | >=65 | I/II | Unknown | Unknown | SD | |
| RNF212 | SNV | Missense_Mutation | novel | c.535N>G | p.Arg179Gly | p.R179G | Q495C1 | protein_coding | deleterious(0) | probably_damaging(0.994) | TCGA-AA-3695-01 | Colorectum | colon adenocarcinoma | Female | <65 | III/IV | Unknown | Unknown | SD |
| RNF212 | SNV | Missense_Mutation | c.473N>T | p.Ser158Leu | p.S158L | Q495C1 | protein_coding | tolerated(0.14) | benign(0.011) | TCGA-AA-3984-01 | Colorectum | colon adenocarcinoma | Female | <65 | I/II | Unknown | Unknown | SD | |
| RNF212 | SNV | Missense_Mutation | novel | c.863N>G | p.Leu288Arg | p.L288R | Q495C1 | protein_coding | deleterious_low_confidence(0) | possibly_damaging(0.766) | TCGA-AA-A00N-01 | Colorectum | colon adenocarcinoma | Male | >=65 | I/II | Unknown | Unknown | PD |
| RNF212 | SNV | Missense_Mutation | c.473N>T | p.Ser158Leu | p.S158L | Q495C1 | protein_coding | tolerated(0.14) | benign(0.011) | TCGA-AA-A010-01 | Colorectum | colon adenocarcinoma | Female | <65 | I/II | Chemotherapy | folinic | CR | |
| RNF212 | SNV | Missense_Mutation | c.838C>T | p.Pro280Ser | p.P280S | Q495C1 | protein_coding | deleterious_low_confidence(0) | benign(0) | TCGA-AZ-6599-01 | Colorectum | colon adenocarcinoma | Male | >=65 | I/II | Unknown | Unknown | SD | |
| RNF212 | SNV | Missense_Mutation | c.454N>T | p.Ala152Ser | p.A152S | Q495C1 | protein_coding | tolerated(0.2) | benign(0.05) | TCGA-AG-A011-01 | Colorectum | rectum adenocarcinoma | Male | >=65 | I/II | Unknown | Unknown | SD | |
| RNF212 | SNV | Missense_Mutation | c.760C>A | p.Pro254Thr | p.P254T | Q495C1 | protein_coding | deleterious_low_confidence(0) | benign(0.023) | TCGA-A5-A0G2-01 | Endometrium | uterine corpus endometrioid carcinoma | Female | <65 | III/IV | Unknown | Unknown | SD |
| Page: 1 2 3 4 |
Top |
Related drugs of malignant transformation related genes |
| Identification of chemicals and drugs interact with genes involved in malignant transfromation |
| (DGIdb 4.0) |
| Entrez ID | Symbol | Category | Interaction Types | Drug Claim Name | Drug Name | PMIDs |
| Page: 1 |

Copyright 2023-Present -The University of Texas Health Science Center at Houston |