
|
|||||
|
 | |
| |
| |
| |
| |
| |
|
Gene: RNF20 |
Gene summary for RNF20 |
| Gene information | Species | Human | Gene symbol | RNF20 | Gene ID | 56254 |
| Gene name | ring finger protein 20 | |
| Gene Alias | BRE1 | |
| Cytomap | 9q31.1 | |
| Gene Type | protein-coding | GO ID | GO:0000209 | UniProtAcc | Q5VTR2 |
Top |
Malignant transformation analysis |
| Identification of the aberrant gene expression in precancerous and cancerous lesions by comparing the gene expression of stem-like cells in diseased tissues with normal stem cells |
| Entrez ID | Symbol | Replicates | Species | Organ | Tissue | Adj P-value | Log2FC | Malignancy |
| 56254 | RNF20 | LZE2T | Human | Esophagus | ESCC | 3.18e-04 | 6.14e-01 | 0.082 |
| 56254 | RNF20 | LZE4T | Human | Esophagus | ESCC | 2.86e-15 | 4.02e-01 | 0.0811 |
| 56254 | RNF20 | LZE7T | Human | Esophagus | ESCC | 1.34e-08 | 3.29e-01 | 0.0667 |
| 56254 | RNF20 | LZE20T | Human | Esophagus | ESCC | 7.45e-04 | 1.26e-01 | 0.0662 |
| 56254 | RNF20 | LZE24T | Human | Esophagus | ESCC | 9.74e-14 | 3.16e-01 | 0.0596 |
| 56254 | RNF20 | LZE6T | Human | Esophagus | ESCC | 1.21e-04 | 2.43e-01 | 0.0845 |
| 56254 | RNF20 | P1T-E | Human | Esophagus | ESCC | 1.94e-07 | 3.26e-01 | 0.0875 |
| 56254 | RNF20 | P2T-E | Human | Esophagus | ESCC | 7.93e-32 | 5.46e-01 | 0.1177 |
| 56254 | RNF20 | P4T-E | Human | Esophagus | ESCC | 4.12e-10 | 2.77e-01 | 0.1323 |
| 56254 | RNF20 | P5T-E | Human | Esophagus | ESCC | 2.53e-04 | 1.30e-01 | 0.1327 |
| 56254 | RNF20 | P8T-E | Human | Esophagus | ESCC | 1.17e-12 | 1.75e-01 | 0.0889 |
| 56254 | RNF20 | P9T-E | Human | Esophagus | ESCC | 6.50e-09 | 2.14e-01 | 0.1131 |
| 56254 | RNF20 | P10T-E | Human | Esophagus | ESCC | 5.38e-14 | 2.63e-01 | 0.116 |
| 56254 | RNF20 | P11T-E | Human | Esophagus | ESCC | 3.05e-14 | 4.15e-01 | 0.1426 |
| 56254 | RNF20 | P12T-E | Human | Esophagus | ESCC | 7.78e-18 | 3.40e-01 | 0.1122 |
| 56254 | RNF20 | P15T-E | Human | Esophagus | ESCC | 1.76e-20 | 4.47e-01 | 0.1149 |
| 56254 | RNF20 | P16T-E | Human | Esophagus | ESCC | 1.71e-17 | 2.98e-01 | 0.1153 |
| 56254 | RNF20 | P17T-E | Human | Esophagus | ESCC | 1.51e-10 | 3.34e-01 | 0.1278 |
| 56254 | RNF20 | P20T-E | Human | Esophagus | ESCC | 1.85e-14 | 2.35e-01 | 0.1124 |
| 56254 | RNF20 | P21T-E | Human | Esophagus | ESCC | 6.95e-18 | 4.39e-01 | 0.1617 |
| Page: 1 2 3 4 5 |
| Tissue | Expression Dynamics | Abbreviation |
| Esophagus | 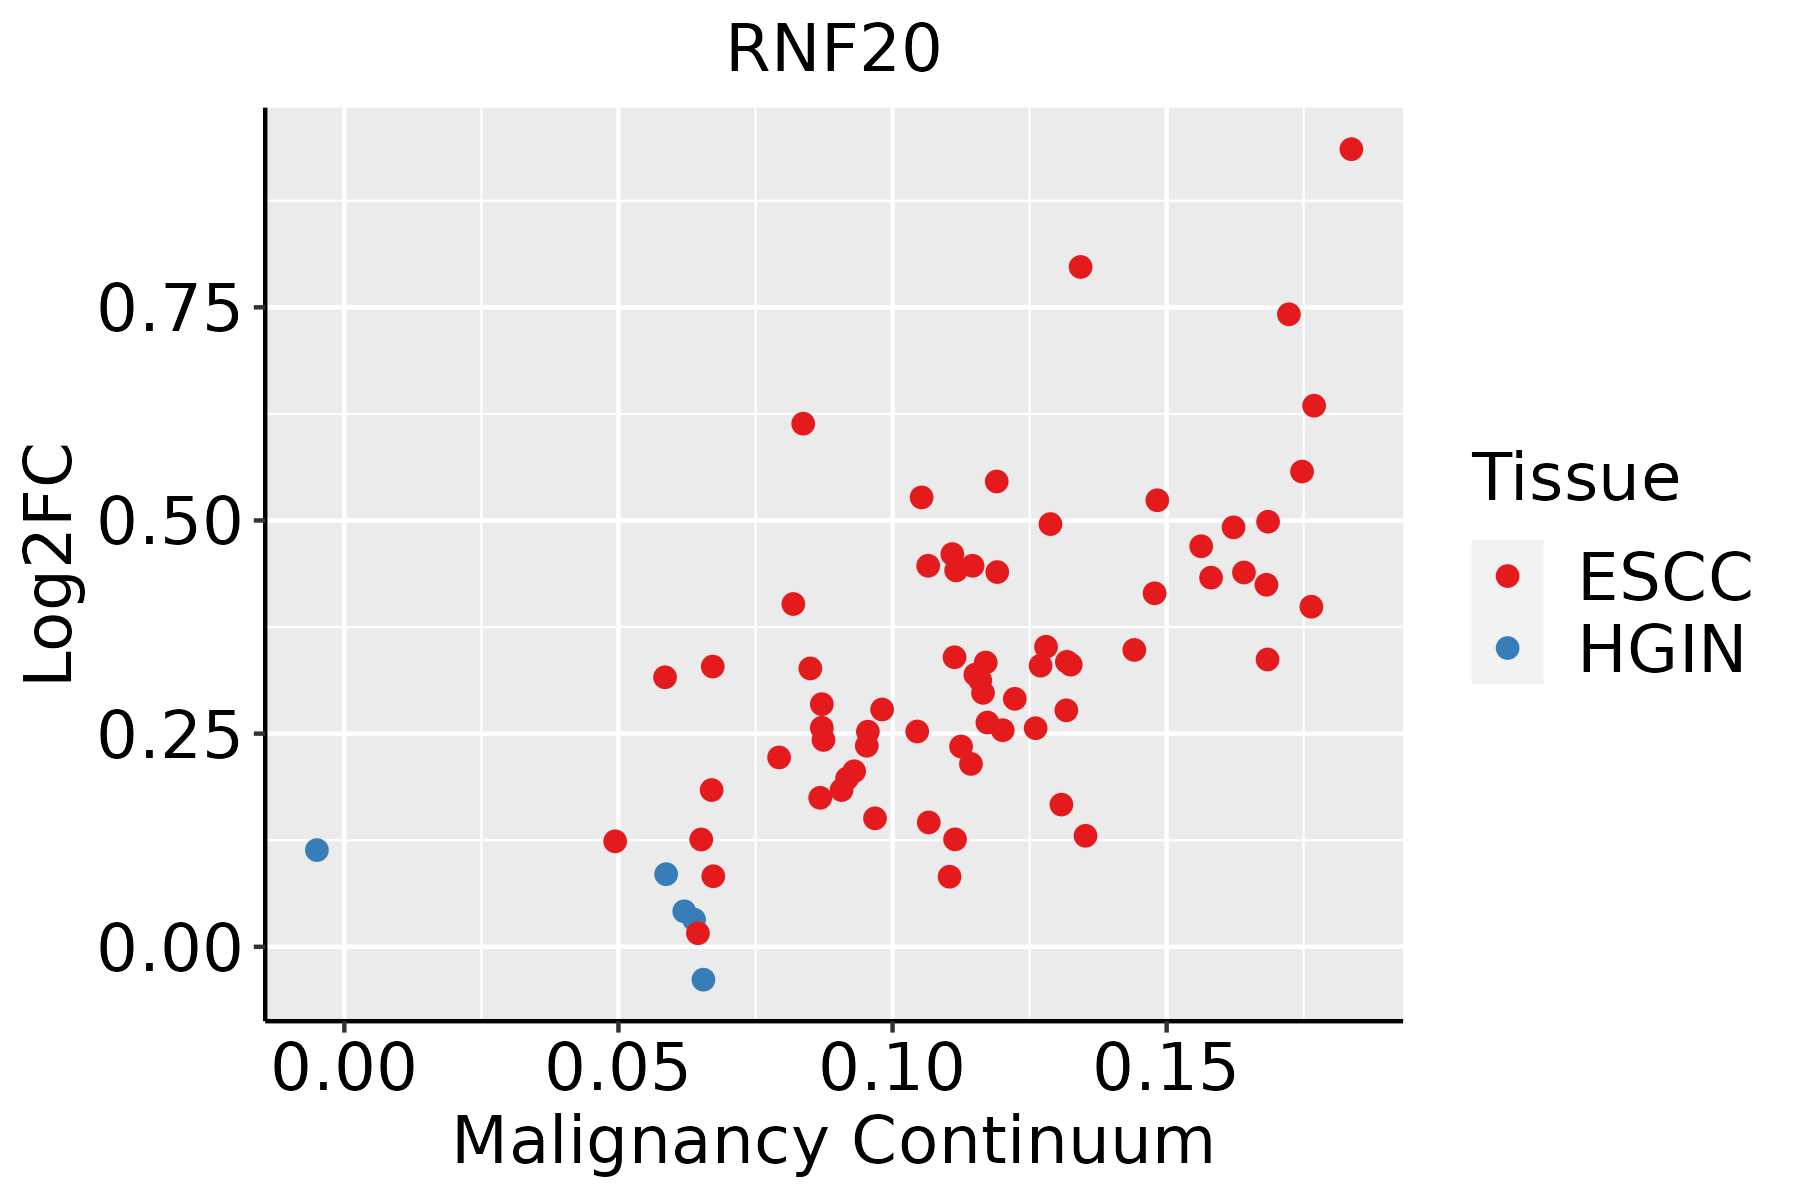 | ESCC: Esophageal squamous cell carcinoma |
| HGIN: High-grade intraepithelial neoplasias | ||
| LGIN: Low-grade intraepithelial neoplasias | ||
| Liver |  | HCC: Hepatocellular carcinoma |
| NAFLD: Non-alcoholic fatty liver disease | ||
| Oral Cavity |  | EOLP: Erosive Oral lichen planus |
| LP: leukoplakia | ||
| NEOLP: Non-erosive oral lichen planus | ||
| OSCC: Oral squamous cell carcinoma | ||
| Skin |  | AK: Actinic keratosis |
| cSCC: Cutaneous squamous cell carcinoma | ||
| SCCIS:squamous cell carcinoma in situ |
| ∗log2FC in expression of this searched gene in stem-like cells from each diseased tissue sample relative to stem-like cells in normal samples in each tissue plotted against the malignancy continuum. Samples are colored based on if they are from different disease stage. |
Top |
Malignant transformation related pathway analysis |
| Find out the enriched GO biological processes and KEGG pathways involved in transition from healthy to precancer to cancer |
| Tissue | Disease Stage | Enriched GO biological Processes |
| Colorectum | AD |  |
| Colorectum | SER |  |
| Colorectum | MSS |  |
| Colorectum | MSI-H |  |
| Colorectum | FAP |  |
| ∗Top 15 enriched GO BP terms are showed in the bar plot of each disease state in each tissue. Each row represents a significant GO biological process which is colored according to the -log10(p.adjust). |
| Page: 1 2 3 4 5 6 7 8 9 |
| GO ID | Tissue | Disease Stage | Description | Gene Ratio | Bg Ratio | pvalue | p.adjust | Count |
| GO:001657015 | Esophagus | ESCC | histone modification | 323/8552 | 463/18723 | 2.61e-26 | 7.88e-24 | 323 |
| GO:1903311110 | Esophagus | ESCC | regulation of mRNA metabolic process | 210/8552 | 288/18723 | 3.25e-21 | 5.56e-19 | 210 |
| GO:1903320111 | Esophagus | ESCC | regulation of protein modification by small protein conjugation or removal | 181/8552 | 242/18723 | 1.80e-20 | 2.60e-18 | 181 |
| GO:000020917 | Esophagus | ESCC | protein polyubiquitination | 170/8552 | 236/18723 | 1.40e-16 | 1.09e-14 | 170 |
| GO:0031396111 | Esophagus | ESCC | regulation of protein ubiquitination | 154/8552 | 210/18723 | 2.70e-16 | 2.04e-14 | 154 |
| GO:0050684110 | Esophagus | ESCC | regulation of mRNA processing | 109/8552 | 137/18723 | 3.51e-16 | 2.59e-14 | 109 |
| GO:00434143 | Esophagus | ESCC | macromolecule methylation | 199/8552 | 316/18723 | 3.44e-10 | 9.57e-09 | 199 |
| GO:190332216 | Esophagus | ESCC | positive regulation of protein modification by small protein conjugation or removal | 99/8552 | 138/18723 | 4.39e-10 | 1.16e-08 | 99 |
| GO:003105614 | Esophagus | ESCC | regulation of histone modification | 106/8552 | 152/18723 | 1.52e-09 | 3.55e-08 | 106 |
| GO:00322592 | Esophagus | ESCC | methylation | 222/8552 | 364/18723 | 2.26e-09 | 5.09e-08 | 222 |
| GO:00065136 | Esophagus | ESCC | protein monoubiquitination | 53/8552 | 67/18723 | 2.11e-08 | 4.03e-07 | 53 |
| GO:001657414 | Esophagus | ESCC | histone ubiquitination | 40/8552 | 47/18723 | 2.40e-08 | 4.55e-07 | 40 |
| GO:003139816 | Esophagus | ESCC | positive regulation of protein ubiquitination | 82/8552 | 119/18723 | 2.41e-07 | 3.64e-06 | 82 |
| GO:005068615 | Esophagus | ESCC | negative regulation of mRNA processing | 26/8552 | 29/18723 | 8.98e-07 | 1.15e-05 | 26 |
| GO:000647914 | Esophagus | ESCC | protein methylation | 115/8552 | 181/18723 | 9.07e-07 | 1.16e-05 | 115 |
| GO:000821314 | Esophagus | ESCC | protein alkylation | 115/8552 | 181/18723 | 9.07e-07 | 1.16e-05 | 115 |
| GO:00310583 | Esophagus | ESCC | positive regulation of histone modification | 65/8552 | 92/18723 | 1.04e-06 | 1.31e-05 | 65 |
| GO:003112412 | Esophagus | ESCC | mRNA 3'-end processing | 47/8552 | 62/18723 | 1.29e-06 | 1.58e-05 | 47 |
| GO:003144013 | Esophagus | ESCC | regulation of mRNA 3'-end processing | 25/8552 | 28/18723 | 1.77e-06 | 2.10e-05 | 25 |
| GO:00103904 | Esophagus | ESCC | histone monoubiquitination | 25/8552 | 29/18723 | 7.24e-06 | 7.20e-05 | 25 |
| Page: 1 2 3 4 5 6 |
| Pathway ID | Tissue | Disease Stage | Description | Gene Ratio | Bg Ratio | pvalue | p.adjust | qvalue | Count |
| Page: 1 |
Top |
Cell-cell communication analysis |
| Identification of potential cell-cell interactions between two cell types and their ligand-receptor pairs for different disease states |
| Ligand | Receptor | LRpair | Pathway | Tissue | Disease Stage |
| Page: 1 |
Top |
Single-cell gene regulatory network inference analysis |
| Find out the significant the regulons (TFs) and the target genes of each regulon across cell types for different disease states |
| TF | Cell Type | Tissue | Disease Stage | Target Gene | RSS | Regulon Activity |
| ∗The dot plots of a searched regulon are shown for all cell subpopulations in each disease state of each tissue based on the regulon specific score inferred using pySCENIC and by calculating the average expression. |
| Page: 1 |
Top |
Somatic mutation of malignant transformation related genes |
| Annotation of somatic variants for genes involved in malignant transformation |
| Hugo Symbol | Variant Class | Variant Classification | dbSNP RS | HGVSc | HGVSp | HGVSp Short | SWISSPROT | BIOTYPE | SIFT | PolyPhen | Tumor Sample Barcode | Tissue | Histology | Sex | Age | Stage | Therapy Types | Drugs | Outcome |
| RNF20 | SNV | Missense_Mutation | c.1621N>A | p.Glu541Lys | p.E541K | Q5VTR2 | protein_coding | tolerated(0.44) | benign(0.034) | TCGA-A2-A25A-01 | Breast | breast invasive carcinoma | Female | <65 | I/II | Unspecific | Cytoxan | SD | |
| RNF20 | SNV | Missense_Mutation | c.1270N>A | p.Glu424Lys | p.E424K | Q5VTR2 | protein_coding | tolerated(0.06) | probably_damaging(0.956) | TCGA-A8-A09I-01 | Breast | breast invasive carcinoma | Female | >=65 | I/II | Hormone Therapy | anastrozole | SD | |
| RNF20 | SNV | Missense_Mutation | c.1540N>T | p.Arg514Cys | p.R514C | Q5VTR2 | protein_coding | deleterious(0.02) | benign(0) | TCGA-AN-A04C-01 | Breast | breast invasive carcinoma | Female | <65 | I/II | Unknown | Unknown | SD | |
| RNF20 | SNV | Missense_Mutation | novel | c.547N>G | p.Arg183Gly | p.R183G | Q5VTR2 | protein_coding | tolerated(0.1) | benign(0.101) | TCGA-AN-A0G0-01 | Breast | breast invasive carcinoma | Female | <65 | I/II | Unknown | Unknown | SD |
| RNF20 | SNV | Missense_Mutation | c.266N>T | p.Ser89Leu | p.S89L | Q5VTR2 | protein_coding | tolerated(0.07) | probably_damaging(0.95) | TCGA-AR-A0TX-01 | Breast | breast invasive carcinoma | Female | <65 | I/II | Unknown | Unknown | SD | |
| RNF20 | SNV | Missense_Mutation | c.1291C>T | p.His431Tyr | p.H431Y | Q5VTR2 | protein_coding | deleterious(0) | benign(0.196) | TCGA-BH-A0DZ-01 | Breast | breast invasive carcinoma | Female | <65 | I/II | Chemotherapy | docetaxel | SD | |
| RNF20 | SNV | Missense_Mutation | c.2563N>G | p.Gln855Glu | p.Q855E | Q5VTR2 | protein_coding | tolerated(0.09) | benign(0.035) | TCGA-C8-A12Q-01 | Breast | breast invasive carcinoma | Female | >=65 | III/IV | Unknown | Unknown | PD | |
| RNF20 | SNV | Missense_Mutation | novel | c.1384A>C | p.Thr462Pro | p.T462P | Q5VTR2 | protein_coding | deleterious(0.01) | probably_damaging(0.987) | TCGA-C8-A1HO-01 | Breast | breast invasive carcinoma | Female | <65 | III/IV | Chemotherapy | 5-fluorouracil | CR |
| RNF20 | SNV | Missense_Mutation | c.1582N>T | p.Asp528Tyr | p.D528Y | Q5VTR2 | protein_coding | deleterious(0.01) | possibly_damaging(0.65) | TCGA-D8-A1XQ-01 | Breast | breast invasive carcinoma | Female | >=65 | I/II | Unknown | Unknown | SD | |
| RNF20 | SNV | Missense_Mutation | c.1880N>G | p.Lys627Arg | p.K627R | Q5VTR2 | protein_coding | tolerated(0.41) | probably_damaging(0.98) | TCGA-E9-A243-01 | Breast | breast invasive carcinoma | Female | <65 | I/II | Chemotherapy | 5-fluorouracil | PD |
| Page: 1 2 3 4 5 6 7 8 9 10 11 12 13 14 |
Top |
Related drugs of malignant transformation related genes |
| Identification of chemicals and drugs interact with genes involved in malignant transfromation |
| (DGIdb 4.0) |
| Entrez ID | Symbol | Category | Interaction Types | Drug Claim Name | Drug Name | PMIDs |
| Page: 1 |

Copyright 2023-Present -The University of Texas Health Science Center at Houston |