
|
|||||
|
 | |
| |
| |
| |
| |
| |
|
Gene: RNF2 |
Gene summary for RNF2 |
| Gene information | Species | Human | Gene symbol | RNF2 | Gene ID | 6045 |
| Gene name | ring finger protein 2 | |
| Gene Alias | BAP-1 | |
| Cytomap | 1q25.3 | |
| Gene Type | protein-coding | GO ID | GO:0000003 | UniProtAcc | Q99496 |
Top |
Malignant transformation analysis |
| Identification of the aberrant gene expression in precancerous and cancerous lesions by comparing the gene expression of stem-like cells in diseased tissues with normal stem cells |
| Entrez ID | Symbol | Replicates | Species | Organ | Tissue | Adj P-value | Log2FC | Malignancy |
| 6045 | RNF2 | LZE4T | Human | Esophagus | ESCC | 7.12e-03 | 1.03e-01 | 0.0811 |
| 6045 | RNF2 | LZE8T | Human | Esophagus | ESCC | 2.48e-08 | 1.41e-01 | 0.067 |
| 6045 | RNF2 | LZE24T | Human | Esophagus | ESCC | 2.31e-19 | 3.44e-01 | 0.0596 |
| 6045 | RNF2 | LZE6T | Human | Esophagus | ESCC | 1.67e-02 | 1.92e-01 | 0.0845 |
| 6045 | RNF2 | P1T-E | Human | Esophagus | ESCC | 6.43e-03 | 2.00e-01 | 0.0875 |
| 6045 | RNF2 | P2T-E | Human | Esophagus | ESCC | 9.00e-29 | 4.63e-01 | 0.1177 |
| 6045 | RNF2 | P4T-E | Human | Esophagus | ESCC | 4.16e-15 | 3.56e-01 | 0.1323 |
| 6045 | RNF2 | P5T-E | Human | Esophagus | ESCC | 1.20e-23 | 5.29e-01 | 0.1327 |
| 6045 | RNF2 | P8T-E | Human | Esophagus | ESCC | 1.32e-14 | 1.75e-01 | 0.0889 |
| 6045 | RNF2 | P9T-E | Human | Esophagus | ESCC | 3.02e-16 | 2.91e-01 | 0.1131 |
| 6045 | RNF2 | P10T-E | Human | Esophagus | ESCC | 1.95e-21 | 4.38e-01 | 0.116 |
| 6045 | RNF2 | P11T-E | Human | Esophagus | ESCC | 3.36e-09 | 4.31e-01 | 0.1426 |
| 6045 | RNF2 | P12T-E | Human | Esophagus | ESCC | 1.45e-06 | 2.82e-01 | 0.1122 |
| 6045 | RNF2 | P15T-E | Human | Esophagus | ESCC | 9.35e-24 | 5.15e-01 | 0.1149 |
| 6045 | RNF2 | P16T-E | Human | Esophagus | ESCC | 7.63e-31 | 5.73e-01 | 0.1153 |
| 6045 | RNF2 | P17T-E | Human | Esophagus | ESCC | 7.75e-05 | 3.14e-01 | 0.1278 |
| 6045 | RNF2 | P19T-E | Human | Esophagus | ESCC | 1.31e-02 | 4.86e-01 | 0.1662 |
| 6045 | RNF2 | P20T-E | Human | Esophagus | ESCC | 9.47e-22 | 4.39e-01 | 0.1124 |
| 6045 | RNF2 | P21T-E | Human | Esophagus | ESCC | 2.43e-19 | 2.73e-01 | 0.1617 |
| 6045 | RNF2 | P22T-E | Human | Esophagus | ESCC | 3.54e-13 | 2.73e-01 | 0.1236 |
| Page: 1 2 3 4 |
| Tissue | Expression Dynamics | Abbreviation |
| Esophagus | 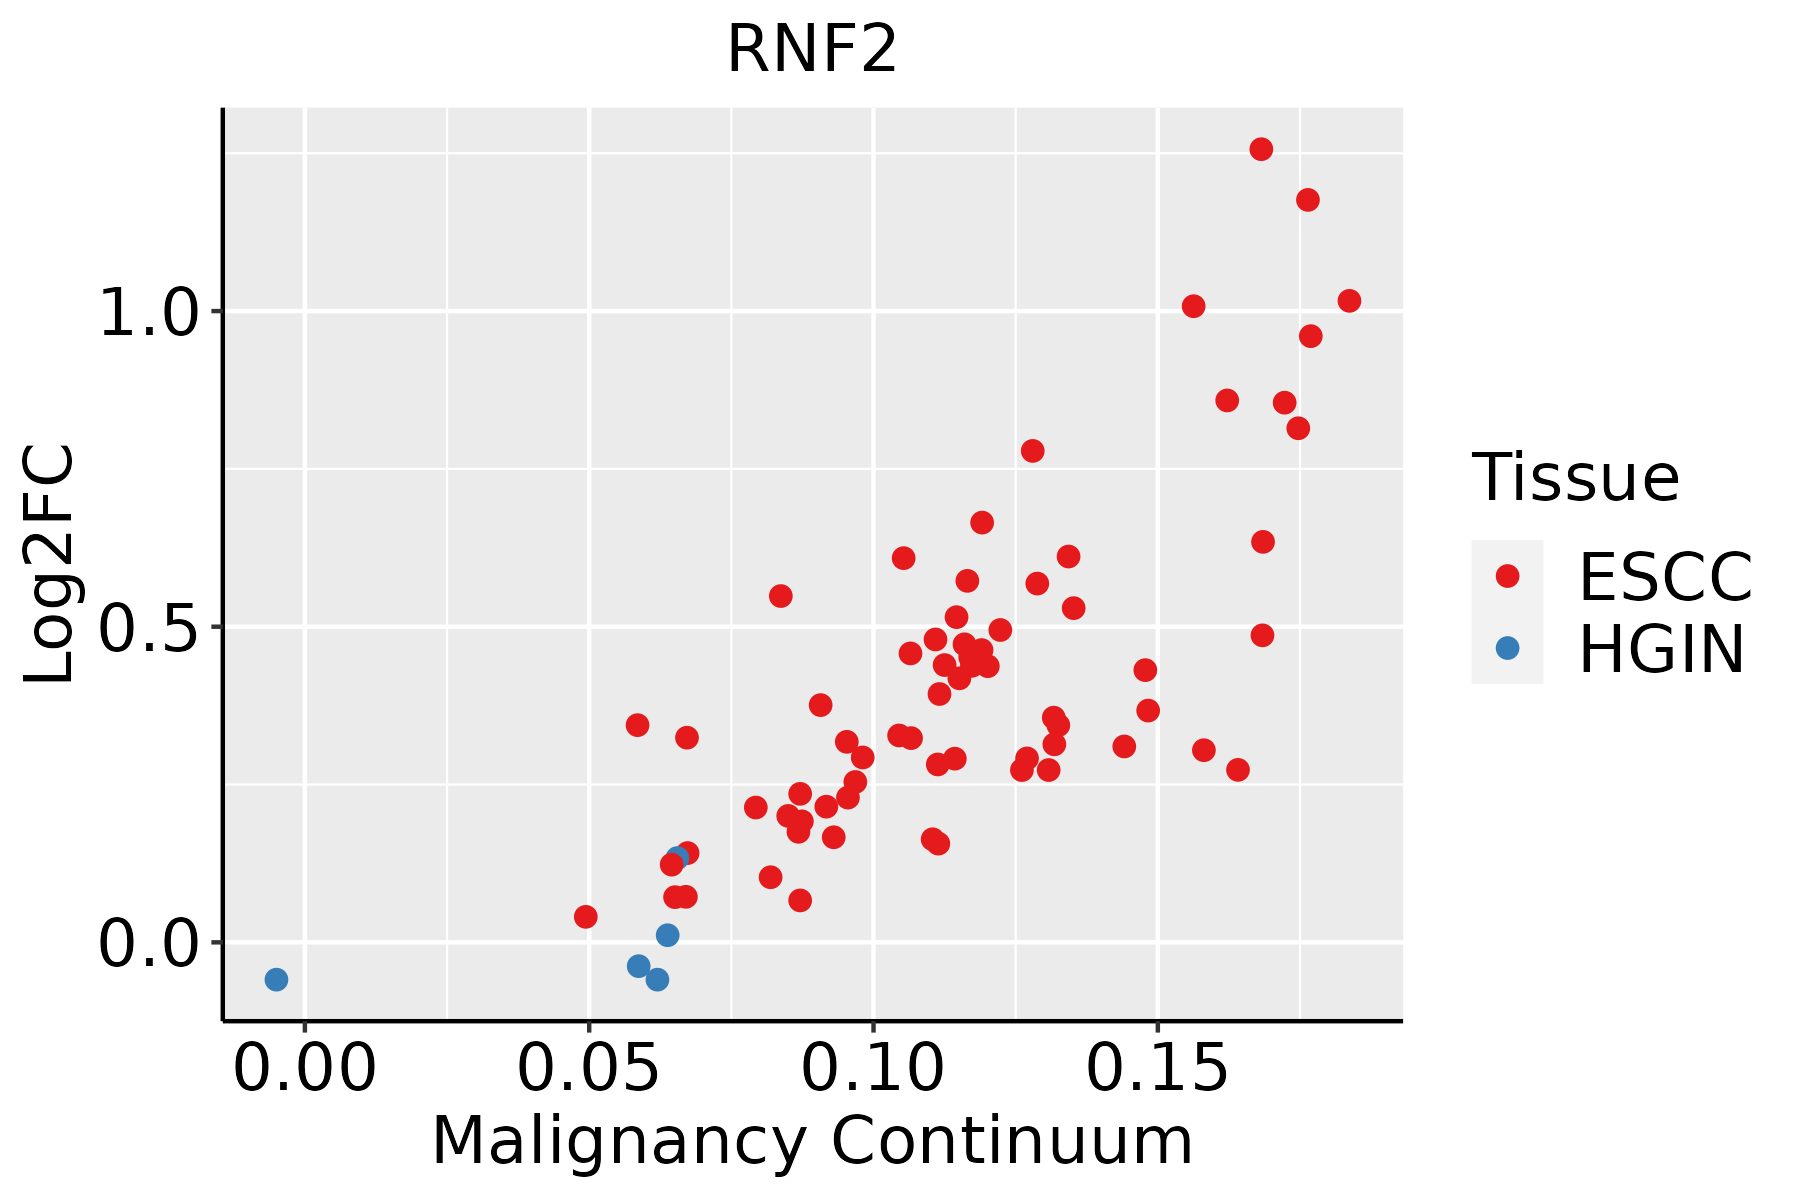 | ESCC: Esophageal squamous cell carcinoma |
| HGIN: High-grade intraepithelial neoplasias | ||
| LGIN: Low-grade intraepithelial neoplasias | ||
| Oral Cavity |  | EOLP: Erosive Oral lichen planus |
| LP: leukoplakia | ||
| NEOLP: Non-erosive oral lichen planus | ||
| OSCC: Oral squamous cell carcinoma |
| ∗log2FC in expression of this searched gene in stem-like cells from each diseased tissue sample relative to stem-like cells in normal samples in each tissue plotted against the malignancy continuum. Samples are colored based on if they are from different disease stage. |
Top |
Malignant transformation related pathway analysis |
| Find out the enriched GO biological processes and KEGG pathways involved in transition from healthy to precancer to cancer |
| Tissue | Disease Stage | Enriched GO biological Processes |
| Colorectum | AD |  |
| Colorectum | SER |  |
| Colorectum | MSS |  |
| Colorectum | MSI-H |  |
| Colorectum | FAP |  |
| ∗Top 15 enriched GO BP terms are showed in the bar plot of each disease state in each tissue. Each row represents a significant GO biological process which is colored according to the -log10(p.adjust). |
| Page: 1 2 3 4 5 6 7 8 9 |
| GO ID | Tissue | Disease Stage | Description | Gene Ratio | Bg Ratio | pvalue | p.adjust | Count |
| GO:004217610 | Cervix | CC | regulation of protein catabolic process | 104/2311 | 391/18723 | 9.39e-15 | 9.36e-12 | 104 |
| GO:004586210 | Cervix | CC | positive regulation of proteolysis | 95/2311 | 372/18723 | 1.84e-12 | 6.86e-10 | 95 |
| GO:190336210 | Cervix | CC | regulation of cellular protein catabolic process | 72/2311 | 255/18723 | 5.98e-12 | 2.10e-09 | 72 |
| GO:004573210 | Cervix | CC | positive regulation of protein catabolic process | 65/2311 | 231/18723 | 7.44e-11 | 1.39e-08 | 65 |
| GO:001049810 | Cervix | CC | proteasomal protein catabolic process | 111/2311 | 490/18723 | 8.98e-11 | 1.58e-08 | 111 |
| GO:000989610 | Cervix | CC | positive regulation of catabolic process | 109/2311 | 492/18723 | 5.26e-10 | 6.99e-08 | 109 |
| GO:190305010 | Cervix | CC | regulation of proteolysis involved in cellular protein catabolic process | 60/2311 | 221/18723 | 1.82e-09 | 1.98e-07 | 60 |
| GO:00160557 | Cervix | CC | Wnt signaling pathway | 98/2311 | 444/18723 | 4.82e-09 | 4.65e-07 | 98 |
| GO:01987387 | Cervix | CC | cell-cell signaling by wnt | 98/2311 | 446/18723 | 6.16e-09 | 5.58e-07 | 98 |
| GO:200005810 | Cervix | CC | regulation of ubiquitin-dependent protein catabolic process | 47/2311 | 164/18723 | 1.63e-08 | 1.25e-06 | 47 |
| GO:004316110 | Cervix | CC | proteasome-mediated ubiquitin-dependent protein catabolic process | 91/2311 | 412/18723 | 1.65e-08 | 1.25e-06 | 91 |
| GO:00301117 | Cervix | CC | regulation of Wnt signaling pathway | 76/2311 | 328/18723 | 3.05e-08 | 2.08e-06 | 76 |
| GO:003133110 | Cervix | CC | positive regulation of cellular catabolic process | 91/2311 | 427/18723 | 9.64e-08 | 5.25e-06 | 91 |
| GO:00002097 | Cervix | CC | protein polyubiquitination | 58/2311 | 236/18723 | 1.57e-07 | 7.41e-06 | 58 |
| GO:190336410 | Cervix | CC | positive regulation of cellular protein catabolic process | 43/2311 | 155/18723 | 1.80e-07 | 8.28e-06 | 43 |
| GO:006113610 | Cervix | CC | regulation of proteasomal protein catabolic process | 48/2311 | 187/18723 | 4.63e-07 | 1.77e-05 | 48 |
| GO:003243410 | Cervix | CC | regulation of proteasomal ubiquitin-dependent protein catabolic process | 38/2311 | 134/18723 | 4.99e-07 | 1.88e-05 | 38 |
| GO:19030528 | Cervix | CC | positive regulation of proteolysis involved in cellular protein catabolic process | 34/2311 | 133/18723 | 2.28e-05 | 4.01e-04 | 34 |
| GO:200006010 | Cervix | CC | positive regulation of ubiquitin-dependent protein catabolic process | 29/2311 | 107/18723 | 2.77e-05 | 4.62e-04 | 29 |
| GO:00324369 | Cervix | CC | positive regulation of proteasomal ubiquitin-dependent protein catabolic process | 25/2311 | 90/18723 | 6.22e-05 | 8.90e-04 | 25 |
| Page: 1 2 3 4 5 6 7 8 9 10 11 12 13 14 15 16 17 18 19 20 21 22 23 24 25 26 27 28 29 30 31 32 33 |
| Pathway ID | Tissue | Disease Stage | Description | Gene Ratio | Bg Ratio | pvalue | p.adjust | qvalue | Count |
| Page: 1 |
Top |
Cell-cell communication analysis |
| Identification of potential cell-cell interactions between two cell types and their ligand-receptor pairs for different disease states |
| Ligand | Receptor | LRpair | Pathway | Tissue | Disease Stage |
| Page: 1 |
Top |
Single-cell gene regulatory network inference analysis |
| Find out the significant the regulons (TFs) and the target genes of each regulon across cell types for different disease states |
| TF | Cell Type | Tissue | Disease Stage | Target Gene | RSS | Regulon Activity |
| ∗The dot plots of a searched regulon are shown for all cell subpopulations in each disease state of each tissue based on the regulon specific score inferred using pySCENIC and by calculating the average expression. |
| Page: 1 |
Top |
Somatic mutation of malignant transformation related genes |
| Annotation of somatic variants for genes involved in malignant transformation |
| Hugo Symbol | Variant Class | Variant Classification | dbSNP RS | HGVSc | HGVSp | HGVSp Short | SWISSPROT | BIOTYPE | SIFT | PolyPhen | Tumor Sample Barcode | Tissue | Histology | Sex | Age | Stage | Therapy Types | Drugs | Outcome |
| RNF2 | SNV | Missense_Mutation | novel | c.848N>C | p.Leu283Pro | p.L283P | Q99496 | protein_coding | deleterious(0.02) | possibly_damaging(0.799) | TCGA-A2-A0EO-01 | Breast | breast invasive carcinoma | Female | <65 | I/II | Hormone Therapy | tamoxiphen | SD |
| RNF2 | SNV | Missense_Mutation | c.473G>A | p.Arg158Gln | p.R158Q | Q99496 | protein_coding | deleterious(0.01) | possibly_damaging(0.726) | TCGA-AC-A23H-01 | Breast | breast invasive carcinoma | Female | >=65 | I/II | Unknown | Unknown | PD | |
| RNF2 | SNV | Missense_Mutation | c.128G>A | p.Arg43Gln | p.R43Q | Q99496 | protein_coding | deleterious(0) | possibly_damaging(0.759) | TCGA-AN-A046-01 | Breast | breast invasive carcinoma | Female | >=65 | I/II | Unknown | Unknown | SD | |
| RNF2 | SNV | Missense_Mutation | novel | c.293G>T | p.Arg98Ile | p.R98I | Q99496 | protein_coding | deleterious(0) | probably_damaging(0.996) | TCGA-AN-A046-01 | Breast | breast invasive carcinoma | Female | >=65 | I/II | Unknown | Unknown | SD |
| RNF2 | SNV | Missense_Mutation | c.577A>T | p.Ser193Cys | p.S193C | Q99496 | protein_coding | deleterious(0.02) | benign(0.015) | TCGA-AA-3710-01 | Colorectum | colon adenocarcinoma | Female | >=65 | I/II | Unknown | Unknown | SD | |
| RNF2 | SNV | Missense_Mutation | novel | c.339N>G | p.Ile113Met | p.I113M | Q99496 | protein_coding | deleterious(0) | probably_damaging(0.991) | TCGA-CA-6717-01 | Colorectum | colon adenocarcinoma | Male | <65 | I/II | Chemotherapy | oxaliplatin | CR |
| RNF2 | SNV | Missense_Mutation | c.587G>A | p.Arg196Gln | p.R196Q | Q99496 | protein_coding | tolerated(0.13) | benign(0.003) | TCGA-CM-6674-01 | Colorectum | colon adenocarcinoma | Male | <65 | I/II | Unknown | Unknown | SD | |
| RNF2 | SNV | Missense_Mutation | c.77G>A | p.Arg26Gln | p.R26Q | Q99496 | protein_coding | deleterious(0.04) | possibly_damaging(0.688) | TCGA-AG-A002-01 | Colorectum | rectum adenocarcinoma | Male | <65 | I/II | Unknown | Unknown | SD | |
| RNF2 | SNV | Missense_Mutation | c.77N>A | p.Arg26Gln | p.R26Q | Q99496 | protein_coding | deleterious(0.04) | possibly_damaging(0.688) | TCGA-EI-6917-01 | Colorectum | rectum adenocarcinoma | Male | <65 | III/IV | Chemotherapy | 5fluorouracil+oxaciplatina+l-folinian | SD | |
| RNF2 | insertion | Frame_Shift_Ins | novel | c.971_972insA | p.Met325HisfsTer16 | p.M325Hfs*16 | Q99496 | protein_coding | TCGA-AM-5820-01 | Colorectum | colon adenocarcinoma | Female | <65 | I/II | Unknown | Unknown | SD |
| Page: 1 2 3 4 |
Top |
Related drugs of malignant transformation related genes |
| Identification of chemicals and drugs interact with genes involved in malignant transfromation |
| (DGIdb 4.0) |
| Entrez ID | Symbol | Category | Interaction Types | Drug Claim Name | Drug Name | PMIDs |
| Page: 1 |

Copyright 2023-Present -The University of Texas Health Science Center at Houston |