
|
|||||
|
 | |
| |
| |
| |
| |
| |
|
Gene: RNF19B |
Gene summary for RNF19B |
| Gene information | Species | Human | Gene symbol | RNF19B | Gene ID | 127544 |
| Gene name | ring finger protein 19B | |
| Gene Alias | IBRDC3 | |
| Cytomap | 1p35.1 | |
| Gene Type | protein-coding | GO ID | GO:0000209 | UniProtAcc | Q6ZMZ0 |
Top |
Malignant transformation analysis |
| Identification of the aberrant gene expression in precancerous and cancerous lesions by comparing the gene expression of stem-like cells in diseased tissues with normal stem cells |
| Entrez ID | Symbol | Replicates | Species | Organ | Tissue | Adj P-value | Log2FC | Malignancy |
| 127544 | RNF19B | LZE20T | Human | Esophagus | ESCC | 1.04e-02 | 4.98e-03 | 0.0662 |
| 127544 | RNF19B | LZE24T | Human | Esophagus | ESCC | 7.45e-12 | 8.64e-02 | 0.0596 |
| 127544 | RNF19B | P1T-E | Human | Esophagus | ESCC | 1.70e-07 | 2.23e-01 | 0.0875 |
| 127544 | RNF19B | P4T-E | Human | Esophagus | ESCC | 2.02e-06 | -5.62e-02 | 0.1323 |
| 127544 | RNF19B | P5T-E | Human | Esophagus | ESCC | 1.46e-08 | 7.49e-02 | 0.1327 |
| 127544 | RNF19B | P8T-E | Human | Esophagus | ESCC | 1.90e-07 | -1.54e-02 | 0.0889 |
| 127544 | RNF19B | P9T-E | Human | Esophagus | ESCC | 7.40e-08 | 6.07e-02 | 0.1131 |
| 127544 | RNF19B | P10T-E | Human | Esophagus | ESCC | 2.75e-05 | -1.37e-01 | 0.116 |
| 127544 | RNF19B | P11T-E | Human | Esophagus | ESCC | 3.79e-02 | 2.48e-01 | 0.1426 |
| 127544 | RNF19B | P12T-E | Human | Esophagus | ESCC | 4.77e-13 | -6.22e-02 | 0.1122 |
| 127544 | RNF19B | P15T-E | Human | Esophagus | ESCC | 1.93e-11 | 1.63e-02 | 0.1149 |
| 127544 | RNF19B | P16T-E | Human | Esophagus | ESCC | 9.43e-05 | -1.56e-01 | 0.1153 |
| 127544 | RNF19B | P17T-E | Human | Esophagus | ESCC | 5.21e-04 | 1.07e-01 | 0.1278 |
| 127544 | RNF19B | P21T-E | Human | Esophagus | ESCC | 5.63e-14 | 6.15e-02 | 0.1617 |
| 127544 | RNF19B | P22T-E | Human | Esophagus | ESCC | 7.62e-09 | -8.57e-02 | 0.1236 |
| 127544 | RNF19B | P23T-E | Human | Esophagus | ESCC | 1.79e-13 | 2.27e-01 | 0.108 |
| 127544 | RNF19B | P24T-E | Human | Esophagus | ESCC | 2.52e-08 | 3.11e-02 | 0.1287 |
| 127544 | RNF19B | P26T-E | Human | Esophagus | ESCC | 7.84e-17 | 2.68e-02 | 0.1276 |
| 127544 | RNF19B | P27T-E | Human | Esophagus | ESCC | 5.54e-15 | 1.70e-03 | 0.1055 |
| 127544 | RNF19B | P28T-E | Human | Esophagus | ESCC | 1.25e-16 | 2.44e-01 | 0.1149 |
| Page: 1 2 3 4 |
| Tissue | Expression Dynamics | Abbreviation |
| Esophagus | 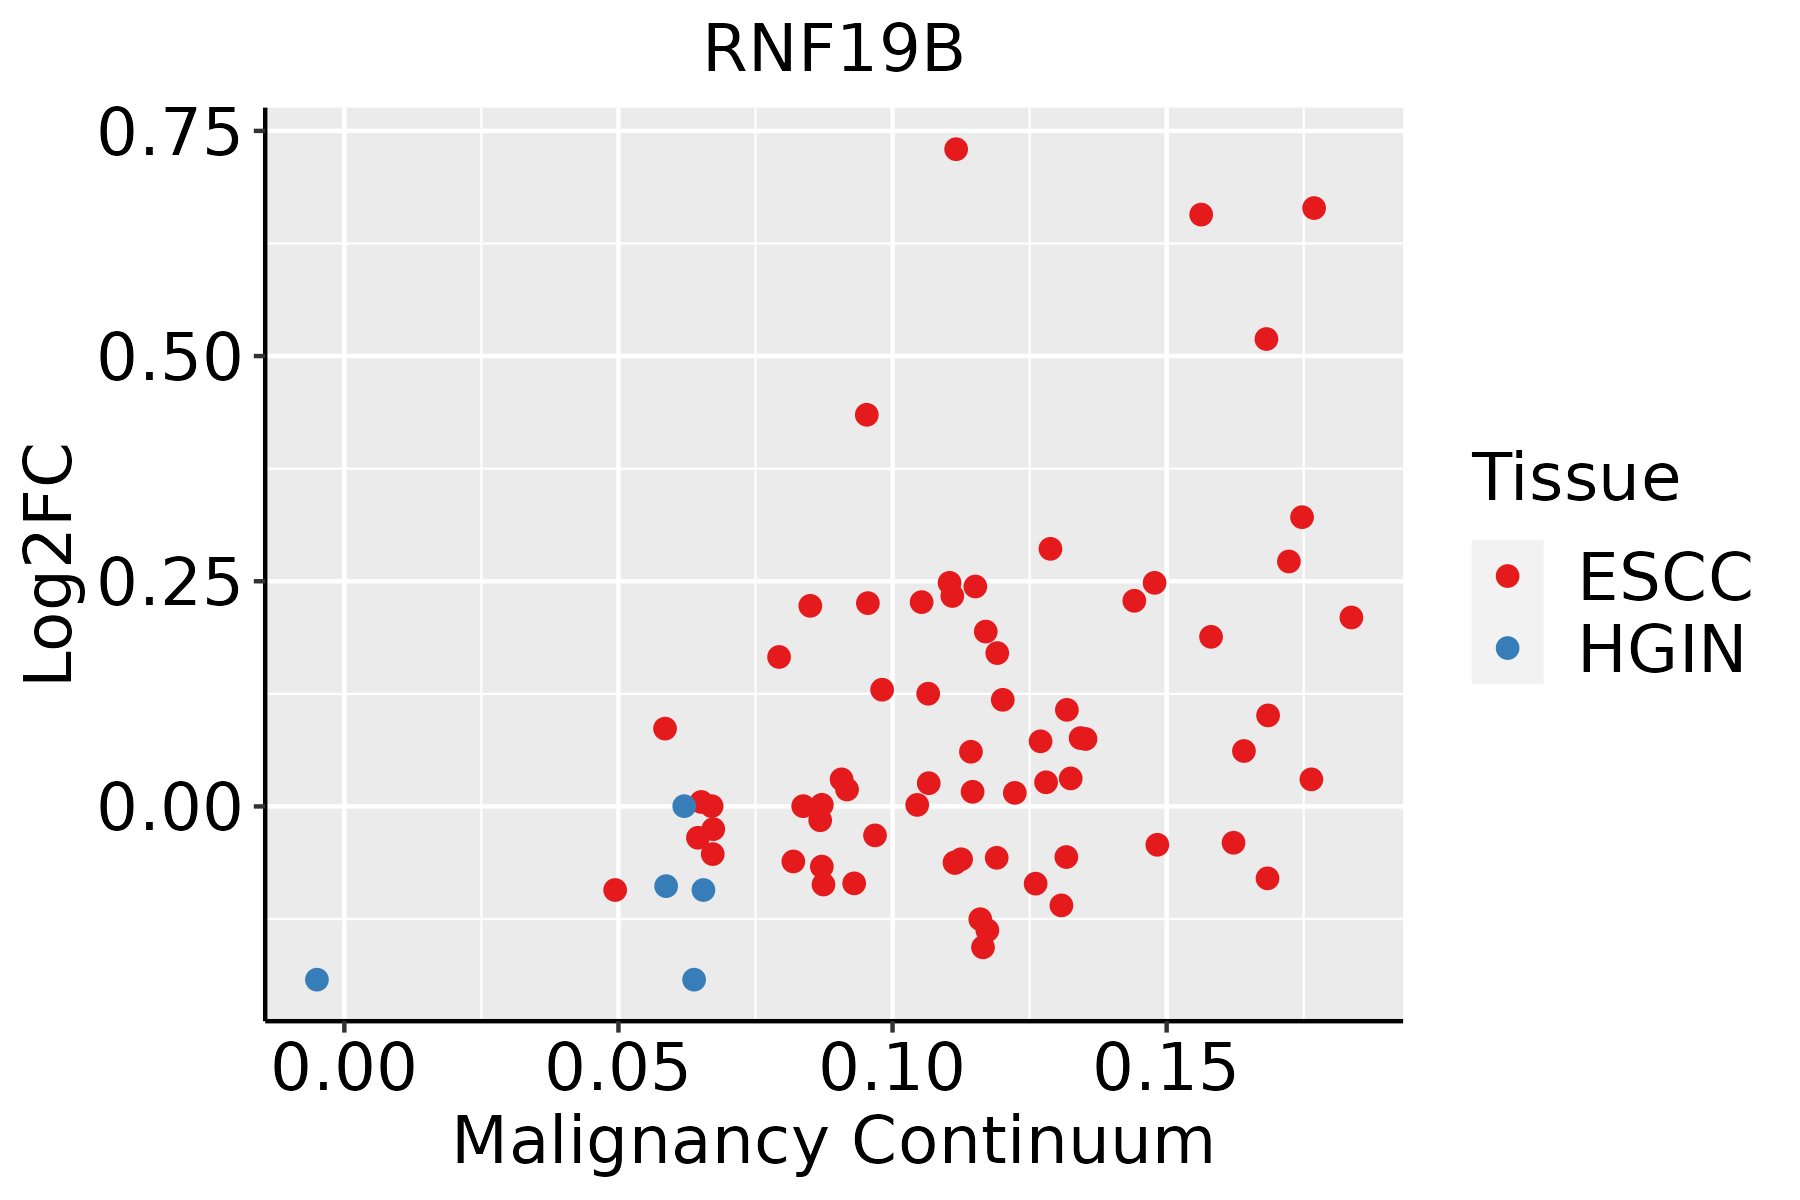 | ESCC: Esophageal squamous cell carcinoma |
| HGIN: High-grade intraepithelial neoplasias | ||
| LGIN: Low-grade intraepithelial neoplasias | ||
| Liver |  | HCC: Hepatocellular carcinoma |
| NAFLD: Non-alcoholic fatty liver disease | ||
| Oral Cavity | 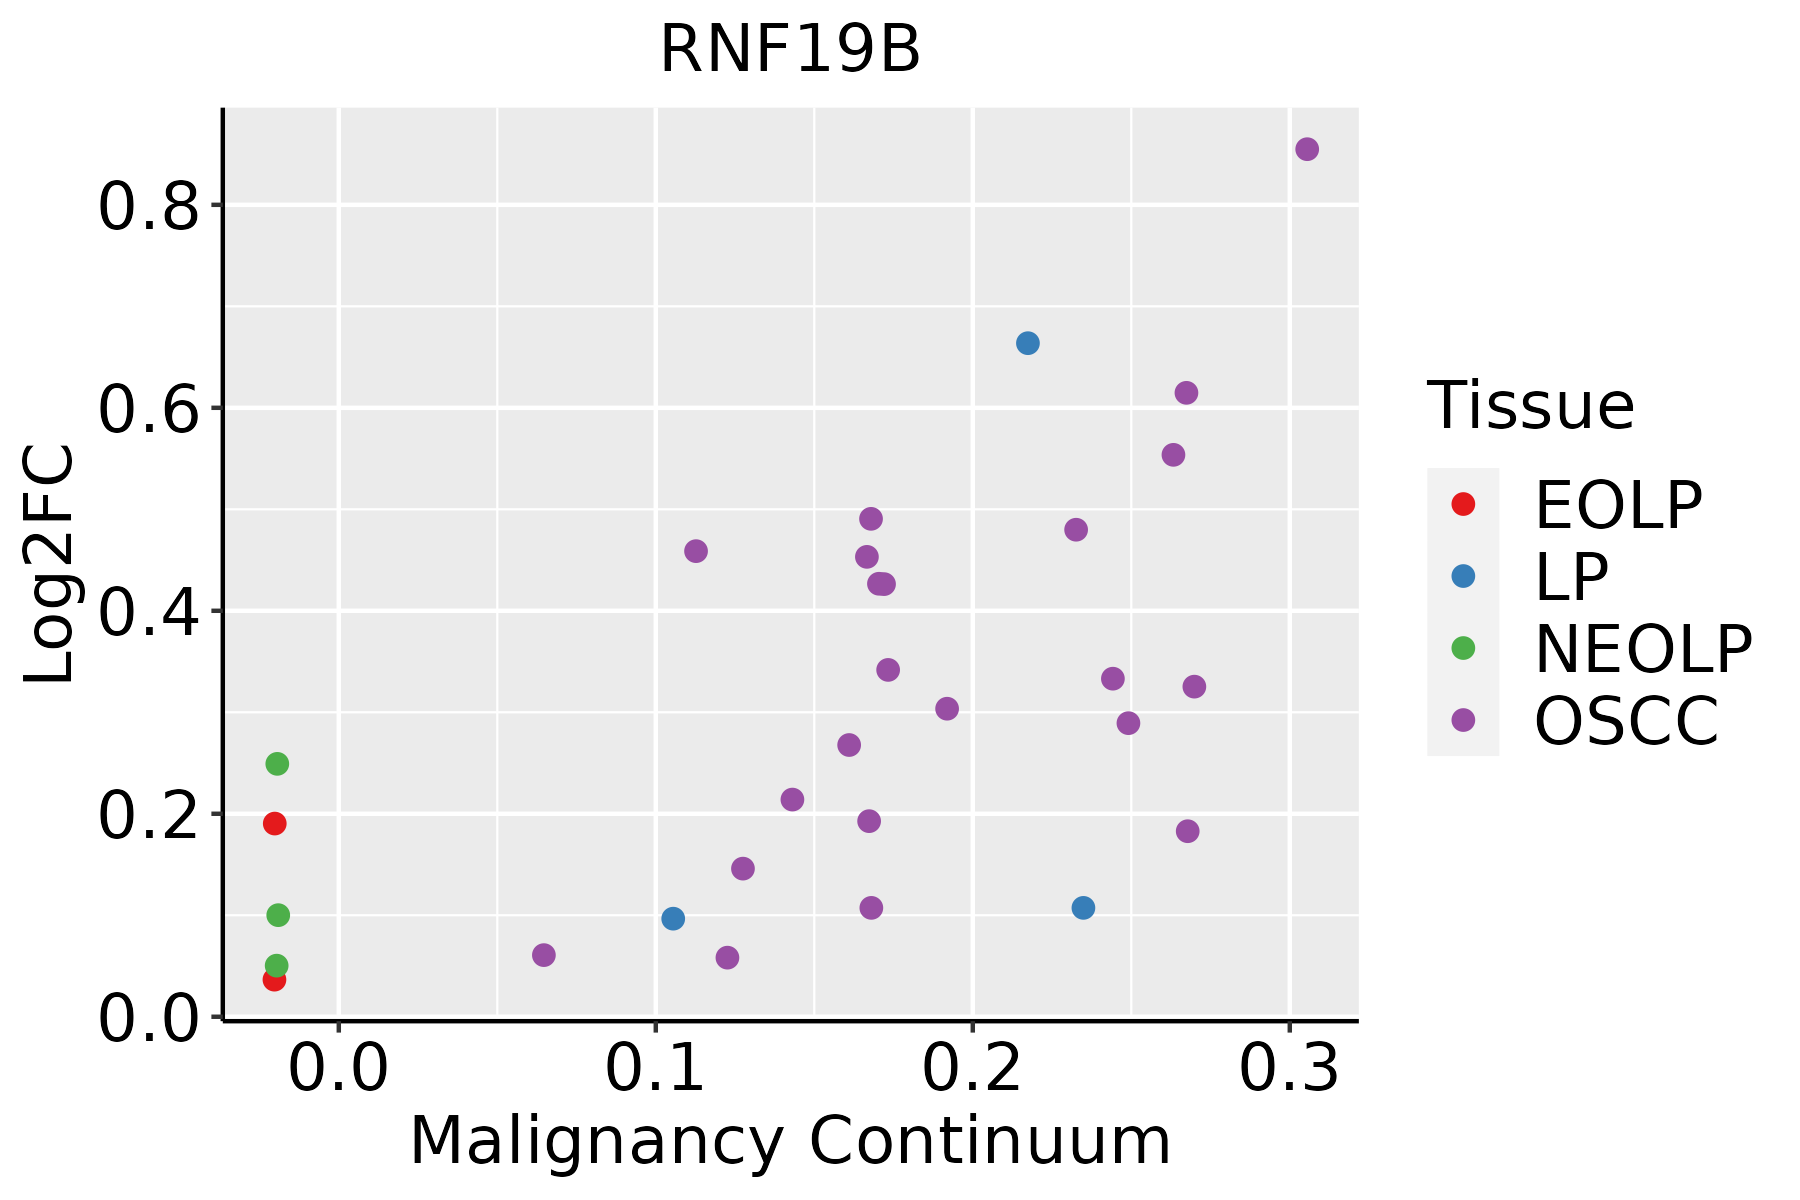 | EOLP: Erosive Oral lichen planus |
| LP: leukoplakia | ||
| NEOLP: Non-erosive oral lichen planus | ||
| OSCC: Oral squamous cell carcinoma | ||
| Skin |  | AK: Actinic keratosis |
| cSCC: Cutaneous squamous cell carcinoma | ||
| SCCIS:squamous cell carcinoma in situ |
| ∗log2FC in expression of this searched gene in stem-like cells from each diseased tissue sample relative to stem-like cells in normal samples in each tissue plotted against the malignancy continuum. Samples are colored based on if they are from different disease stage. |
Top |
Malignant transformation related pathway analysis |
| Find out the enriched GO biological processes and KEGG pathways involved in transition from healthy to precancer to cancer |
| Tissue | Disease Stage | Enriched GO biological Processes |
| Colorectum | AD |  |
| Colorectum | SER |  |
| Colorectum | MSS |  |
| Colorectum | MSI-H |  |
| Colorectum | FAP |  |
| ∗Top 15 enriched GO BP terms are showed in the bar plot of each disease state in each tissue. Each row represents a significant GO biological process which is colored according to the -log10(p.adjust). |
| Page: 1 2 3 4 5 6 7 8 9 |
| GO ID | Tissue | Disease Stage | Description | Gene Ratio | Bg Ratio | pvalue | p.adjust | Count |
| GO:0010498111 | Esophagus | ESCC | proteasomal protein catabolic process | 369/8552 | 490/18723 | 1.13e-41 | 1.80e-38 | 369 |
| GO:0043161111 | Esophagus | ESCC | proteasome-mediated ubiquitin-dependent protein catabolic process | 312/8552 | 412/18723 | 3.53e-36 | 4.48e-33 | 312 |
| GO:0042176111 | Esophagus | ESCC | regulation of protein catabolic process | 280/8552 | 391/18723 | 8.65e-26 | 2.39e-23 | 280 |
| GO:0009896111 | Esophagus | ESCC | positive regulation of catabolic process | 332/8552 | 492/18723 | 4.36e-23 | 9.22e-21 | 332 |
| GO:0031331111 | Esophagus | ESCC | positive regulation of cellular catabolic process | 292/8552 | 427/18723 | 8.67e-22 | 1.53e-19 | 292 |
| GO:1903362111 | Esophagus | ESCC | regulation of cellular protein catabolic process | 188/8552 | 255/18723 | 5.12e-20 | 6.62e-18 | 188 |
| GO:0045862111 | Esophagus | ESCC | positive regulation of proteolysis | 256/8552 | 372/18723 | 7.88e-20 | 9.43e-18 | 256 |
| GO:1903050111 | Esophagus | ESCC | regulation of proteolysis involved in cellular protein catabolic process | 163/8552 | 221/18723 | 1.44e-17 | 1.27e-15 | 163 |
| GO:0061136111 | Esophagus | ESCC | regulation of proteasomal protein catabolic process | 142/8552 | 187/18723 | 2.40e-17 | 2.00e-15 | 142 |
| GO:000020917 | Esophagus | ESCC | protein polyubiquitination | 170/8552 | 236/18723 | 1.40e-16 | 1.09e-14 | 170 |
| GO:0045732111 | Esophagus | ESCC | positive regulation of protein catabolic process | 167/8552 | 231/18723 | 1.47e-16 | 1.14e-14 | 167 |
| GO:0032434111 | Esophagus | ESCC | regulation of proteasomal ubiquitin-dependent protein catabolic process | 107/8552 | 134/18723 | 4.06e-16 | 2.93e-14 | 107 |
| GO:2000058111 | Esophagus | ESCC | regulation of ubiquitin-dependent protein catabolic process | 125/8552 | 164/18723 | 1.17e-15 | 7.76e-14 | 125 |
| GO:1903364111 | Esophagus | ESCC | positive regulation of cellular protein catabolic process | 117/8552 | 155/18723 | 3.25e-14 | 1.66e-12 | 117 |
| GO:1901800110 | Esophagus | ESCC | positive regulation of proteasomal protein catabolic process | 91/8552 | 114/18723 | 6.74e-14 | 3.34e-12 | 91 |
| GO:1903052110 | Esophagus | ESCC | positive regulation of proteolysis involved in cellular protein catabolic process | 101/8552 | 133/18723 | 9.58e-13 | 4.19e-11 | 101 |
| GO:0032436111 | Esophagus | ESCC | positive regulation of proteasomal ubiquitin-dependent protein catabolic process | 72/8552 | 90/18723 | 2.30e-11 | 7.87e-10 | 72 |
| GO:2000060111 | Esophagus | ESCC | positive regulation of ubiquitin-dependent protein catabolic process | 81/8552 | 107/18723 | 2.23e-10 | 6.34e-09 | 81 |
| GO:00518658 | Esophagus | ESCC | protein autoubiquitination | 47/8552 | 73/18723 | 9.72e-04 | 4.93e-03 | 47 |
| GO:001049822 | Liver | HCC | proteasomal protein catabolic process | 351/7958 | 490/18723 | 6.92e-40 | 1.46e-36 | 351 |
| Page: 1 2 3 4 5 6 7 8 |
| Pathway ID | Tissue | Disease Stage | Description | Gene Ratio | Bg Ratio | pvalue | p.adjust | qvalue | Count |
| Page: 1 |
Top |
Cell-cell communication analysis |
| Identification of potential cell-cell interactions between two cell types and their ligand-receptor pairs for different disease states |
| Ligand | Receptor | LRpair | Pathway | Tissue | Disease Stage |
| Page: 1 |
Top |
Single-cell gene regulatory network inference analysis |
| Find out the significant the regulons (TFs) and the target genes of each regulon across cell types for different disease states |
| TF | Cell Type | Tissue | Disease Stage | Target Gene | RSS | Regulon Activity |
| ∗The dot plots of a searched regulon are shown for all cell subpopulations in each disease state of each tissue based on the regulon specific score inferred using pySCENIC and by calculating the average expression. |
| Page: 1 |
Top |
Somatic mutation of malignant transformation related genes |
| Annotation of somatic variants for genes involved in malignant transformation |
| Hugo Symbol | Variant Class | Variant Classification | dbSNP RS | HGVSc | HGVSp | HGVSp Short | SWISSPROT | BIOTYPE | SIFT | PolyPhen | Tumor Sample Barcode | Tissue | Histology | Sex | Age | Stage | Therapy Types | Drugs | Outcome |
| RNF19B | SNV | Missense_Mutation | c.457G>C | p.Glu153Gln | p.E153Q | Q6ZMZ0 | protein_coding | tolerated(0.08) | possibly_damaging(0.709) | TCGA-C8-A1HK-01 | Breast | breast invasive carcinoma | Female | <65 | I/II | Unknown | Unknown | SD | |
| RNF19B | insertion | Frame_Shift_Ins | novel | c.1834_1835insATGAGGTGTGTCAAAGAGTGTACATATGTATGTGTGTA | p.Leu612HisfsTer69 | p.L612Hfs*69 | Q6ZMZ0 | protein_coding | TCGA-A2-A0EY-01 | Breast | breast invasive carcinoma | Female | <65 | I/II | Chemotherapy | adriamycin | SD | ||
| RNF19B | insertion | Nonsense_Mutation | novel | c.1278_1279insTCTCAGGGGGCACGCTGAGTGGCGGCATTCTCTCCAG | p.Ile427SerfsTer6 | p.I427Sfs*6 | Q6ZMZ0 | protein_coding | TCGA-AO-A03R-01 | Breast | breast invasive carcinoma | Female | <65 | I/II | Chemotherapy | doxorubicin | SD | ||
| RNF19B | insertion | Nonsense_Mutation | novel | c.1298_1299insGTTTTAAATTTTAGTTTTCTCATCTAAAATTGAGGCTATT | p.Tyr433Ter | p.Y433* | Q6ZMZ0 | protein_coding | TCGA-B6-A0IN-01 | Breast | breast invasive carcinoma | Female | <65 | I/II | Unknown | Unknown | PD | ||
| RNF19B | SNV | Missense_Mutation | c.1325G>A | p.Arg442His | p.R442H | Q6ZMZ0 | protein_coding | deleterious(0.01) | probably_damaging(0.996) | TCGA-C5-A1M8-01 | Cervix | cervical & endocervical cancer | Female | <65 | I/II | Unknown | Unknown | SD | |
| RNF19B | SNV | Missense_Mutation | novel | c.1547N>G | p.Phe516Cys | p.F516C | Q6ZMZ0 | protein_coding | tolerated(0.08) | possibly_damaging(0.72) | TCGA-AA-3955-01 | Colorectum | colon adenocarcinoma | Male | <65 | III/IV | Chemotherapy | capecitabine | CR |
| RNF19B | SNV | Missense_Mutation | novel | c.1211N>T | p.Gly404Val | p.G404V | Q6ZMZ0 | protein_coding | deleterious(0) | probably_damaging(0.999) | TCGA-AM-5820-01 | Colorectum | colon adenocarcinoma | Female | <65 | I/II | Unknown | Unknown | SD |
| RNF19B | SNV | Missense_Mutation | novel | c.1700G>A | p.Arg567His | p.R567H | Q6ZMZ0 | protein_coding | deleterious(0) | probably_damaging(0.959) | TCGA-AZ-4315-01 | Colorectum | colon adenocarcinoma | Male | <65 | I/II | Unknown | Unknown | SD |
| RNF19B | SNV | Missense_Mutation | c.1328G>T | p.Gly443Val | p.G443V | Q6ZMZ0 | protein_coding | deleterious(0.01) | probably_damaging(0.976) | TCGA-CM-5861-01 | Colorectum | colon adenocarcinoma | Female | <65 | I/II | Unknown | Unknown | PD | |
| RNF19B | SNV | Missense_Mutation | c.1346G>A | p.Ser449Asn | p.S449N | Q6ZMZ0 | protein_coding | deleterious(0.01) | probably_damaging(0.986) | TCGA-DM-A1DA-01 | Colorectum | colon adenocarcinoma | Female | >=65 | III/IV | Unknown | Unknown | SD |
| Page: 1 2 3 4 5 |
Top |
Related drugs of malignant transformation related genes |
| Identification of chemicals and drugs interact with genes involved in malignant transfromation |
| (DGIdb 4.0) |
| Entrez ID | Symbol | Category | Interaction Types | Drug Claim Name | Drug Name | PMIDs |
| Page: 1 |

Copyright 2023-Present -The University of Texas Health Science Center at Houston |