
|
|||||
|
 | |
| |
| |
| |
| |
| |
|
Gene: RNF187 |
Gene summary for RNF187 |
| Gene information | Species | Human | Gene symbol | RNF187 | Gene ID | 149603 |
| Gene name | ring finger protein 187 | |
| Gene Alias | RACO-1 | |
| Cytomap | 1q42.13 | |
| Gene Type | protein-coding | GO ID | GO:0000209 | UniProtAcc | Q5TA31 |
Top |
Malignant transformation analysis |
| Identification of the aberrant gene expression in precancerous and cancerous lesions by comparing the gene expression of stem-like cells in diseased tissues with normal stem cells |
| Entrez ID | Symbol | Replicates | Species | Organ | Tissue | Adj P-value | Log2FC | Malignancy |
| 149603 | RNF187 | GSM4909282 | Human | Breast | IDC | 8.23e-03 | 2.07e-01 | -0.0288 |
| 149603 | RNF187 | GSM4909293 | Human | Breast | IDC | 1.45e-17 | 4.59e-01 | 0.1581 |
| 149603 | RNF187 | GSM4909297 | Human | Breast | IDC | 3.14e-04 | -1.87e-01 | 0.1517 |
| 149603 | RNF187 | GSM4909298 | Human | Breast | IDC | 7.75e-08 | 3.16e-01 | 0.1551 |
| 149603 | RNF187 | GSM4909304 | Human | Breast | IDC | 5.82e-18 | 5.43e-01 | 0.1636 |
| 149603 | RNF187 | GSM4909311 | Human | Breast | IDC | 4.01e-12 | -9.56e-02 | 0.1534 |
| 149603 | RNF187 | GSM4909319 | Human | Breast | IDC | 3.43e-15 | -6.07e-02 | 0.1563 |
| 149603 | RNF187 | GSM4909321 | Human | Breast | IDC | 1.75e-09 | 1.37e-01 | 0.1559 |
| 149603 | RNF187 | brca2 | Human | Breast | Precancer | 4.44e-06 | 2.19e-01 | -0.024 |
| 149603 | RNF187 | brca3 | Human | Breast | Precancer | 4.42e-09 | 3.03e-01 | -0.0263 |
| 149603 | RNF187 | M5 | Human | Breast | IDC | 6.28e-03 | 4.99e-01 | 0.1598 |
| 149603 | RNF187 | NCCBC14 | Human | Breast | DCIS | 1.20e-06 | 3.37e-01 | 0.2021 |
| 149603 | RNF187 | NCCBC2 | Human | Breast | DCIS | 8.35e-03 | 1.49e-01 | 0.1554 |
| 149603 | RNF187 | NCCBC5 | Human | Breast | DCIS | 4.87e-05 | 1.94e-01 | 0.2046 |
| 149603 | RNF187 | P1 | Human | Breast | IDC | 1.34e-04 | -2.79e-02 | 0.1527 |
| 149603 | RNF187 | P2 | Human | Breast | IDC | 1.65e-06 | 4.09e-01 | 0.21 |
| 149603 | RNF187 | DCIS2 | Human | Breast | DCIS | 7.45e-35 | 6.77e-02 | 0.0085 |
| 149603 | RNF187 | HTA11_2487_2000001011 | Human | Colorectum | SER | 9.61e-11 | 3.99e-01 | -0.1808 |
| 149603 | RNF187 | HTA11_1938_2000001011 | Human | Colorectum | AD | 4.11e-05 | 3.04e-01 | -0.0811 |
| 149603 | RNF187 | HTA11_78_2000001011 | Human | Colorectum | AD | 9.35e-04 | 2.30e-01 | -0.1088 |
| Page: 1 2 3 4 5 6 7 8 |
| Tissue | Expression Dynamics | Abbreviation |
| Breast | 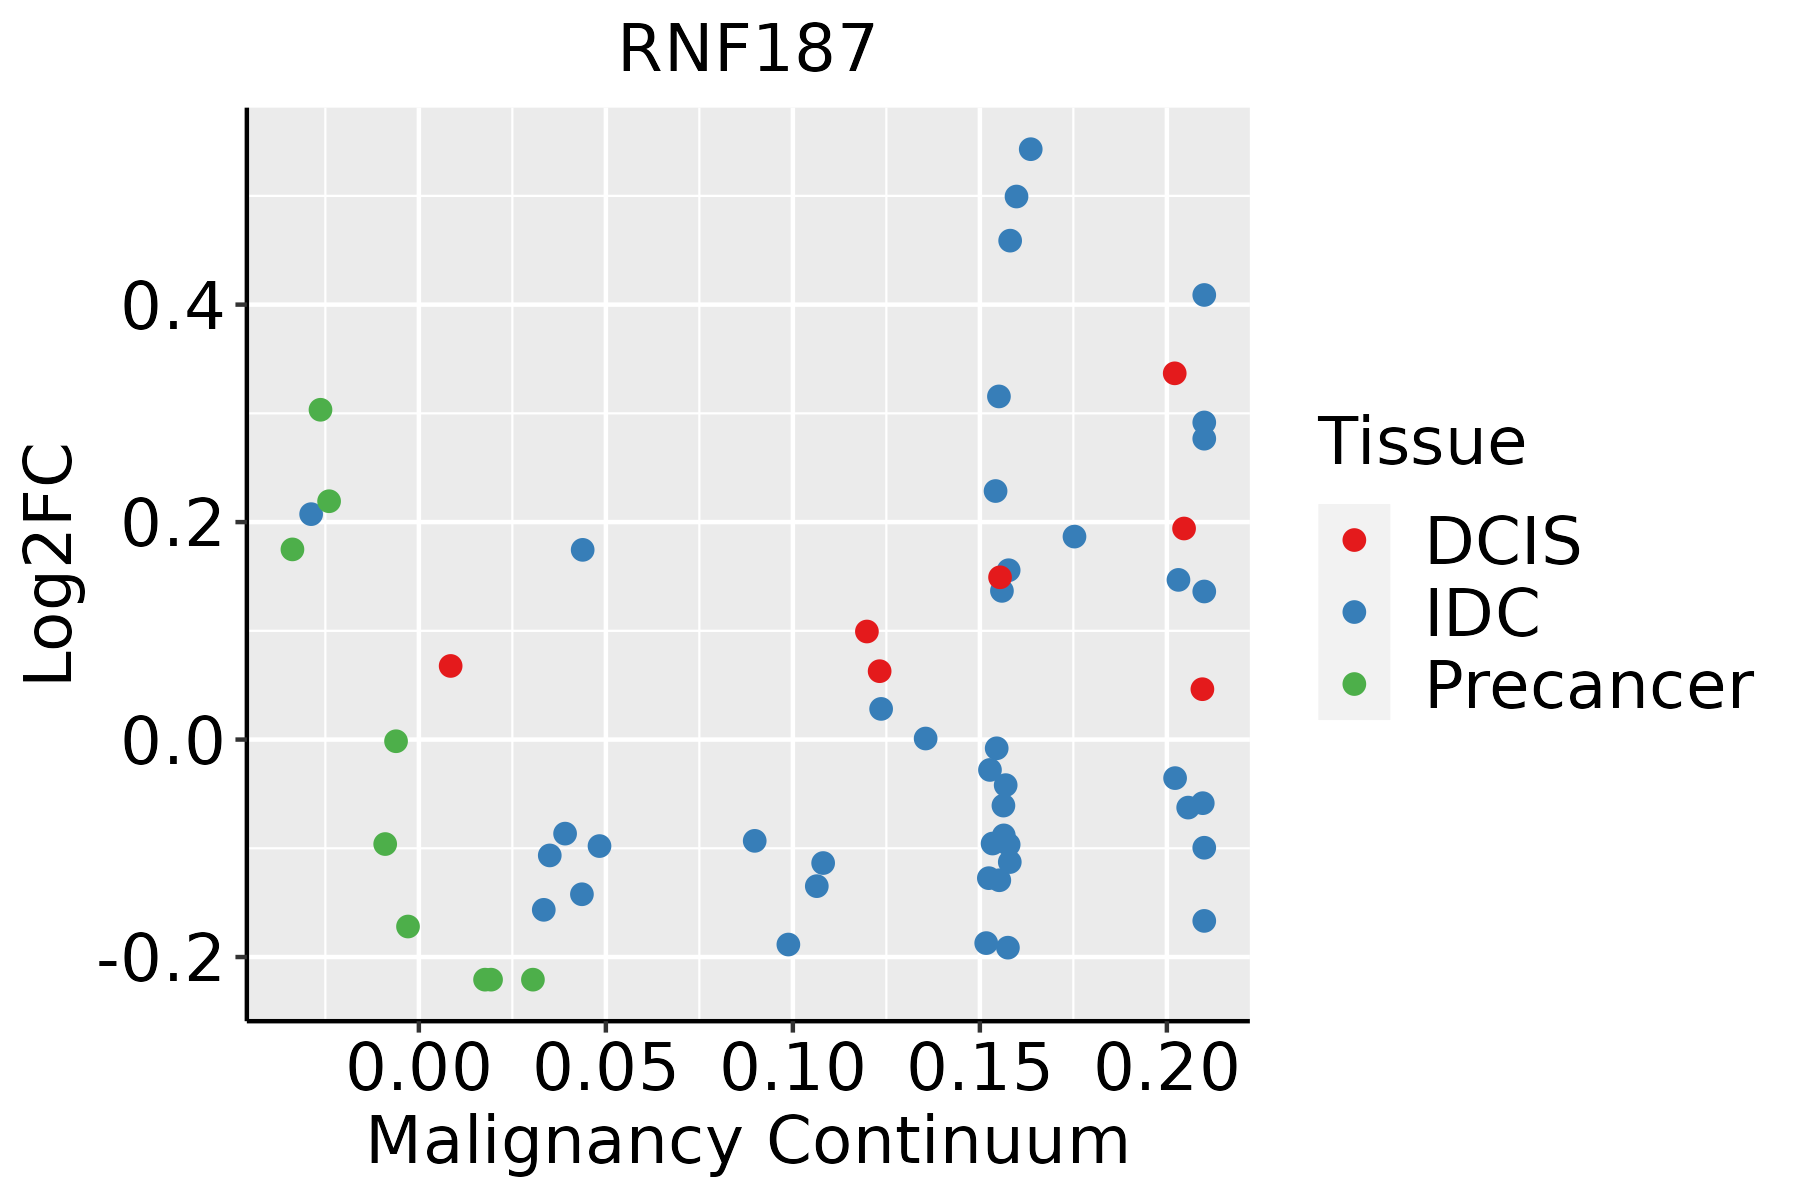 | IDC: Invasive ductal carcinoma |
| DCIS: Ductal carcinoma in situ | ||
| Precancer(BRCA1-mut): Precancerous lesion from BRCA1 mutation carriers | ||
| Colorectum (GSE201348) |  | FAP: Familial adenomatous polyposis |
| CRC: Colorectal cancer | ||
| Colorectum (HTA11) |  | AD: Adenomas |
| SER: Sessile serrated lesions | ||
| MSI-H: Microsatellite-high colorectal cancer | ||
| MSS: Microsatellite stable colorectal cancer | ||
| Esophagus |  | ESCC: Esophageal squamous cell carcinoma |
| HGIN: High-grade intraepithelial neoplasias | ||
| LGIN: Low-grade intraepithelial neoplasias | ||
| Liver | 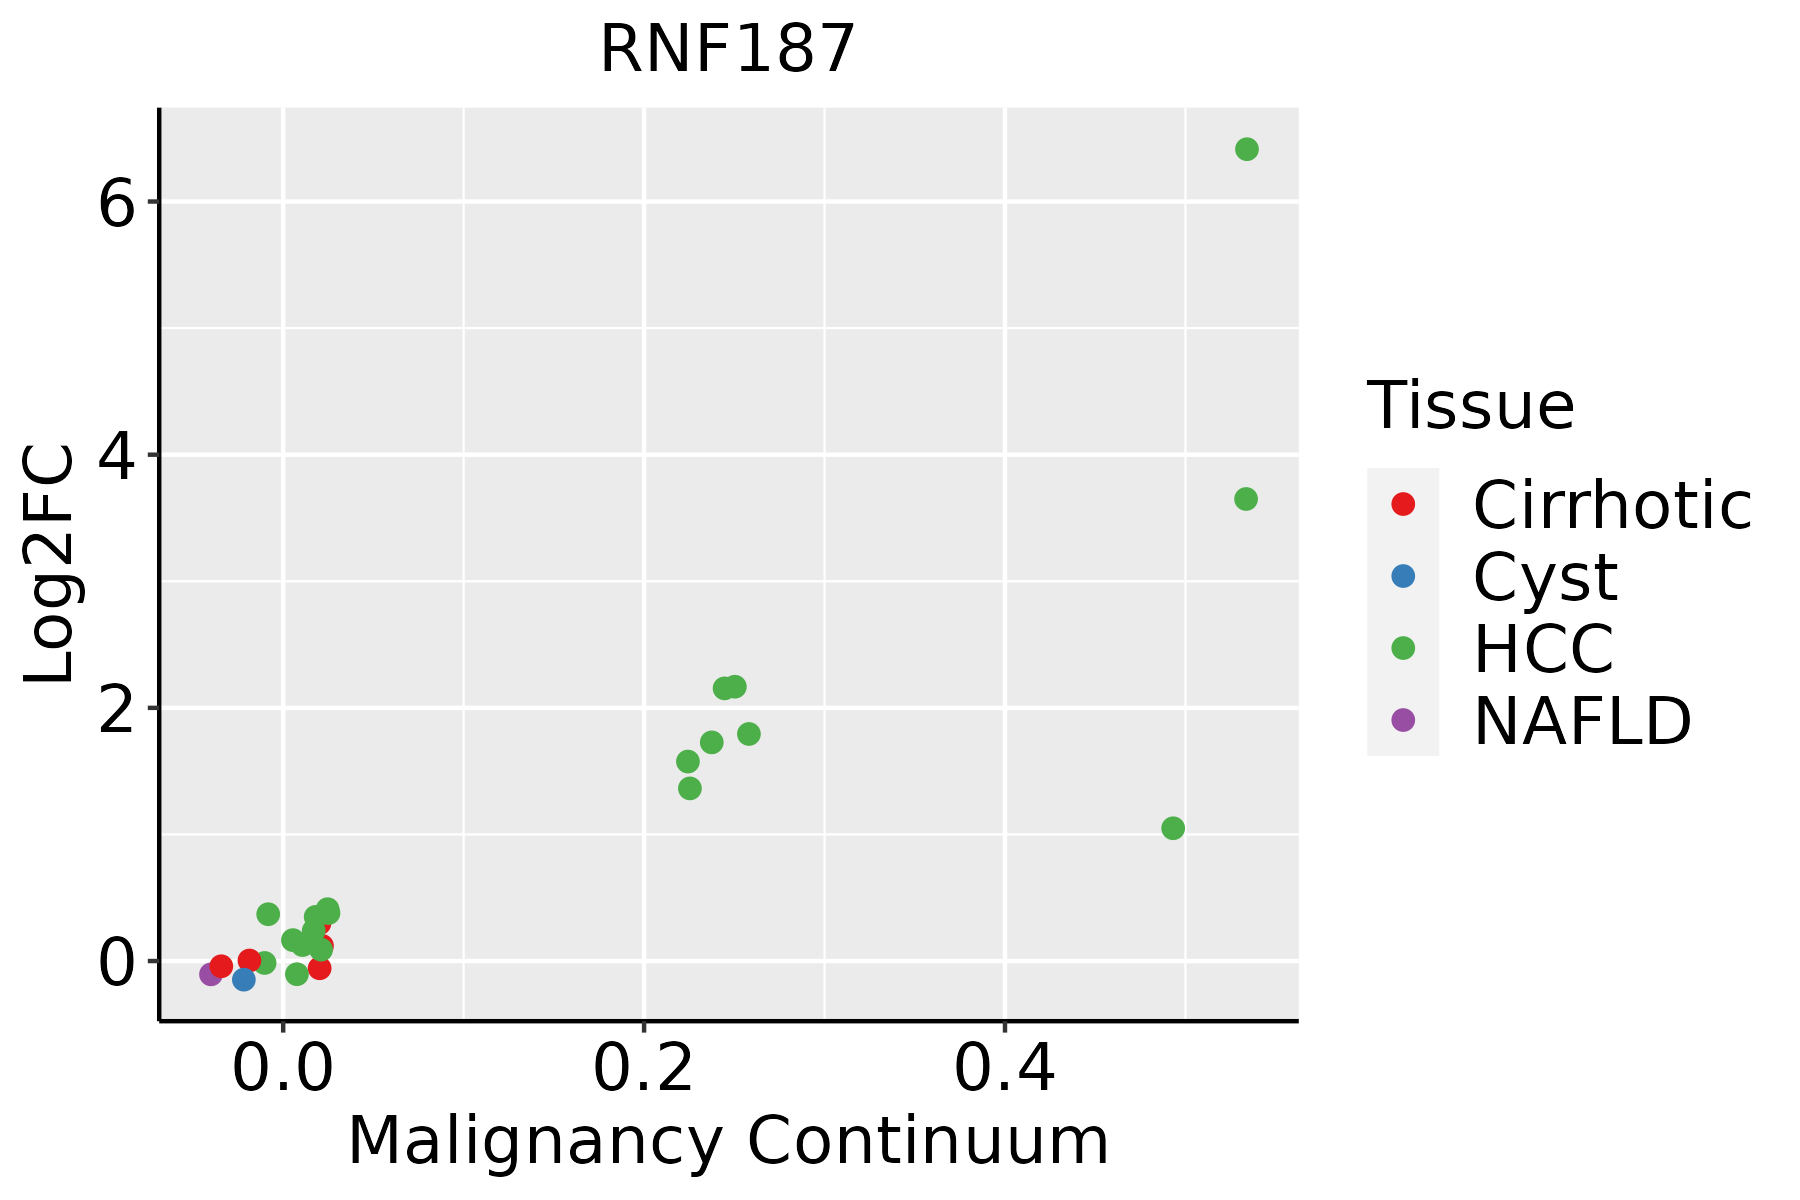 | HCC: Hepatocellular carcinoma |
| NAFLD: Non-alcoholic fatty liver disease | ||
| Oral Cavity | 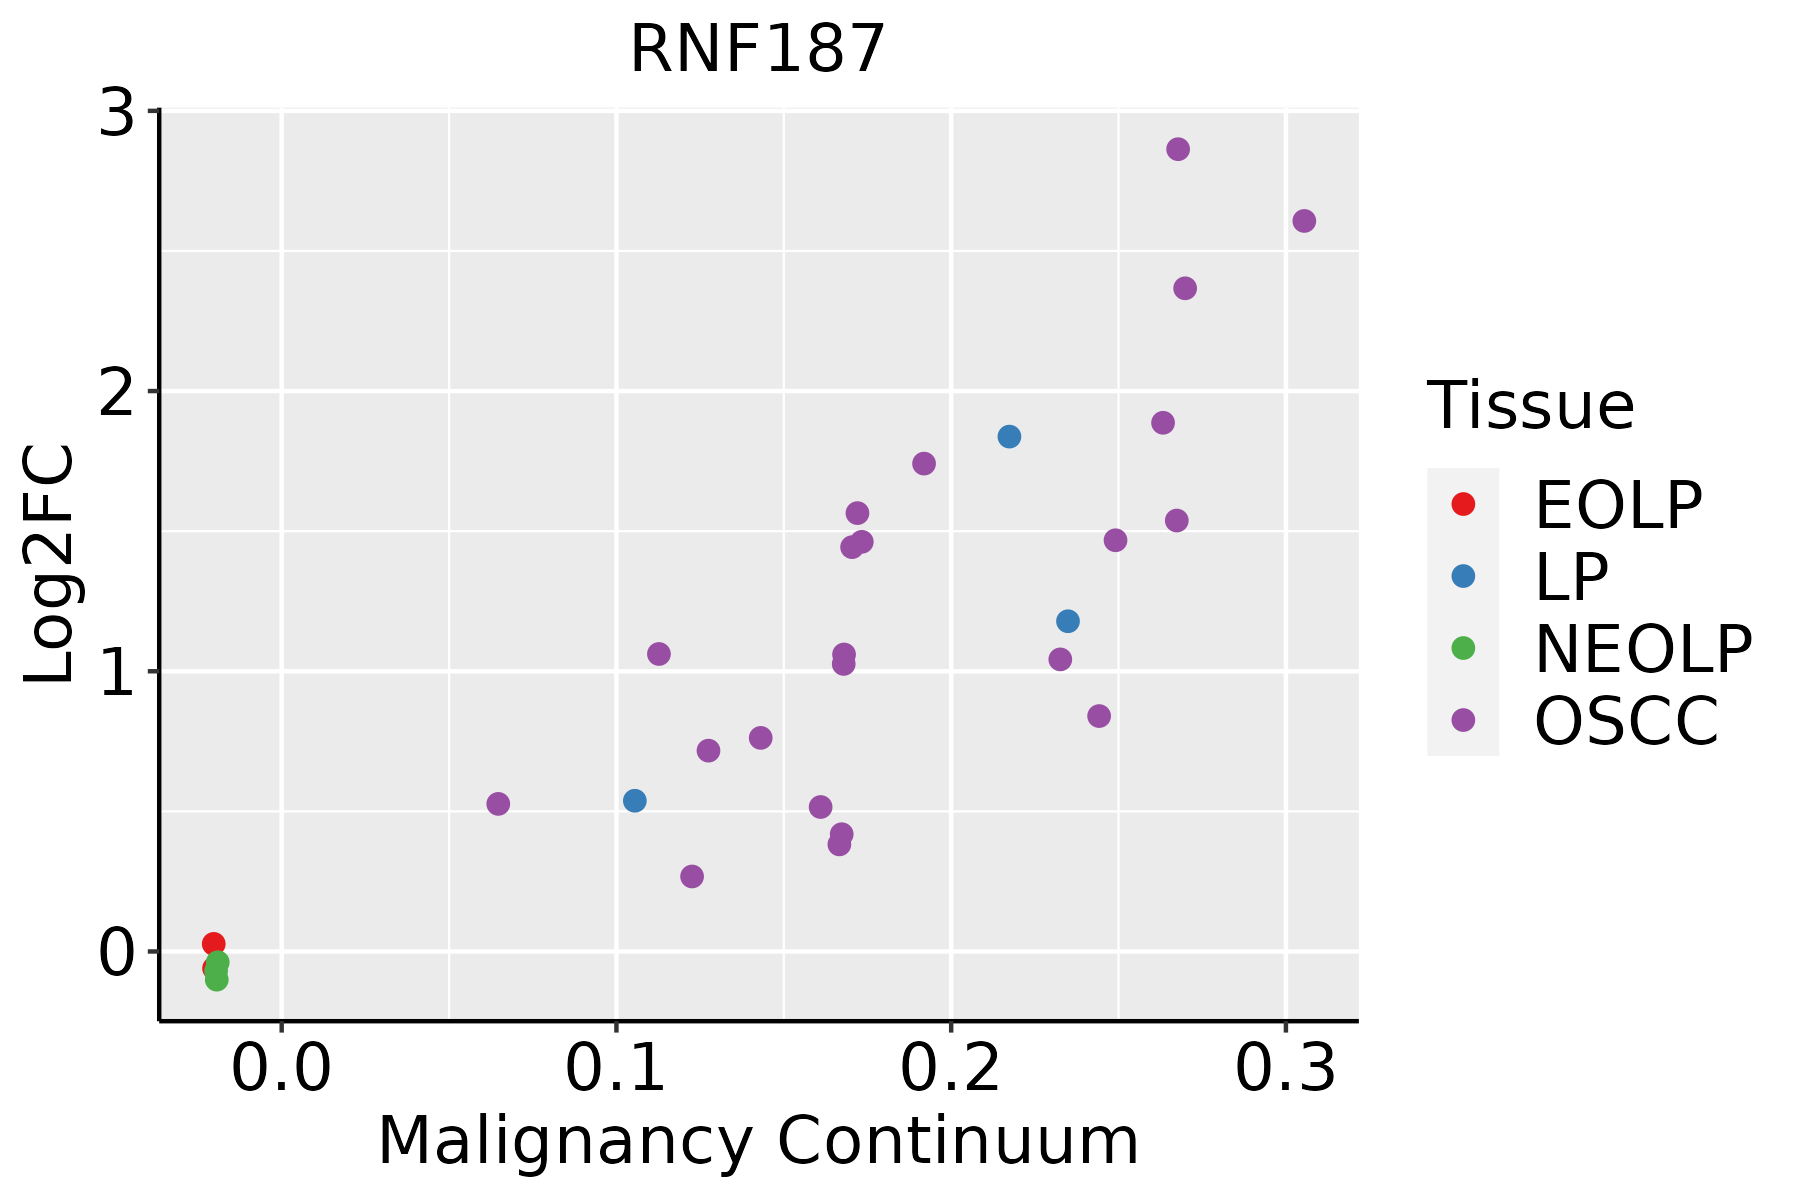 | EOLP: Erosive Oral lichen planus |
| LP: leukoplakia | ||
| NEOLP: Non-erosive oral lichen planus | ||
| OSCC: Oral squamous cell carcinoma | ||
| Prostate | 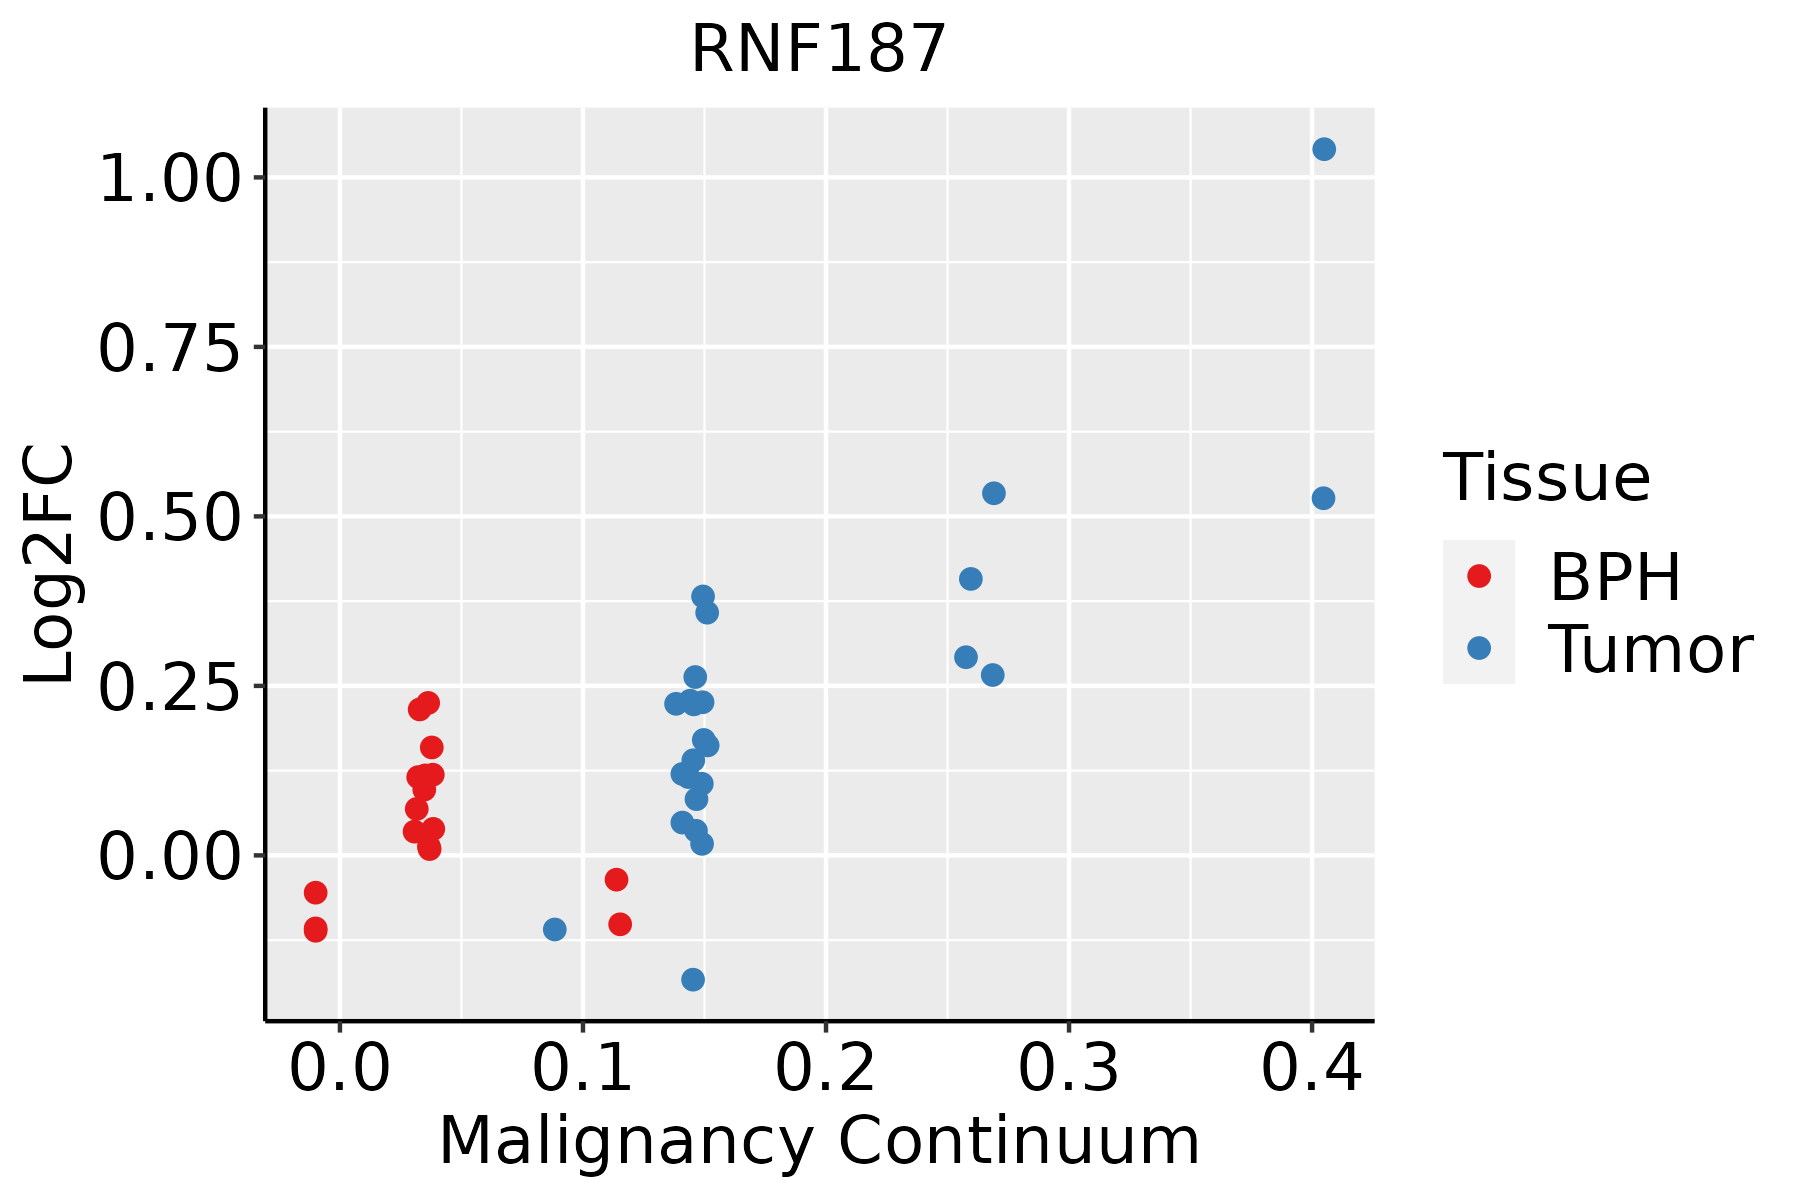 | BPH: Benign Prostatic Hyperplasia |
| Skin | 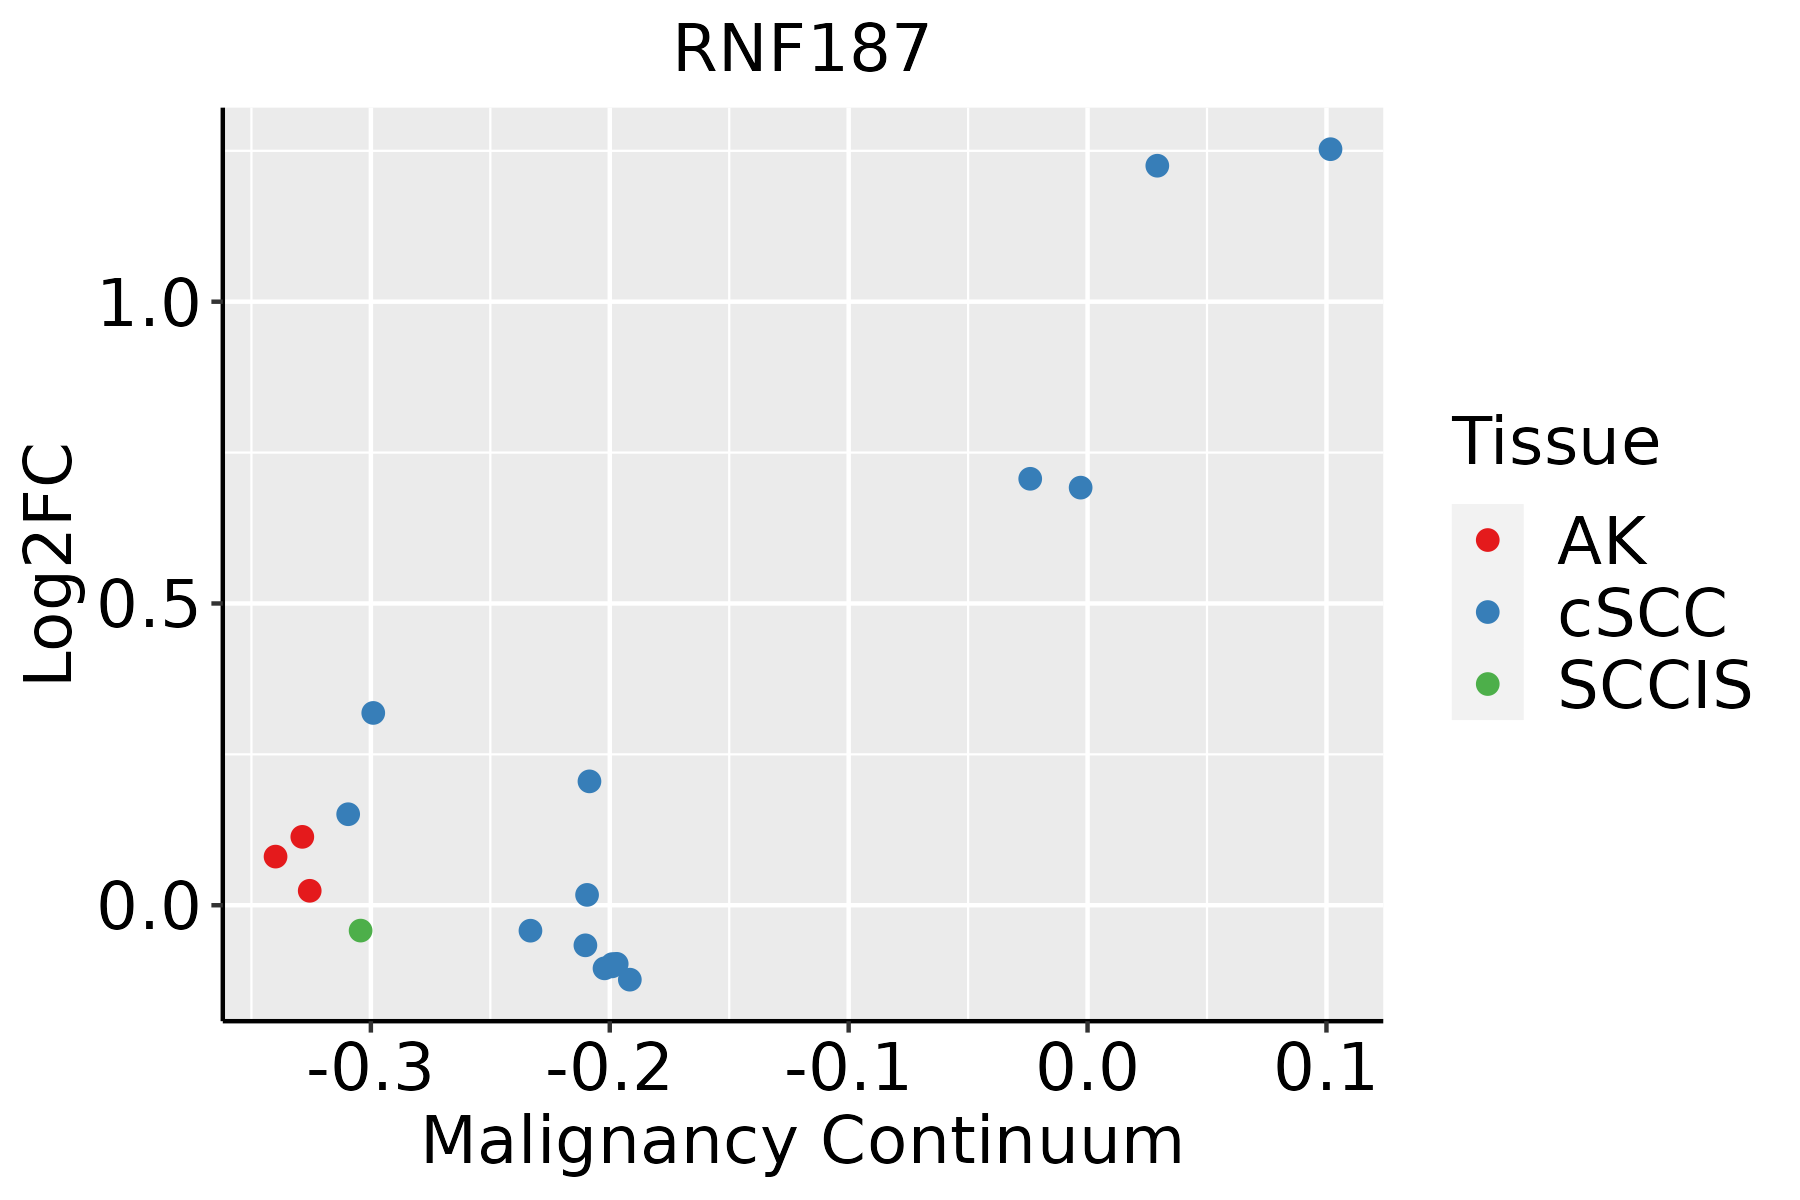 | AK: Actinic keratosis |
| cSCC: Cutaneous squamous cell carcinoma | ||
| SCCIS:squamous cell carcinoma in situ | ||
| Thyroid |  | ATC: Anaplastic thyroid cancer |
| HT: Hashimoto's thyroiditis | ||
| PTC: Papillary thyroid cancer |
| ∗log2FC in expression of this searched gene in stem-like cells from each diseased tissue sample relative to stem-like cells in normal samples in each tissue plotted against the malignancy continuum. Samples are colored based on if they are from different disease stage. |
Top |
Malignant transformation related pathway analysis |
| Find out the enriched GO biological processes and KEGG pathways involved in transition from healthy to precancer to cancer |
| Tissue | Disease Stage | Enriched GO biological Processes |
| Colorectum | AD |  |
| Colorectum | SER |  |
| Colorectum | MSS |  |
| Colorectum | MSI-H |  |
| Colorectum | FAP |  |
| ∗Top 15 enriched GO BP terms are showed in the bar plot of each disease state in each tissue. Each row represents a significant GO biological process which is colored according to the -log10(p.adjust). |
| Page: 1 2 3 4 5 6 7 8 9 |
| GO ID | Tissue | Disease Stage | Description | Gene Ratio | Bg Ratio | pvalue | p.adjust | Count |
| GO:00104989 | Breast | Precancer | proteasomal protein catabolic process | 58/1080 | 490/18723 | 1.54e-07 | 8.05e-06 | 58 |
| GO:00431619 | Breast | Precancer | proteasome-mediated ubiquitin-dependent protein catabolic process | 42/1080 | 412/18723 | 2.49e-04 | 3.72e-03 | 42 |
| GO:001049814 | Breast | IDC | proteasomal protein catabolic process | 75/1434 | 490/18723 | 5.59e-09 | 4.41e-07 | 75 |
| GO:004316114 | Breast | IDC | proteasome-mediated ubiquitin-dependent protein catabolic process | 57/1434 | 412/18723 | 9.55e-06 | 2.68e-04 | 57 |
| GO:001049824 | Breast | DCIS | proteasomal protein catabolic process | 75/1390 | 490/18723 | 1.44e-09 | 1.40e-07 | 75 |
| GO:004316124 | Breast | DCIS | proteasome-mediated ubiquitin-dependent protein catabolic process | 57/1390 | 412/18723 | 3.76e-06 | 1.16e-04 | 57 |
| GO:0010498 | Colorectum | AD | proteasomal protein catabolic process | 174/3918 | 490/18723 | 3.18e-14 | 7.66e-12 | 174 |
| GO:0043161 | Colorectum | AD | proteasome-mediated ubiquitin-dependent protein catabolic process | 141/3918 | 412/18723 | 1.77e-10 | 1.68e-08 | 141 |
| GO:0000209 | Colorectum | AD | protein polyubiquitination | 78/3918 | 236/18723 | 8.71e-06 | 2.06e-04 | 78 |
| GO:0070936 | Colorectum | AD | protein K48-linked ubiquitination | 27/3918 | 65/18723 | 1.31e-04 | 1.88e-03 | 27 |
| GO:0051865 | Colorectum | AD | protein autoubiquitination | 28/3918 | 73/18723 | 4.87e-04 | 5.30e-03 | 28 |
| GO:00104981 | Colorectum | SER | proteasomal protein catabolic process | 132/2897 | 490/18723 | 3.08e-11 | 5.55e-09 | 132 |
| GO:00431611 | Colorectum | SER | proteasome-mediated ubiquitin-dependent protein catabolic process | 105/2897 | 412/18723 | 7.48e-08 | 4.70e-06 | 105 |
| GO:00002091 | Colorectum | SER | protein polyubiquitination | 58/2897 | 236/18723 | 1.69e-04 | 3.18e-03 | 58 |
| GO:00104982 | Colorectum | MSS | proteasomal protein catabolic process | 157/3467 | 490/18723 | 2.39e-13 | 5.25e-11 | 157 |
| GO:00431612 | Colorectum | MSS | proteasome-mediated ubiquitin-dependent protein catabolic process | 127/3467 | 412/18723 | 7.70e-10 | 6.32e-08 | 127 |
| GO:00002092 | Colorectum | MSS | protein polyubiquitination | 72/3467 | 236/18723 | 5.19e-06 | 1.42e-04 | 72 |
| GO:00709361 | Colorectum | MSS | protein K48-linked ubiquitination | 27/3467 | 65/18723 | 1.40e-05 | 3.18e-04 | 27 |
| GO:00518651 | Colorectum | MSS | protein autoubiquitination | 25/3467 | 73/18723 | 1.00e-03 | 1.00e-02 | 25 |
| GO:0010498111 | Esophagus | ESCC | proteasomal protein catabolic process | 369/8552 | 490/18723 | 1.13e-41 | 1.80e-38 | 369 |
| Page: 1 2 3 4 |
| Pathway ID | Tissue | Disease Stage | Description | Gene Ratio | Bg Ratio | pvalue | p.adjust | qvalue | Count |
| Page: 1 |
Top |
Cell-cell communication analysis |
| Identification of potential cell-cell interactions between two cell types and their ligand-receptor pairs for different disease states |
| Ligand | Receptor | LRpair | Pathway | Tissue | Disease Stage |
| Page: 1 |
Top |
Single-cell gene regulatory network inference analysis |
| Find out the significant the regulons (TFs) and the target genes of each regulon across cell types for different disease states |
| TF | Cell Type | Tissue | Disease Stage | Target Gene | RSS | Regulon Activity |
| ∗The dot plots of a searched regulon are shown for all cell subpopulations in each disease state of each tissue based on the regulon specific score inferred using pySCENIC and by calculating the average expression. |
| Page: 1 |
Top |
Somatic mutation of malignant transformation related genes |
| Annotation of somatic variants for genes involved in malignant transformation |
| Hugo Symbol | Variant Class | Variant Classification | dbSNP RS | HGVSc | HGVSp | HGVSp Short | SWISSPROT | BIOTYPE | SIFT | PolyPhen | Tumor Sample Barcode | Tissue | Histology | Sex | Age | Stage | Therapy Types | Drugs | Outcome |
| RNF187 | SNV | Missense_Mutation | novel | c.436G>A | p.Ala146Thr | p.A146T | Q5TA31 | protein_coding | tolerated(0.83) | probably_damaging(0.988) | TCGA-WS-AB45-01 | Colorectum | colon adenocarcinoma | Female | <65 | I/II | Unknown | Unknown | SD |
| RNF187 | SNV | Missense_Mutation | novel | c.520N>A | p.Asp174Asn | p.D174N | Q5TA31 | protein_coding | deleterious(0) | probably_damaging(0.934) | TCGA-EO-A22R-01 | Endometrium | uterine corpus endometrioid carcinoma | Female | <65 | I/II | Unknown | Unknown | SD |
| RNF187 | SNV | Missense_Mutation | novel | c.503N>A | p.Arg168Lys | p.R168K | Q5TA31 | protein_coding | tolerated(0.05) | possibly_damaging(0.79) | TCGA-EO-A3KX-01 | Endometrium | uterine corpus endometrioid carcinoma | Female | >=65 | I/II | Unknown | Unknown | SD |
| Page: 1 |
Top |
Related drugs of malignant transformation related genes |
| Identification of chemicals and drugs interact with genes involved in malignant transfromation |
| (DGIdb 4.0) |
| Entrez ID | Symbol | Category | Interaction Types | Drug Claim Name | Drug Name | PMIDs |
| Page: 1 |

Copyright 2023-Present -The University of Texas Health Science Center at Houston |