
|
|||||
|
 | |
| |
| |
| |
| |
| |
|
Gene: RNF181 |
Gene summary for RNF181 |
| Gene information | Species | Human | Gene symbol | RNF181 | Gene ID | 51255 |
| Gene name | ring finger protein 181 | |
| Gene Alias | HSPC238 | |
| Cytomap | 2p11.2 | |
| Gene Type | protein-coding | GO ID | GO:0006464 | UniProtAcc | Q9P0P0 |
Top |
Malignant transformation analysis |
| Identification of the aberrant gene expression in precancerous and cancerous lesions by comparing the gene expression of stem-like cells in diseased tissues with normal stem cells |
| Entrez ID | Symbol | Replicates | Species | Organ | Tissue | Adj P-value | Log2FC | Malignancy |
| 51255 | RNF181 | GSM4909282 | Human | Breast | IDC | 9.54e-05 | 2.08e-01 | -0.0288 |
| 51255 | RNF181 | GSM4909286 | Human | Breast | IDC | 5.36e-03 | -3.15e-01 | 0.1081 |
| 51255 | RNF181 | GSM4909294 | Human | Breast | IDC | 1.76e-03 | -6.14e-02 | 0.2022 |
| 51255 | RNF181 | GSM4909296 | Human | Breast | IDC | 1.42e-16 | 1.36e-01 | 0.1524 |
| 51255 | RNF181 | GSM4909297 | Human | Breast | IDC | 1.16e-20 | -1.17e-01 | 0.1517 |
| 51255 | RNF181 | GSM4909301 | Human | Breast | IDC | 1.02e-21 | 4.68e-01 | 0.1577 |
| 51255 | RNF181 | GSM4909304 | Human | Breast | IDC | 1.82e-05 | 2.45e-01 | 0.1636 |
| 51255 | RNF181 | GSM4909309 | Human | Breast | IDC | 5.01e-04 | 7.75e-02 | 0.0483 |
| 51255 | RNF181 | GSM4909311 | Human | Breast | IDC | 1.41e-39 | -8.51e-02 | 0.1534 |
| 51255 | RNF181 | GSM4909312 | Human | Breast | IDC | 8.94e-20 | -5.25e-02 | 0.1552 |
| 51255 | RNF181 | GSM4909315 | Human | Breast | IDC | 4.86e-06 | 2.07e-01 | 0.21 |
| 51255 | RNF181 | GSM4909316 | Human | Breast | IDC | 3.71e-11 | 4.71e-01 | 0.21 |
| 51255 | RNF181 | GSM4909319 | Human | Breast | IDC | 1.33e-51 | -2.24e-01 | 0.1563 |
| 51255 | RNF181 | GSM4909320 | Human | Breast | IDC | 8.24e-12 | 2.53e-01 | 0.1575 |
| 51255 | RNF181 | GSM4909321 | Human | Breast | IDC | 1.54e-33 | 2.95e-01 | 0.1559 |
| 51255 | RNF181 | ctrl6 | Human | Breast | Precancer | 2.88e-04 | 4.10e-01 | -0.0061 |
| 51255 | RNF181 | brca1 | Human | Breast | Precancer | 6.85e-19 | 4.94e-01 | -0.0338 |
| 51255 | RNF181 | brca2 | Human | Breast | Precancer | 7.50e-20 | 4.61e-01 | -0.024 |
| 51255 | RNF181 | brca3 | Human | Breast | Precancer | 1.25e-26 | 5.38e-01 | -0.0263 |
| 51255 | RNF181 | brca10 | Human | Breast | Precancer | 6.06e-09 | 4.07e-01 | -0.0029 |
| Page: 1 2 3 4 5 6 7 8 9 10 11 |
| Tissue | Expression Dynamics | Abbreviation |
| Breast | 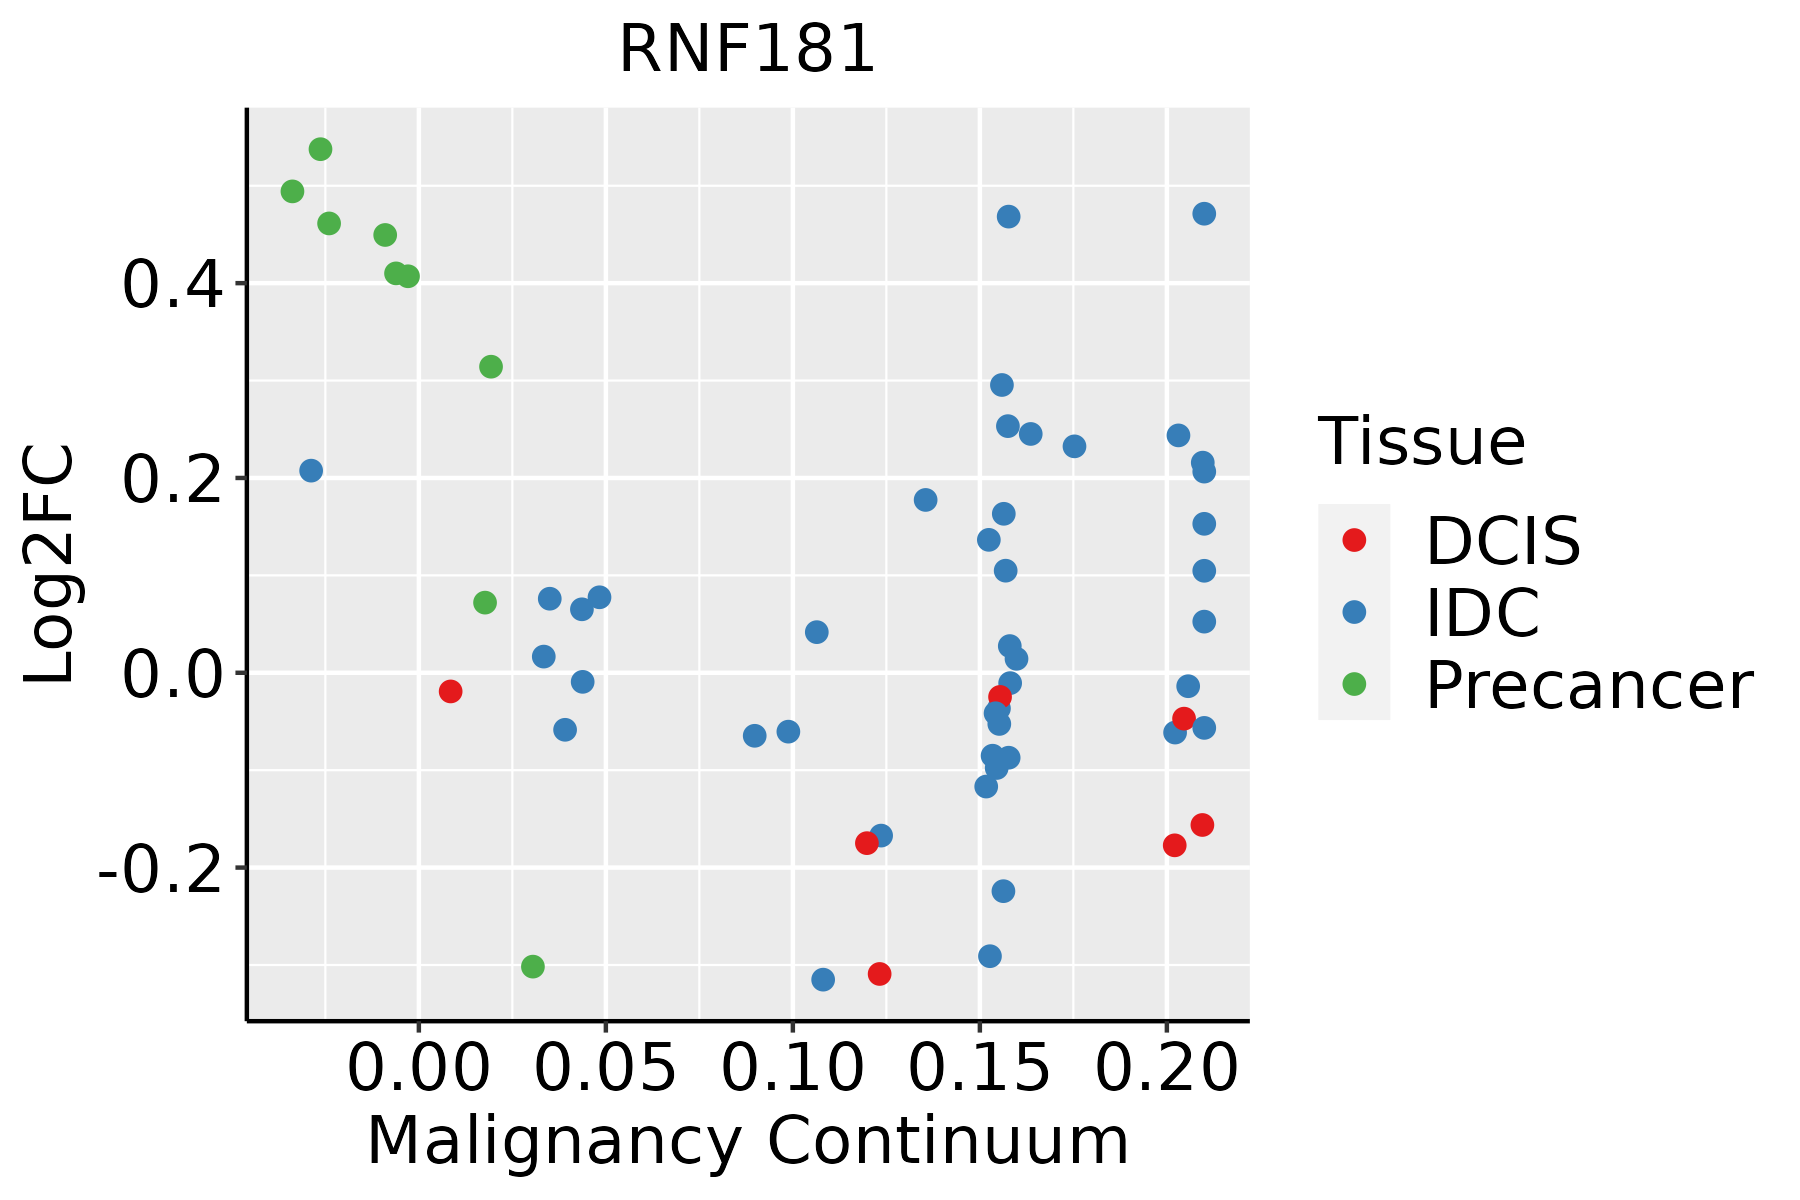 | IDC: Invasive ductal carcinoma |
| DCIS: Ductal carcinoma in situ | ||
| Precancer(BRCA1-mut): Precancerous lesion from BRCA1 mutation carriers | ||
| Cervix | 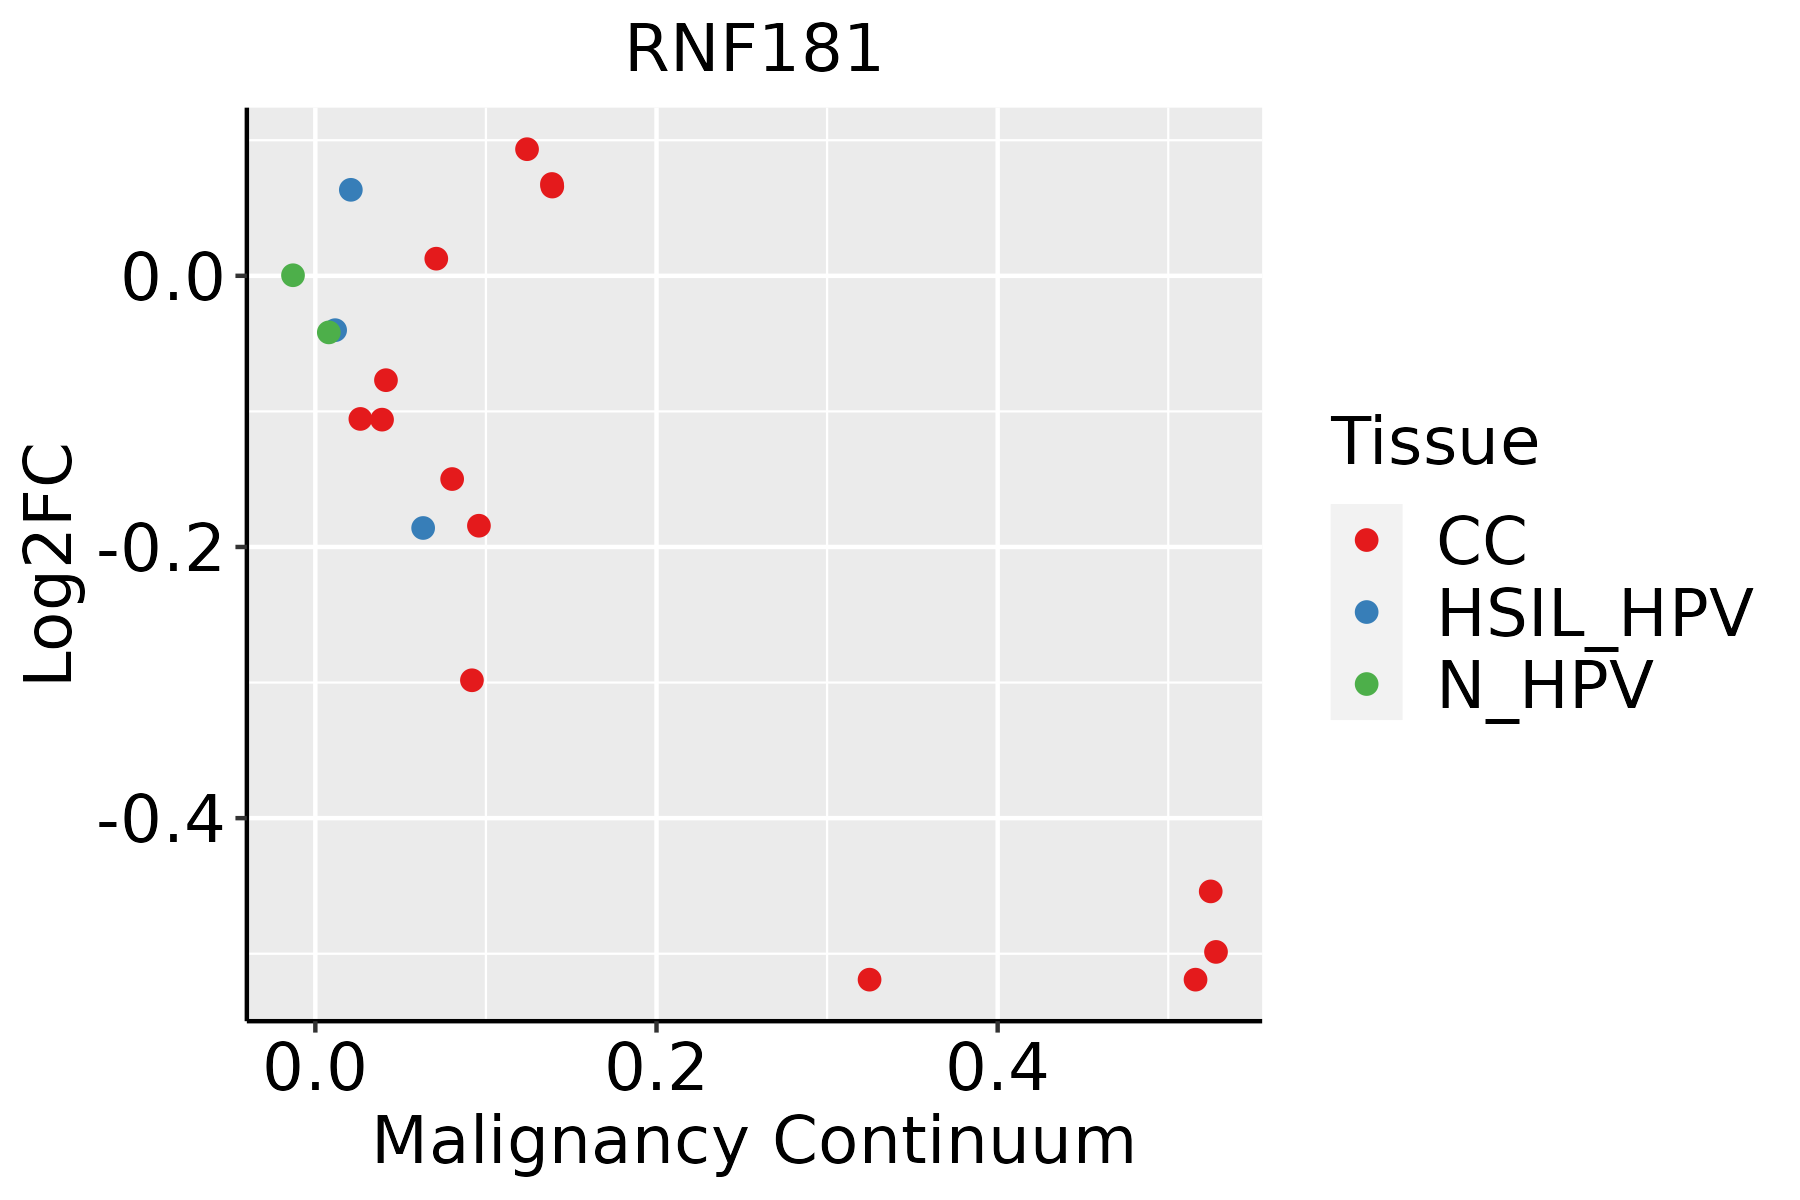 | CC: Cervix cancer |
| HSIL_HPV: HPV-infected high-grade squamous intraepithelial lesions | ||
| N_HPV: HPV-infected normal cervix | ||
| Colorectum (GSE201348) | 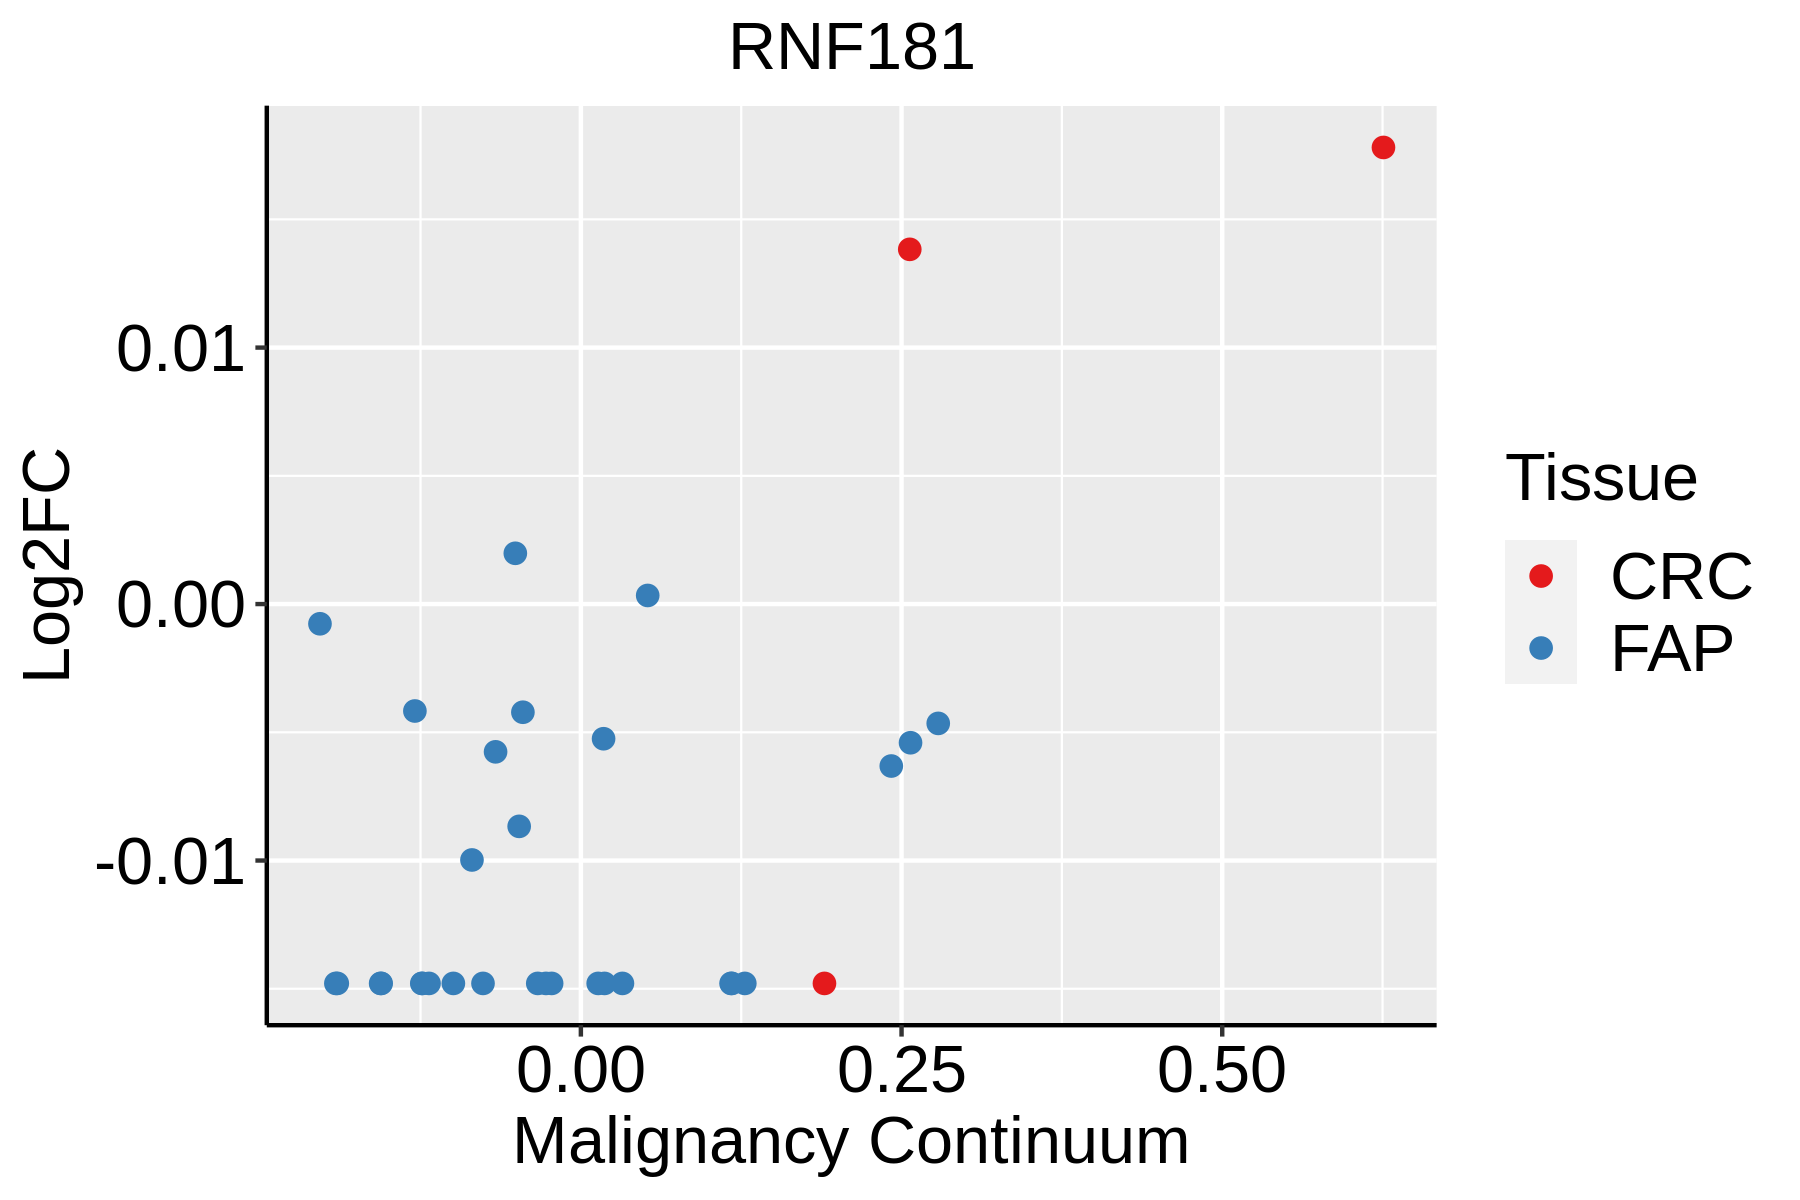 | FAP: Familial adenomatous polyposis |
| CRC: Colorectal cancer | ||
| Colorectum (HTA11) |  | AD: Adenomas |
| SER: Sessile serrated lesions | ||
| MSI-H: Microsatellite-high colorectal cancer | ||
| MSS: Microsatellite stable colorectal cancer | ||
| Endometrium | 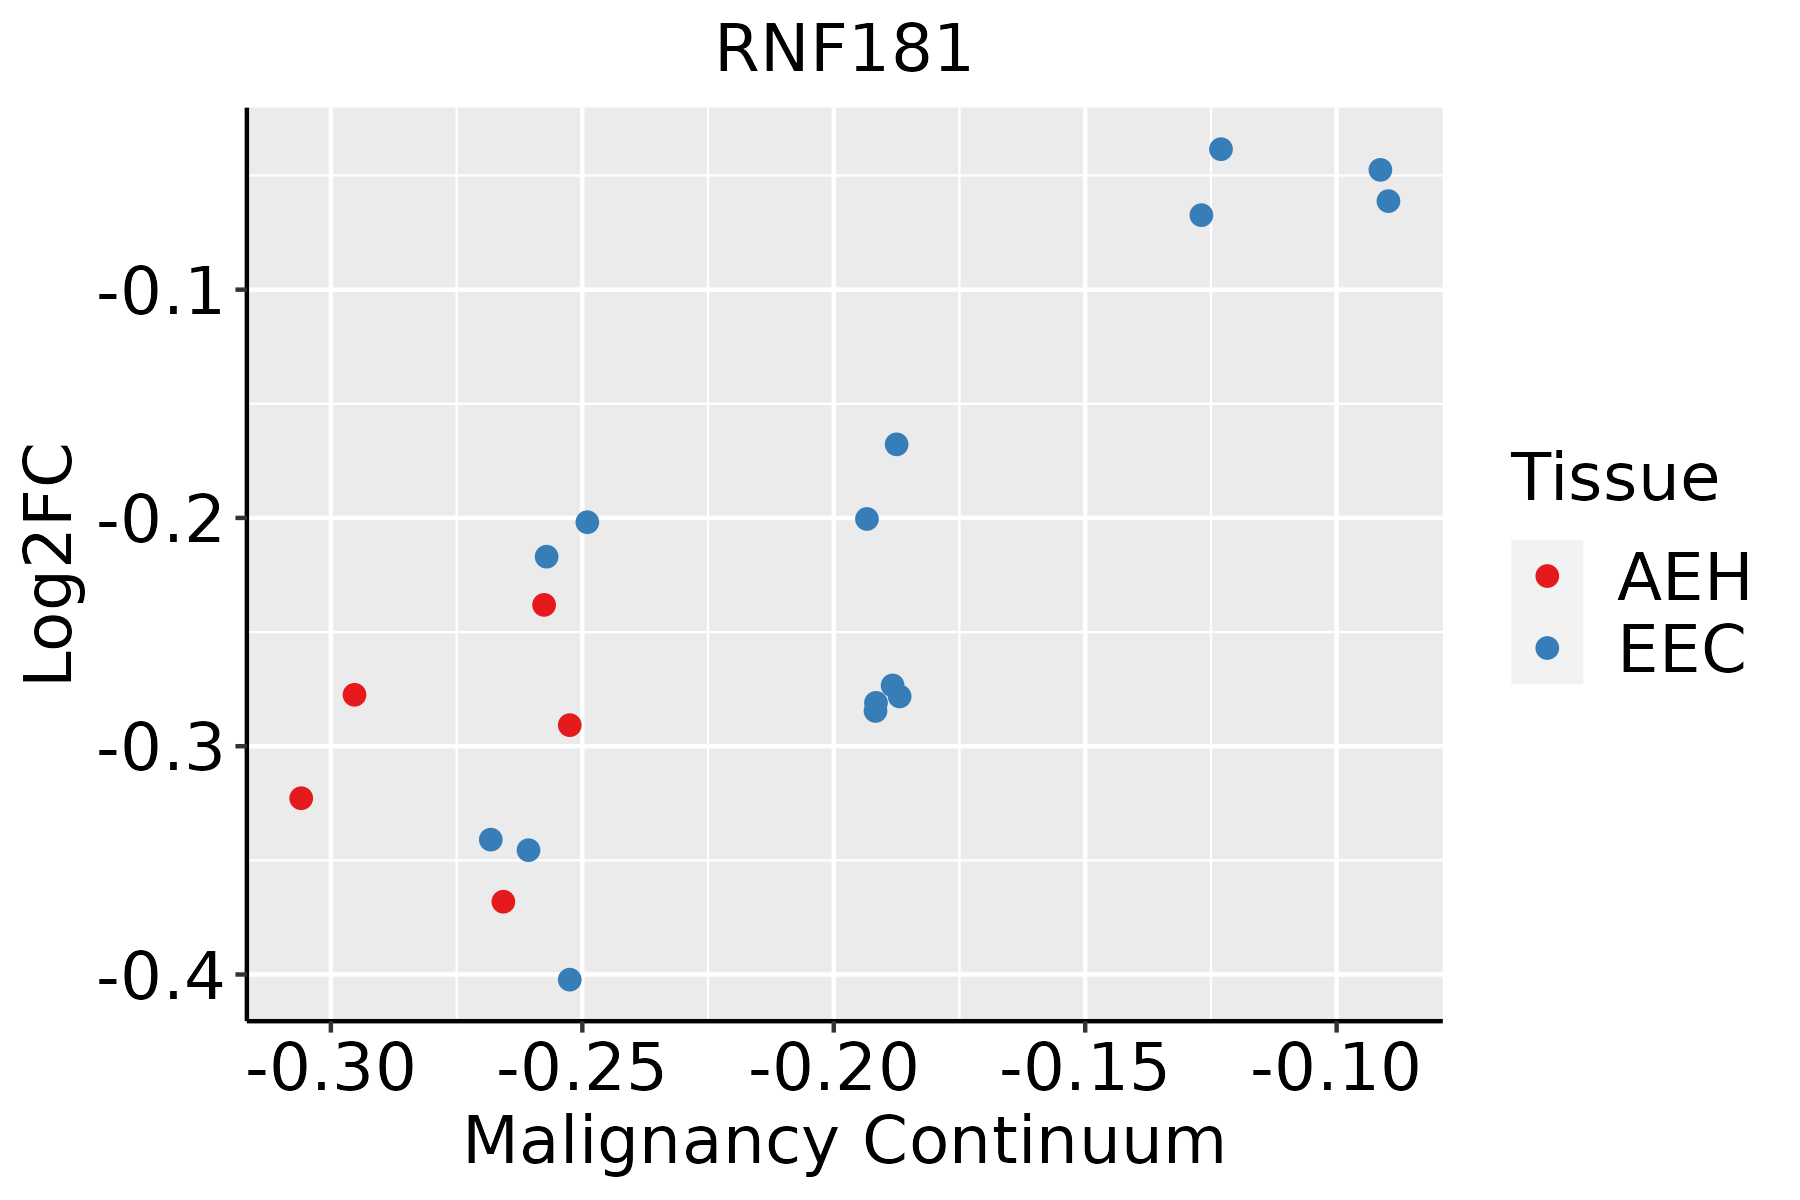 | AEH: Atypical endometrial hyperplasia |
| EEC: Endometrioid Cancer | ||
| Esophagus | 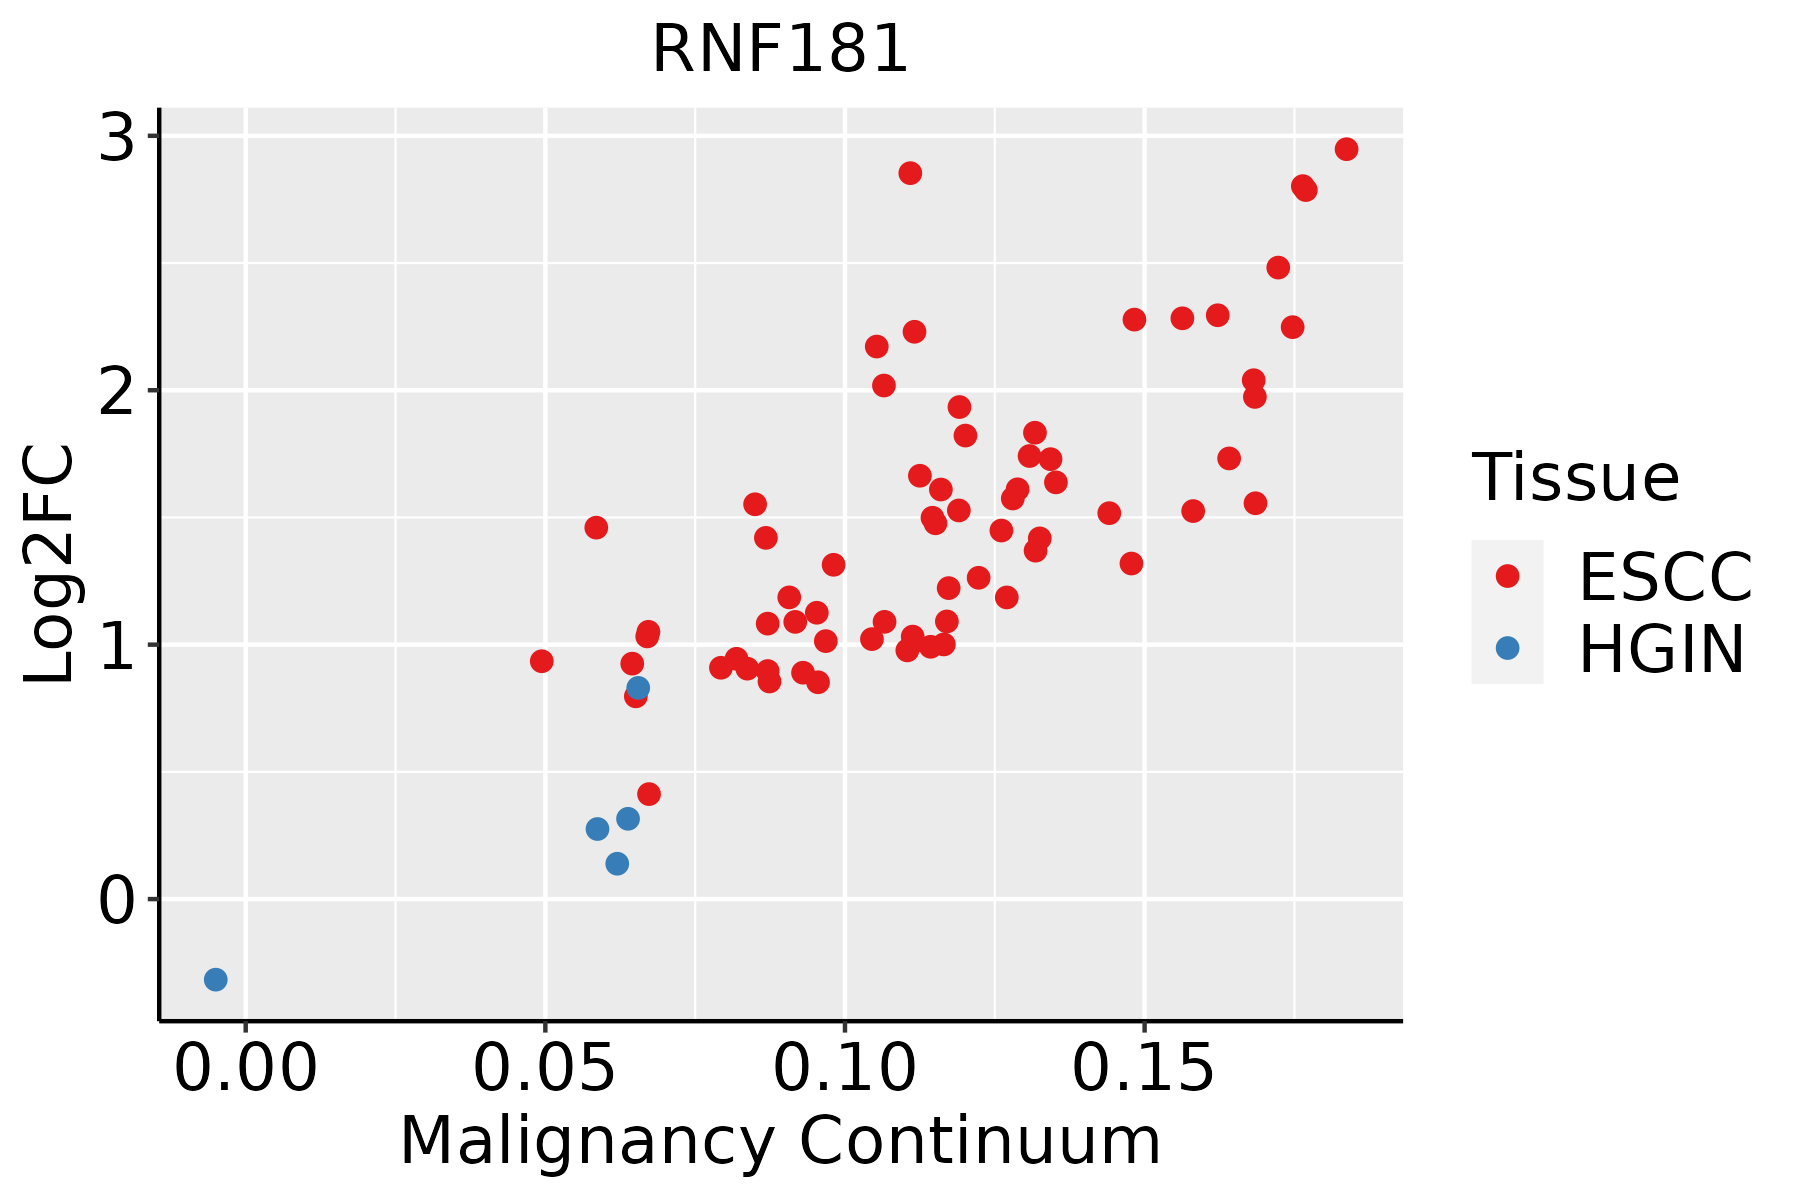 | ESCC: Esophageal squamous cell carcinoma |
| HGIN: High-grade intraepithelial neoplasias | ||
| LGIN: Low-grade intraepithelial neoplasias | ||
| Liver | 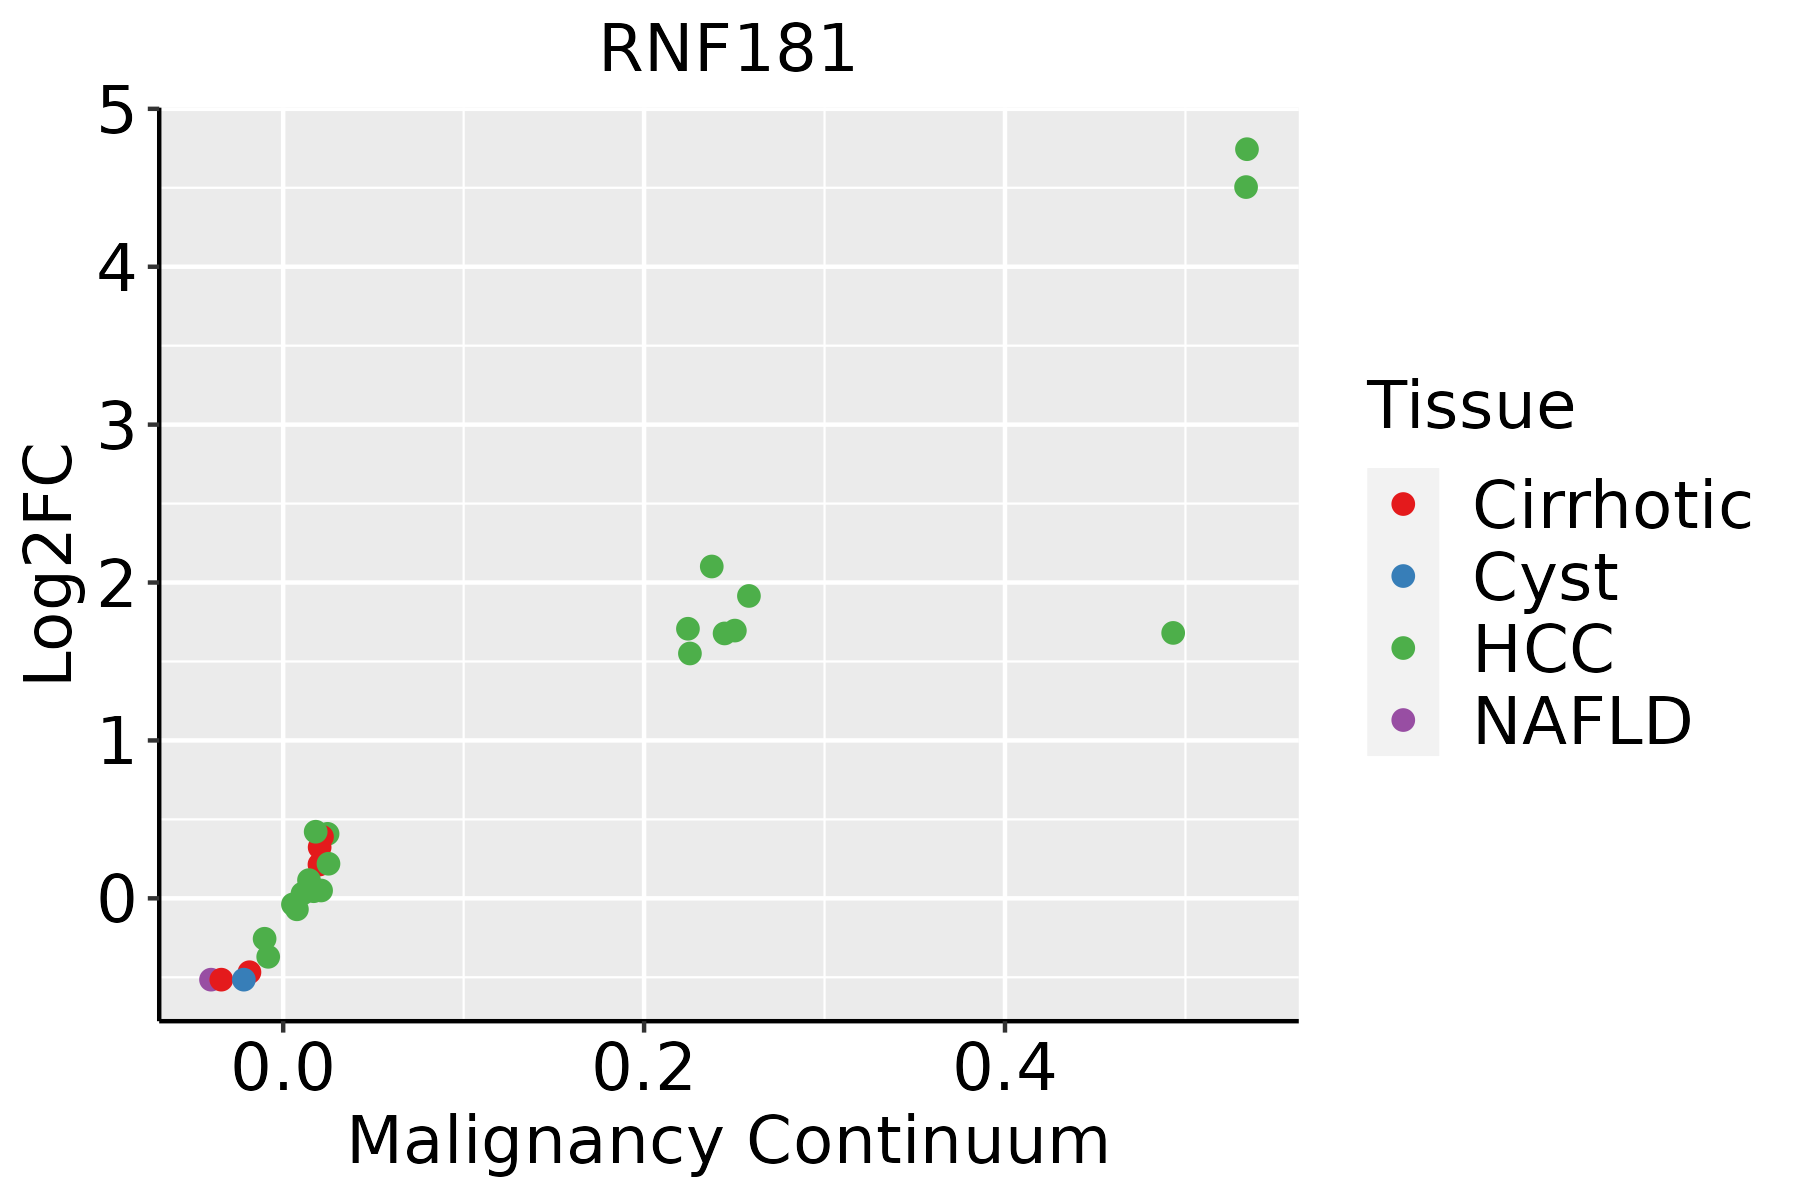 | HCC: Hepatocellular carcinoma |
| NAFLD: Non-alcoholic fatty liver disease | ||
| Oral Cavity | 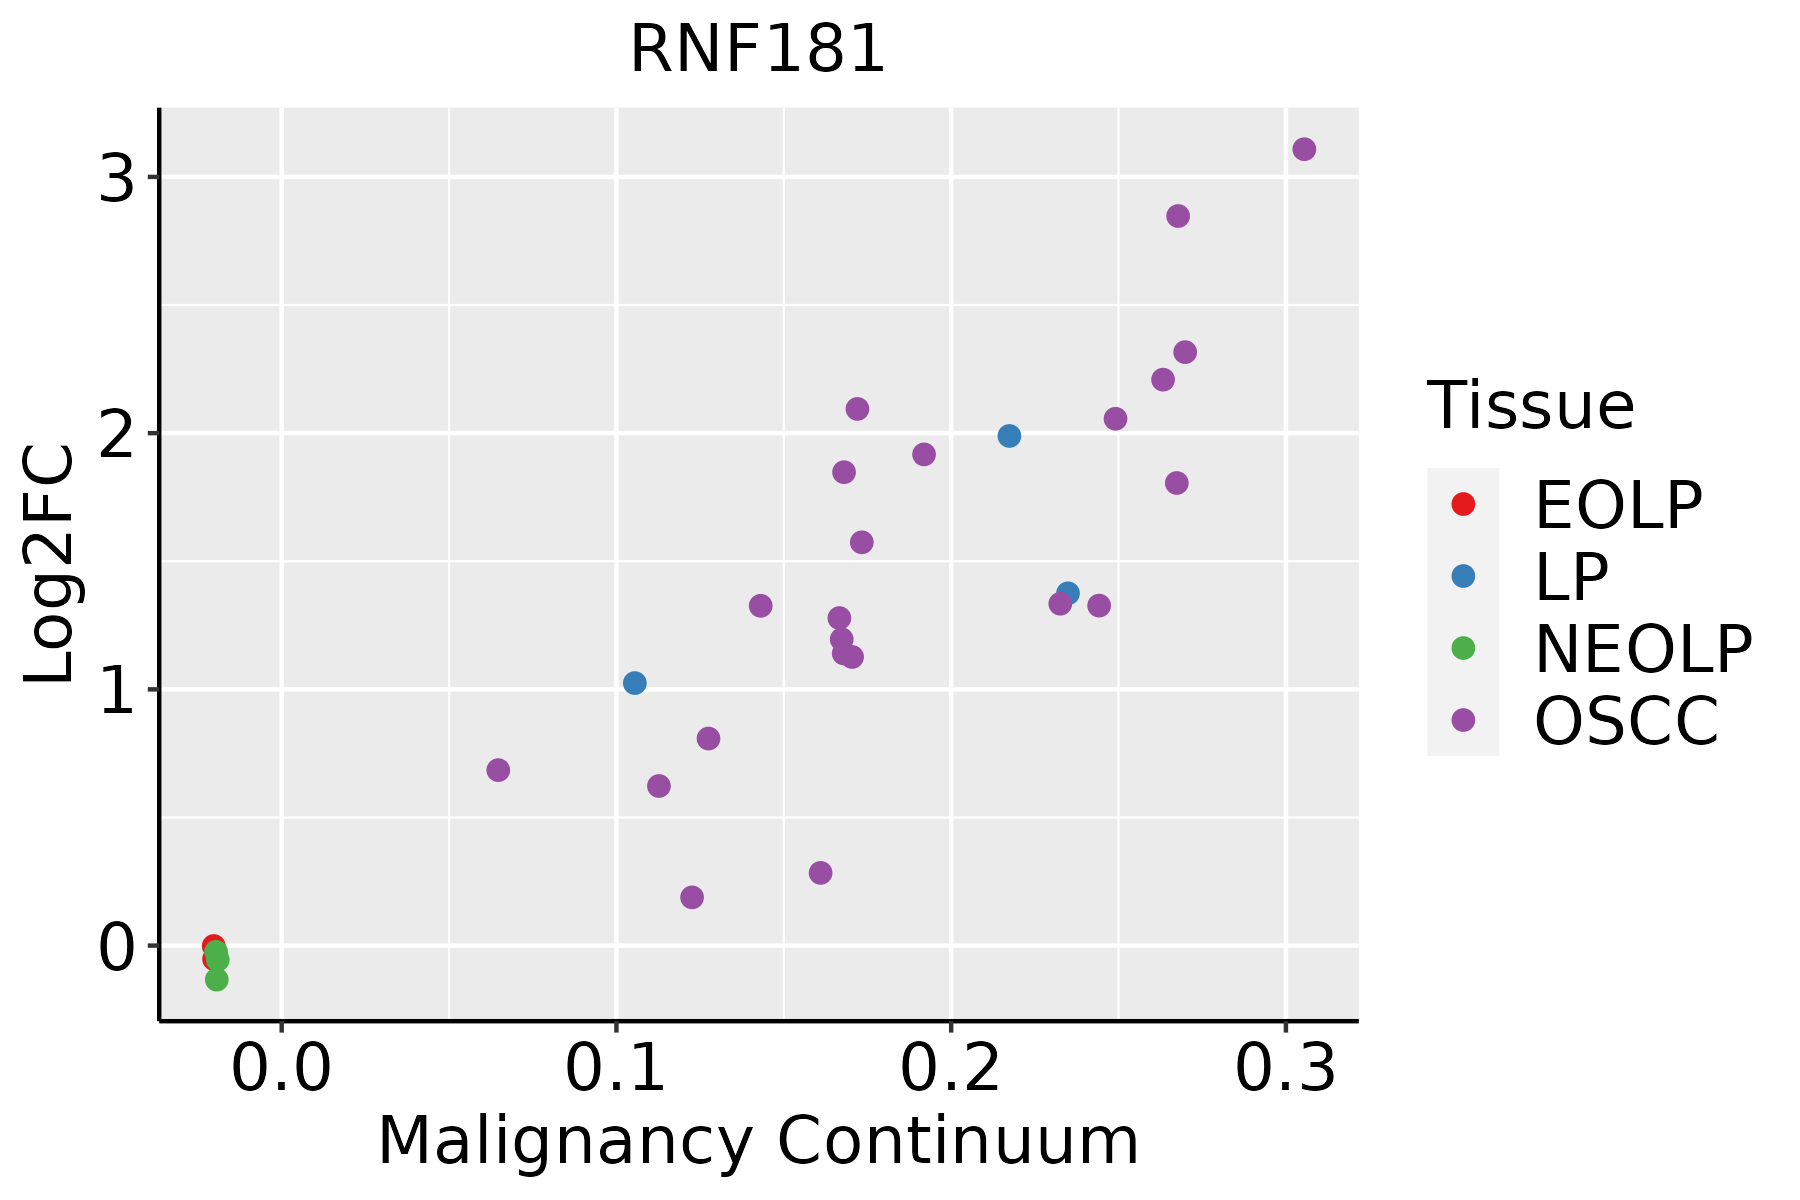 | EOLP: Erosive Oral lichen planus |
| LP: leukoplakia | ||
| NEOLP: Non-erosive oral lichen planus | ||
| OSCC: Oral squamous cell carcinoma | ||
| Prostate | 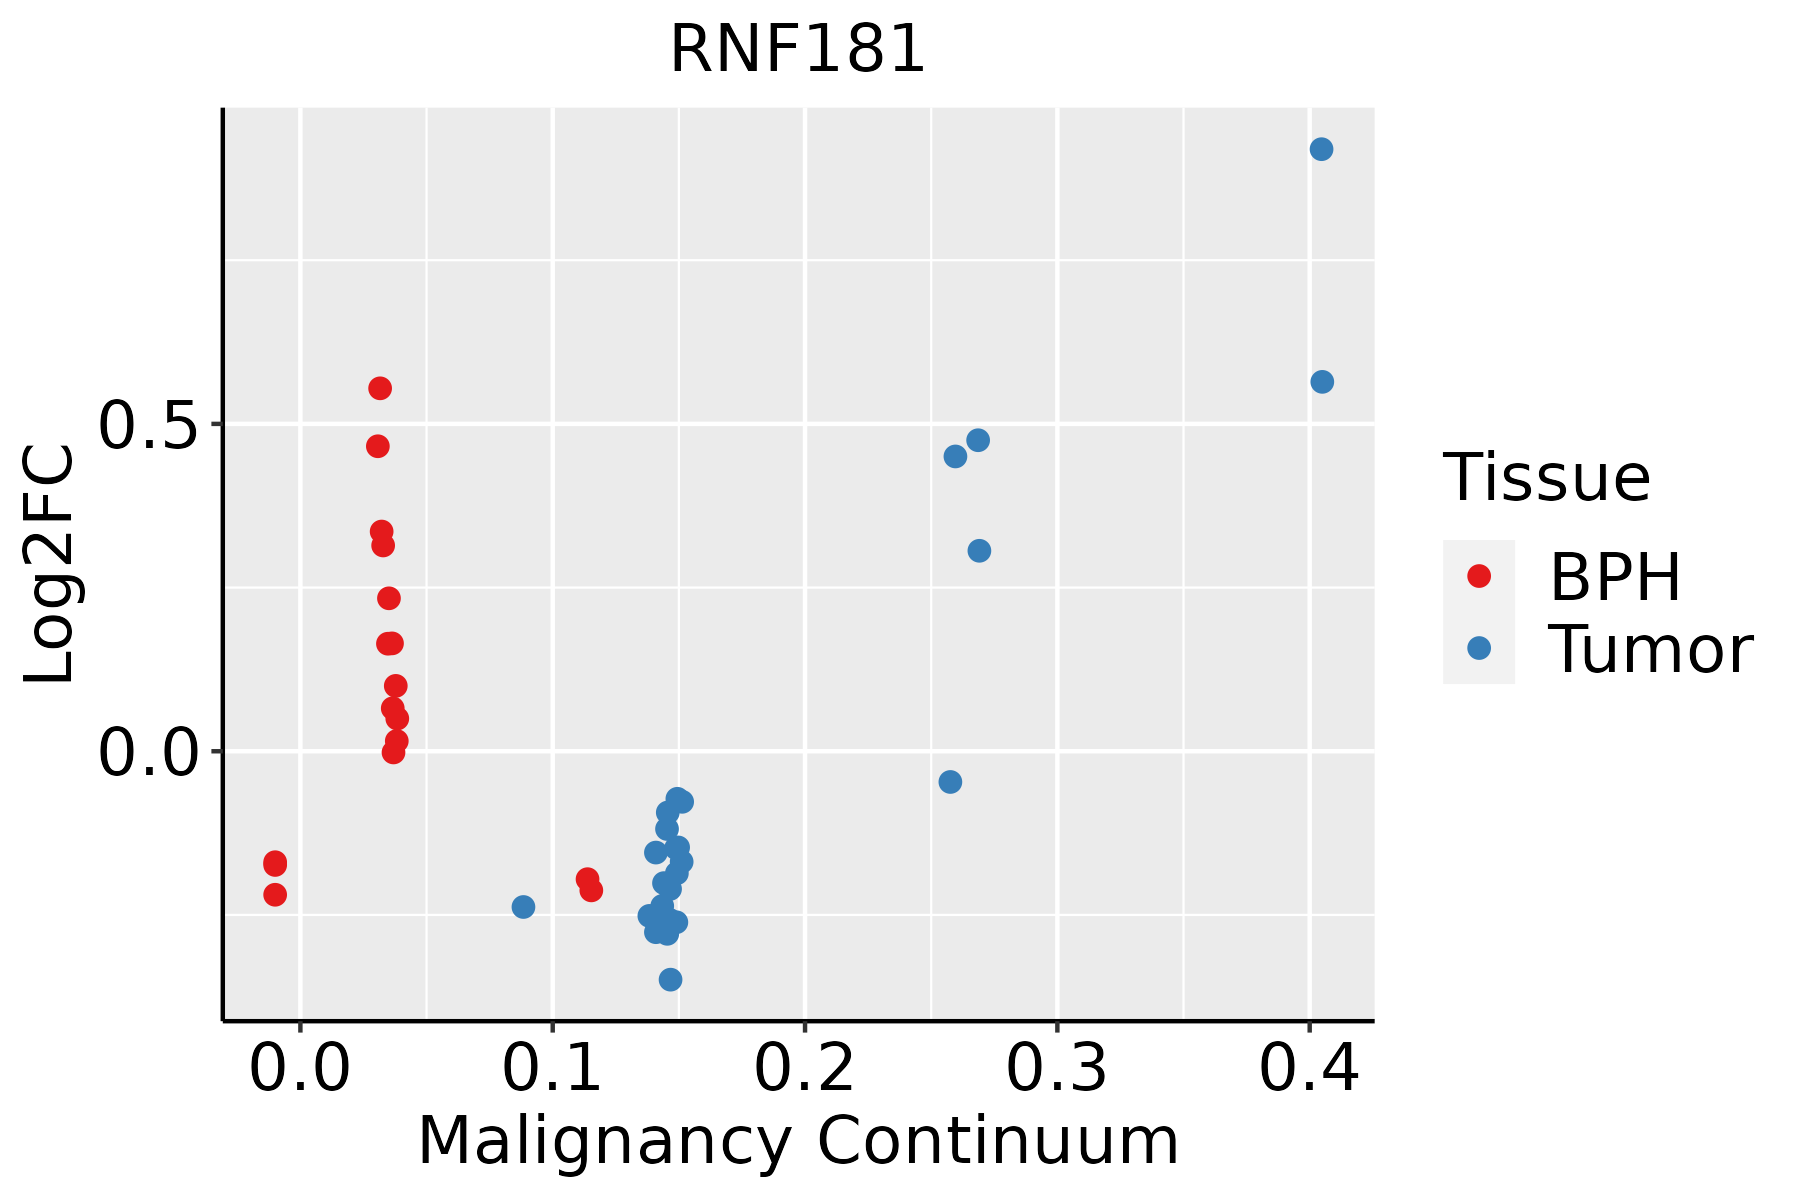 | BPH: Benign Prostatic Hyperplasia |
| Skin | 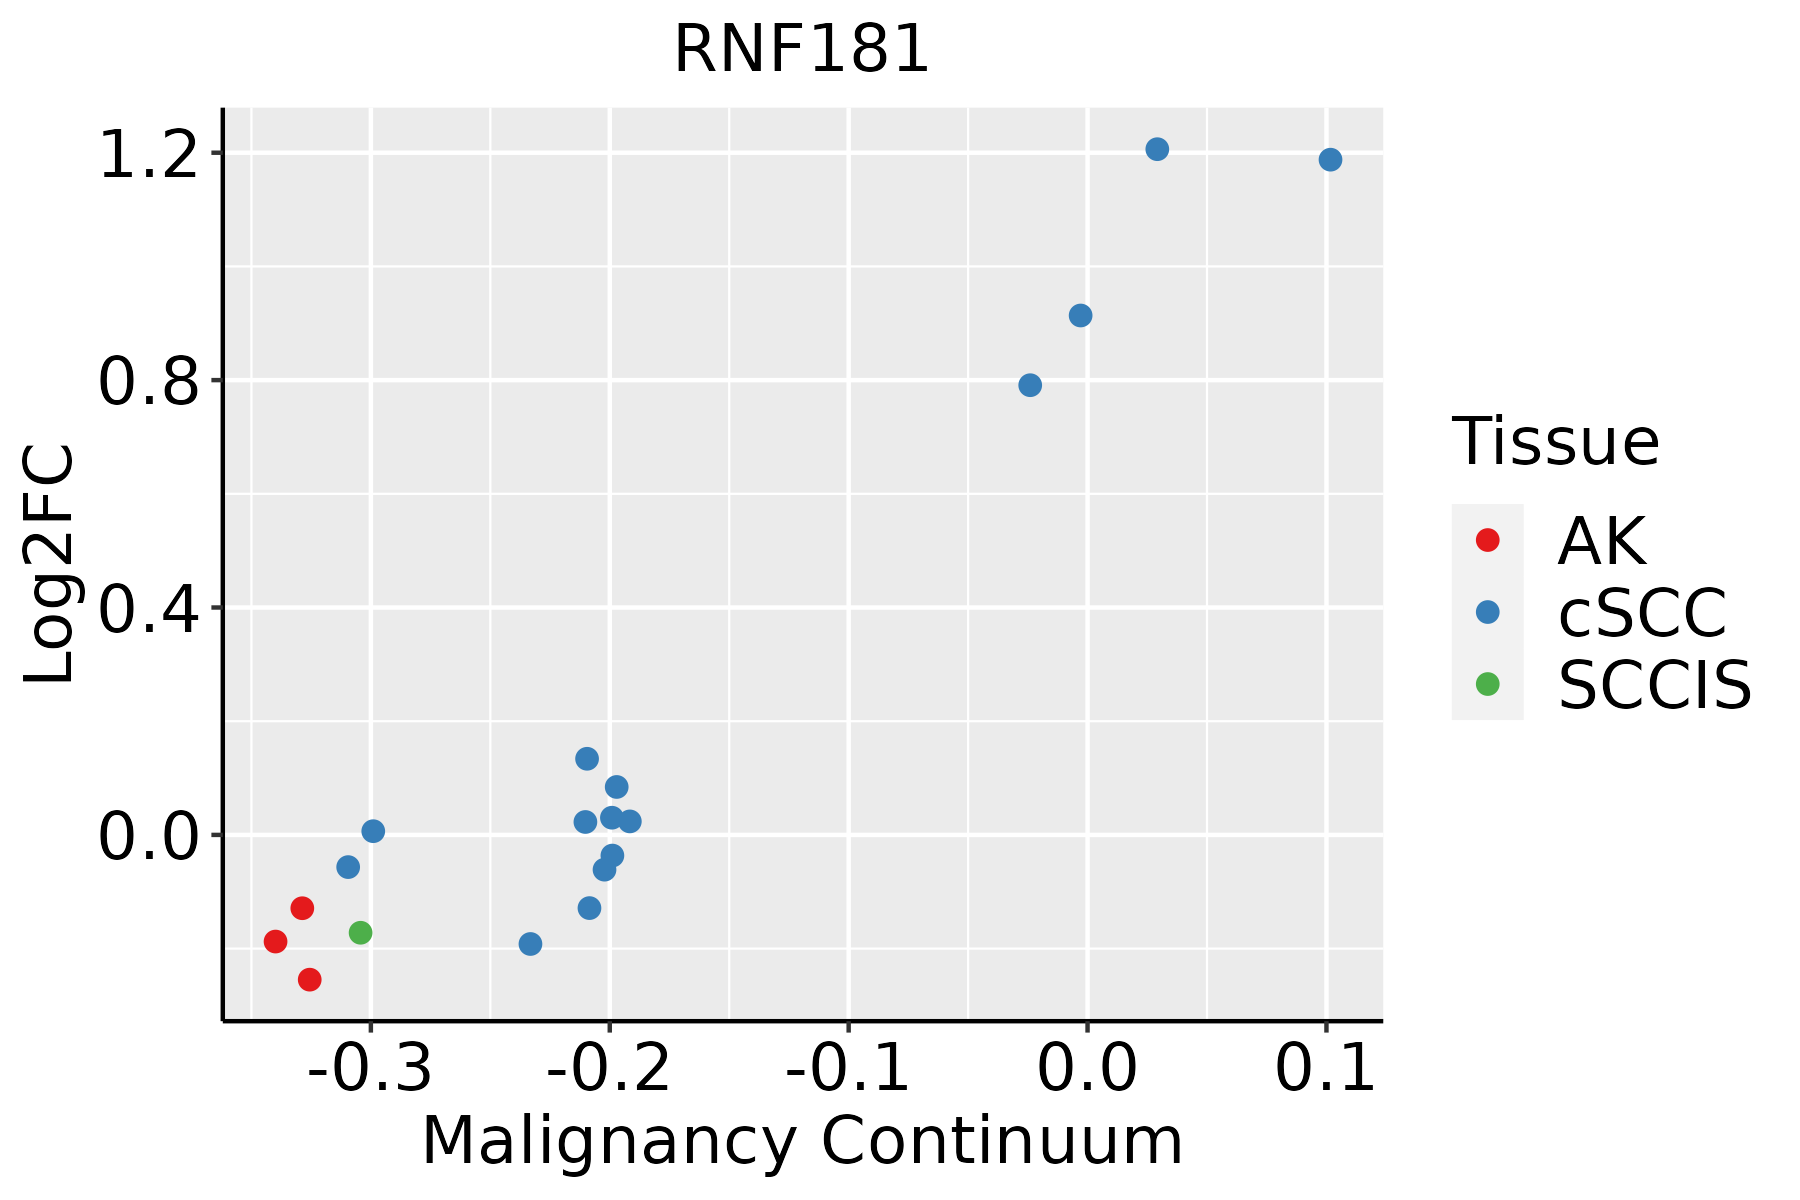 | AK: Actinic keratosis |
| cSCC: Cutaneous squamous cell carcinoma | ||
| SCCIS:squamous cell carcinoma in situ | ||
| Thyroid | 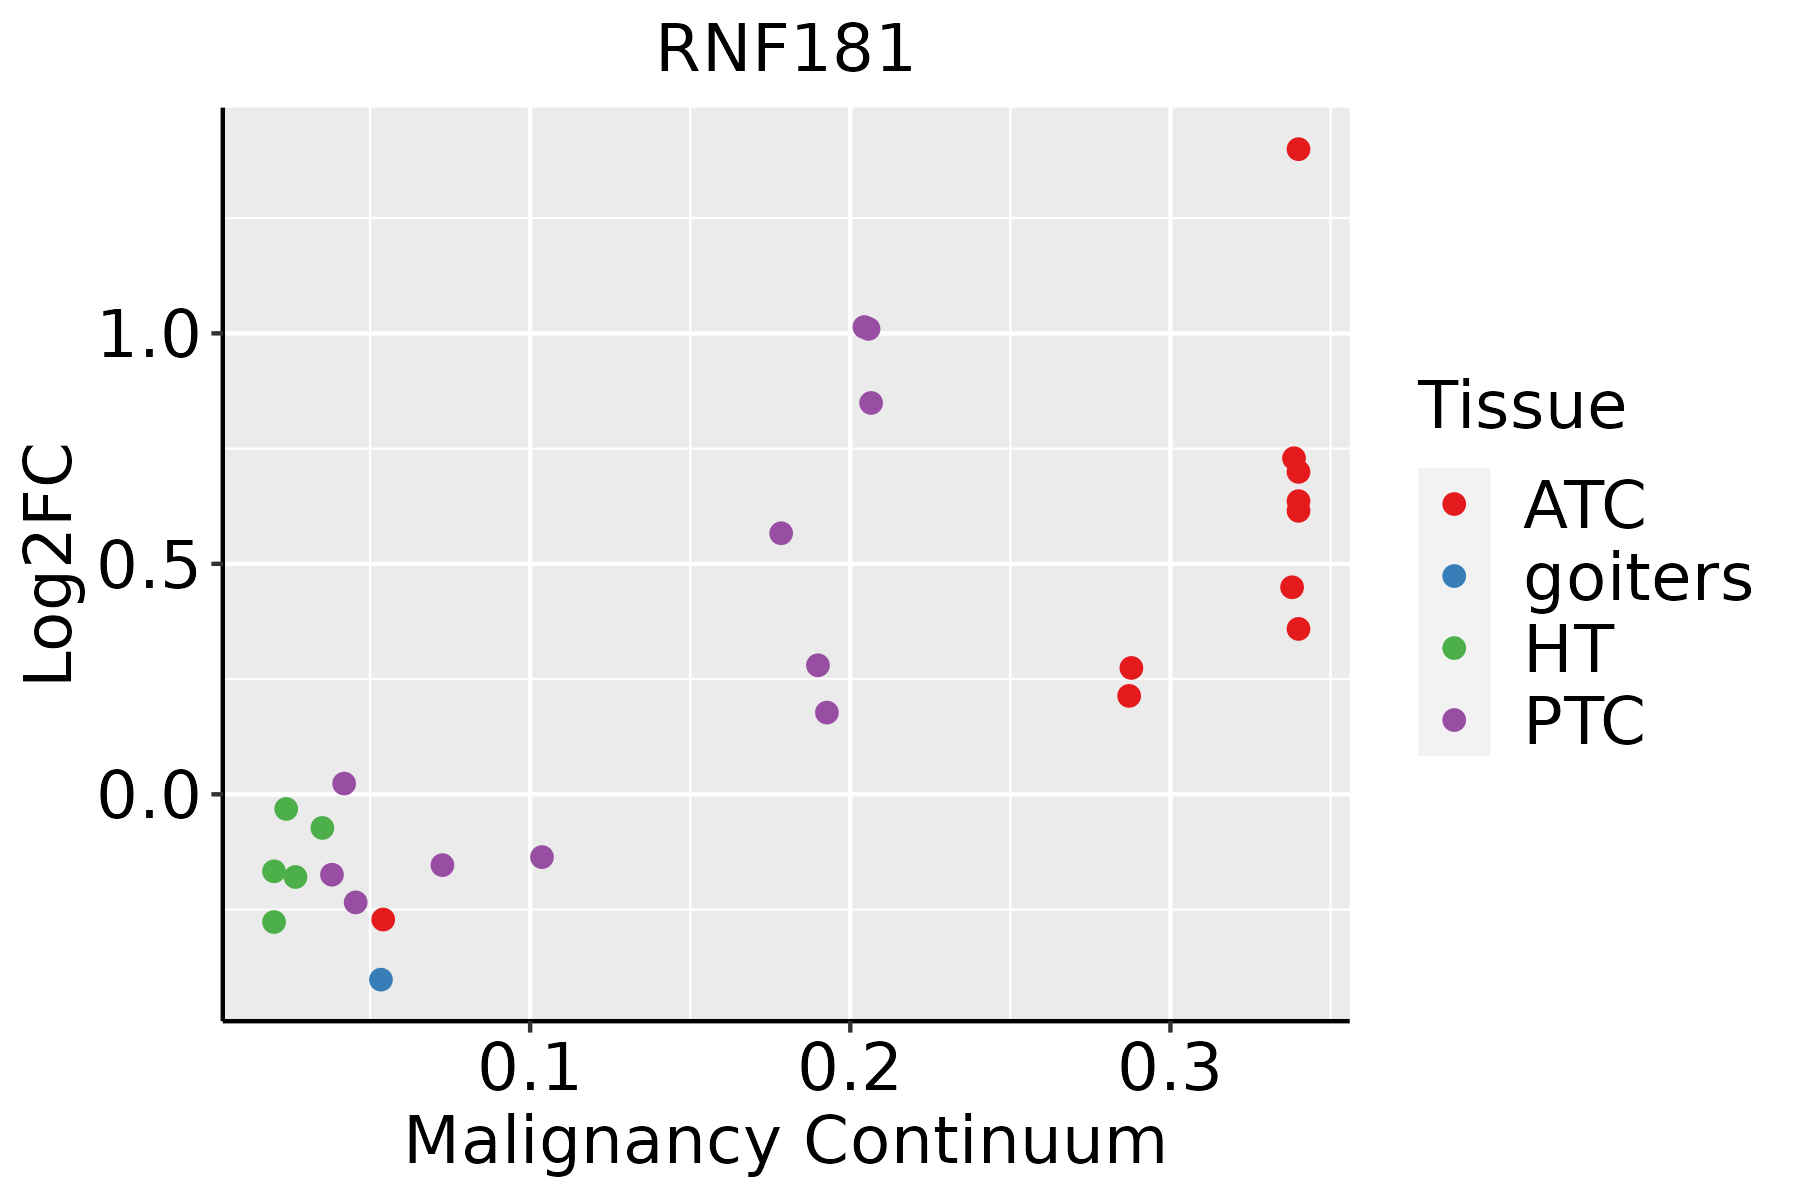 | ATC: Anaplastic thyroid cancer |
| HT: Hashimoto's thyroiditis | ||
| PTC: Papillary thyroid cancer |
| ∗log2FC in expression of this searched gene in stem-like cells from each diseased tissue sample relative to stem-like cells in normal samples in each tissue plotted against the malignancy continuum. Samples are colored based on if they are from different disease stage. |
Top |
Malignant transformation related pathway analysis |
| Find out the enriched GO biological processes and KEGG pathways involved in transition from healthy to precancer to cancer |
| Tissue | Disease Stage | Enriched GO biological Processes |
| Colorectum | AD |  |
| Colorectum | SER |  |
| Colorectum | MSS |  |
| Colorectum | MSI-H |  |
| Colorectum | FAP |  |
| ∗Top 15 enriched GO BP terms are showed in the bar plot of each disease state in each tissue. Each row represents a significant GO biological process which is colored according to the -log10(p.adjust). |
| Page: 1 2 3 4 5 6 7 8 9 |
| GO ID | Tissue | Disease Stage | Description | Gene Ratio | Bg Ratio | pvalue | p.adjust | Count |
| GO:00518656 | Cervix | CC | protein autoubiquitination | 17/2311 | 73/18723 | 6.71e-03 | 3.70e-02 | 17 |
| GO:0051865 | Colorectum | AD | protein autoubiquitination | 28/3918 | 73/18723 | 4.87e-04 | 5.30e-03 | 28 |
| GO:00518651 | Colorectum | MSS | protein autoubiquitination | 25/3467 | 73/18723 | 1.00e-03 | 1.00e-02 | 25 |
| GO:00518658 | Esophagus | ESCC | protein autoubiquitination | 47/8552 | 73/18723 | 9.72e-04 | 4.93e-03 | 47 |
| GO:00518654 | Liver | HCC | protein autoubiquitination | 42/7958 | 73/18723 | 6.78e-03 | 2.73e-02 | 42 |
| GO:00518657 | Oral cavity | OSCC | protein autoubiquitination | 40/7305 | 73/18723 | 4.45e-03 | 1.79e-02 | 40 |
| GO:005186512 | Oral cavity | LP | protein autoubiquitination | 29/4623 | 73/18723 | 3.20e-03 | 2.18e-02 | 29 |
| GO:00518659 | Thyroid | PTC | protein autoubiquitination | 40/5968 | 73/18723 | 4.17e-05 | 3.80e-04 | 40 |
| GO:005186513 | Thyroid | ATC | protein autoubiquitination | 41/6293 | 73/18723 | 6.14e-05 | 4.69e-04 | 41 |
| Page: 1 |
| Pathway ID | Tissue | Disease Stage | Description | Gene Ratio | Bg Ratio | pvalue | p.adjust | qvalue | Count |
| Page: 1 |
Top |
Cell-cell communication analysis |
| Identification of potential cell-cell interactions between two cell types and their ligand-receptor pairs for different disease states |
| Ligand | Receptor | LRpair | Pathway | Tissue | Disease Stage |
| Page: 1 |
Top |
Single-cell gene regulatory network inference analysis |
| Find out the significant the regulons (TFs) and the target genes of each regulon across cell types for different disease states |
| TF | Cell Type | Tissue | Disease Stage | Target Gene | RSS | Regulon Activity |
| ∗The dot plots of a searched regulon are shown for all cell subpopulations in each disease state of each tissue based on the regulon specific score inferred using pySCENIC and by calculating the average expression. |
| Page: 1 |
Top |
Somatic mutation of malignant transformation related genes |
| Annotation of somatic variants for genes involved in malignant transformation |
| Hugo Symbol | Variant Class | Variant Classification | dbSNP RS | HGVSc | HGVSp | HGVSp Short | SWISSPROT | BIOTYPE | SIFT | PolyPhen | Tumor Sample Barcode | Tissue | Histology | Sex | Age | Stage | Therapy Types | Drugs | Outcome |
| RNF181 | SNV | Missense_Mutation | rs148260133 | c.373N>A | p.Asp125Asn | p.D125N | Q9P0P0 | protein_coding | deleterious(0.05) | benign(0.111) | TCGA-AA-3492-01 | Colorectum | colon adenocarcinoma | Female | >=65 | I/II | Unknown | Unknown | SD |
| RNF181 | SNV | Missense_Mutation | rs775345617 | c.458C>T | p.Thr153Met | p.T153M | Q9P0P0 | protein_coding | deleterious(0) | possibly_damaging(0.635) | TCGA-CK-5916-01 | Colorectum | colon adenocarcinoma | Female | >=65 | I/II | Unknown | Unknown | PD |
| RNF181 | SNV | Missense_Mutation | novel | c.261N>T | p.Glu87Asp | p.E87D | Q9P0P0 | protein_coding | tolerated(0.21) | possibly_damaging(0.766) | TCGA-A5-A0G2-01 | Endometrium | uterine corpus endometrioid carcinoma | Female | <65 | III/IV | Unknown | Unknown | SD |
| RNF181 | SNV | Missense_Mutation | c.139G>A | p.Asp47Asn | p.D47N | Q9P0P0 | protein_coding | tolerated(0.11) | benign(0.164) | TCGA-AP-A059-01 | Endometrium | uterine corpus endometrioid carcinoma | Female | >=65 | I/II | Unknown | Unknown | SD | |
| RNF181 | SNV | Missense_Mutation | rs370554005 | c.395G>A | p.Arg132Gln | p.R132Q | Q9P0P0 | protein_coding | deleterious(0.04) | benign(0.001) | TCGA-AX-A2HC-01 | Endometrium | uterine corpus endometrioid carcinoma | Female | <65 | III/IV | Chemotherapy | paclitaxel | PD |
| RNF181 | SNV | Missense_Mutation | rs370554005 | c.395G>A | p.Arg132Gln | p.R132Q | Q9P0P0 | protein_coding | deleterious(0.04) | benign(0.001) | TCGA-AX-A2HD-01 | Endometrium | uterine corpus endometrioid carcinoma | Female | >=65 | III/IV | Unknown | Unknown | SD |
| RNF181 | insertion | Frame_Shift_Ins | novel | c.329_330insA | p.Asn111LysfsTer9 | p.N111Kfs*9 | Q9P0P0 | protein_coding | TCGA-BS-A0UJ-01 | Endometrium | uterine corpus endometrioid carcinoma | Female | >=65 | I/II | Unknown | Unknown | SD | ||
| RNF181 | SNV | Missense_Mutation | c.245N>T | p.Glu82Val | p.E82V | Q9P0P0 | protein_coding | deleterious(0) | probably_damaging(0.993) | TCGA-43-2578-01 | Lung | lung squamous cell carcinoma | Female | <65 | I/II | Unknown | Unknown | SD | |
| RNF181 | SNV | Missense_Mutation | c.22N>A | p.His8Asn | p.H8N | Q9P0P0 | protein_coding | deleterious(0.05) | possibly_damaging(0.572) | TCGA-85-8287-01 | Lung | lung squamous cell carcinoma | Male | >=65 | I/II | Unknown | Unknown | SD | |
| RNF181 | deletion | Frame_Shift_Del | novel | c.118_119delTT | p.Leu40GlyfsTer20 | p.L40Gfs*20 | Q9P0P0 | protein_coding | TCGA-21-5787-01 | Lung | lung squamous cell carcinoma | Male | >=65 | III/IV | Unknown | Unknown | PD |
| Page: 1 2 |
Top |
Related drugs of malignant transformation related genes |
| Identification of chemicals and drugs interact with genes involved in malignant transfromation |
| (DGIdb 4.0) |
| Entrez ID | Symbol | Category | Interaction Types | Drug Claim Name | Drug Name | PMIDs |
| Page: 1 |

Copyright 2023-Present -The University of Texas Health Science Center at Houston |