
|
|||||
|
 | |
| |
| |
| |
| |
| |
|
Gene: RNF170 |
Gene summary for RNF170 |
| Gene information | Species | Human | Gene symbol | RNF170 | Gene ID | 81790 |
| Gene name | ring finger protein 170 | |
| Gene Alias | ADSA | |
| Cytomap | 8p11.21 | |
| Gene Type | protein-coding | GO ID | GO:0006464 | UniProtAcc | Q96K19 |
Top |
Malignant transformation analysis |
| Identification of the aberrant gene expression in precancerous and cancerous lesions by comparing the gene expression of stem-like cells in diseased tissues with normal stem cells |
| Entrez ID | Symbol | Replicates | Species | Organ | Tissue | Adj P-value | Log2FC | Malignancy |
| 81790 | RNF170 | LZE2T | Human | Esophagus | ESCC | 1.89e-03 | 5.32e-01 | 0.082 |
| 81790 | RNF170 | LZE4T | Human | Esophagus | ESCC | 2.04e-05 | 2.12e-01 | 0.0811 |
| 81790 | RNF170 | LZE8T | Human | Esophagus | ESCC | 4.18e-05 | 1.71e-01 | 0.067 |
| 81790 | RNF170 | LZE20T | Human | Esophagus | ESCC | 7.29e-11 | 4.43e-01 | 0.0662 |
| 81790 | RNF170 | LZE24T | Human | Esophagus | ESCC | 3.31e-17 | 4.03e-01 | 0.0596 |
| 81790 | RNF170 | P1T-E | Human | Esophagus | ESCC | 3.74e-03 | 1.93e-01 | 0.0875 |
| 81790 | RNF170 | P2T-E | Human | Esophagus | ESCC | 2.69e-17 | 2.66e-01 | 0.1177 |
| 81790 | RNF170 | P4T-E | Human | Esophagus | ESCC | 1.49e-15 | 3.57e-01 | 0.1323 |
| 81790 | RNF170 | P5T-E | Human | Esophagus | ESCC | 6.27e-07 | 1.46e-01 | 0.1327 |
| 81790 | RNF170 | P8T-E | Human | Esophagus | ESCC | 8.11e-12 | 2.07e-01 | 0.0889 |
| 81790 | RNF170 | P9T-E | Human | Esophagus | ESCC | 2.87e-08 | 1.72e-01 | 0.1131 |
| 81790 | RNF170 | P10T-E | Human | Esophagus | ESCC | 6.54e-13 | 2.87e-01 | 0.116 |
| 81790 | RNF170 | P11T-E | Human | Esophagus | ESCC | 1.61e-05 | 2.07e-01 | 0.1426 |
| 81790 | RNF170 | P12T-E | Human | Esophagus | ESCC | 1.01e-17 | 3.87e-01 | 0.1122 |
| 81790 | RNF170 | P15T-E | Human | Esophagus | ESCC | 1.10e-18 | 4.37e-01 | 0.1149 |
| 81790 | RNF170 | P16T-E | Human | Esophagus | ESCC | 4.73e-20 | 4.48e-01 | 0.1153 |
| 81790 | RNF170 | P19T-E | Human | Esophagus | ESCC | 3.23e-02 | 2.53e-01 | 0.1662 |
| 81790 | RNF170 | P20T-E | Human | Esophagus | ESCC | 1.98e-08 | 2.44e-01 | 0.1124 |
| 81790 | RNF170 | P21T-E | Human | Esophagus | ESCC | 1.89e-06 | 1.56e-01 | 0.1617 |
| 81790 | RNF170 | P22T-E | Human | Esophagus | ESCC | 8.23e-12 | 2.31e-01 | 0.1236 |
| Page: 1 2 3 4 5 |
| Tissue | Expression Dynamics | Abbreviation |
| Esophagus | 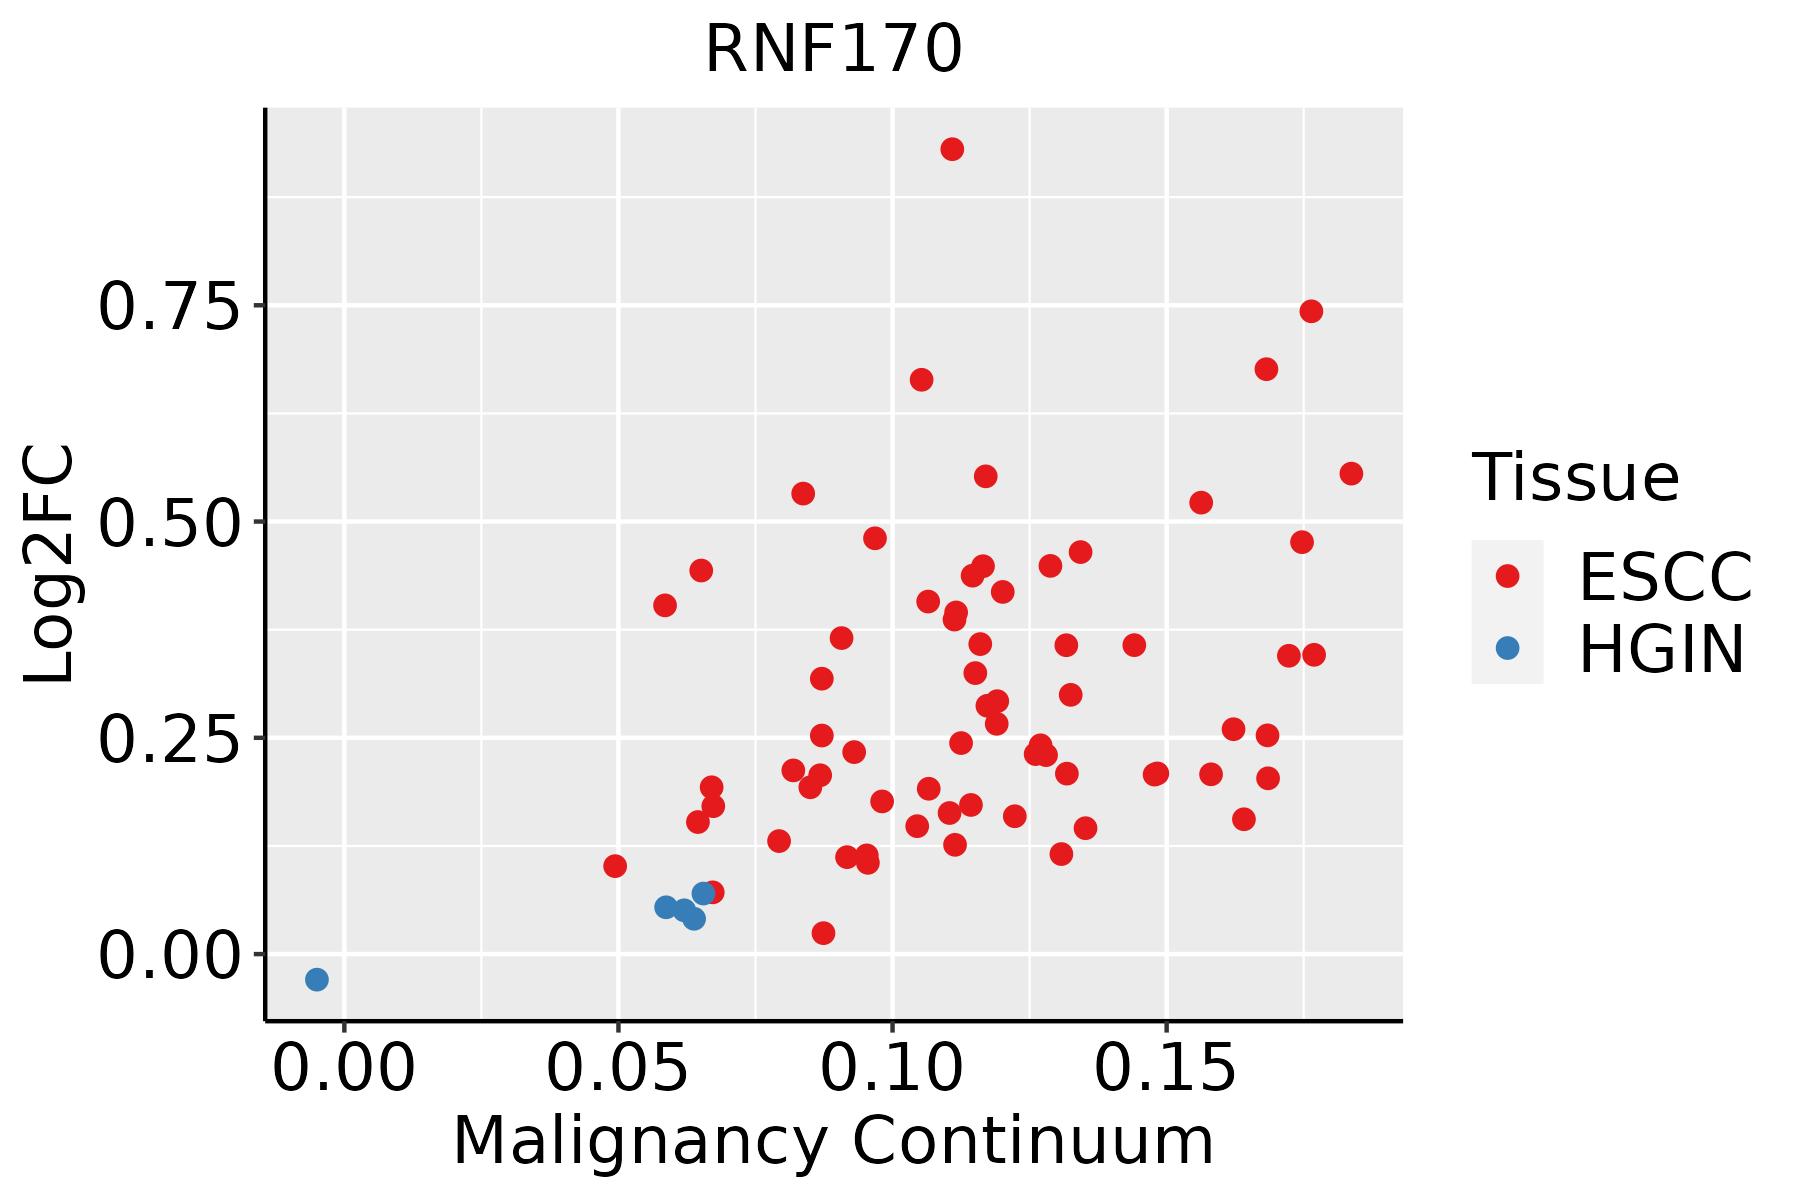 | ESCC: Esophageal squamous cell carcinoma |
| HGIN: High-grade intraepithelial neoplasias | ||
| LGIN: Low-grade intraepithelial neoplasias | ||
| Liver | 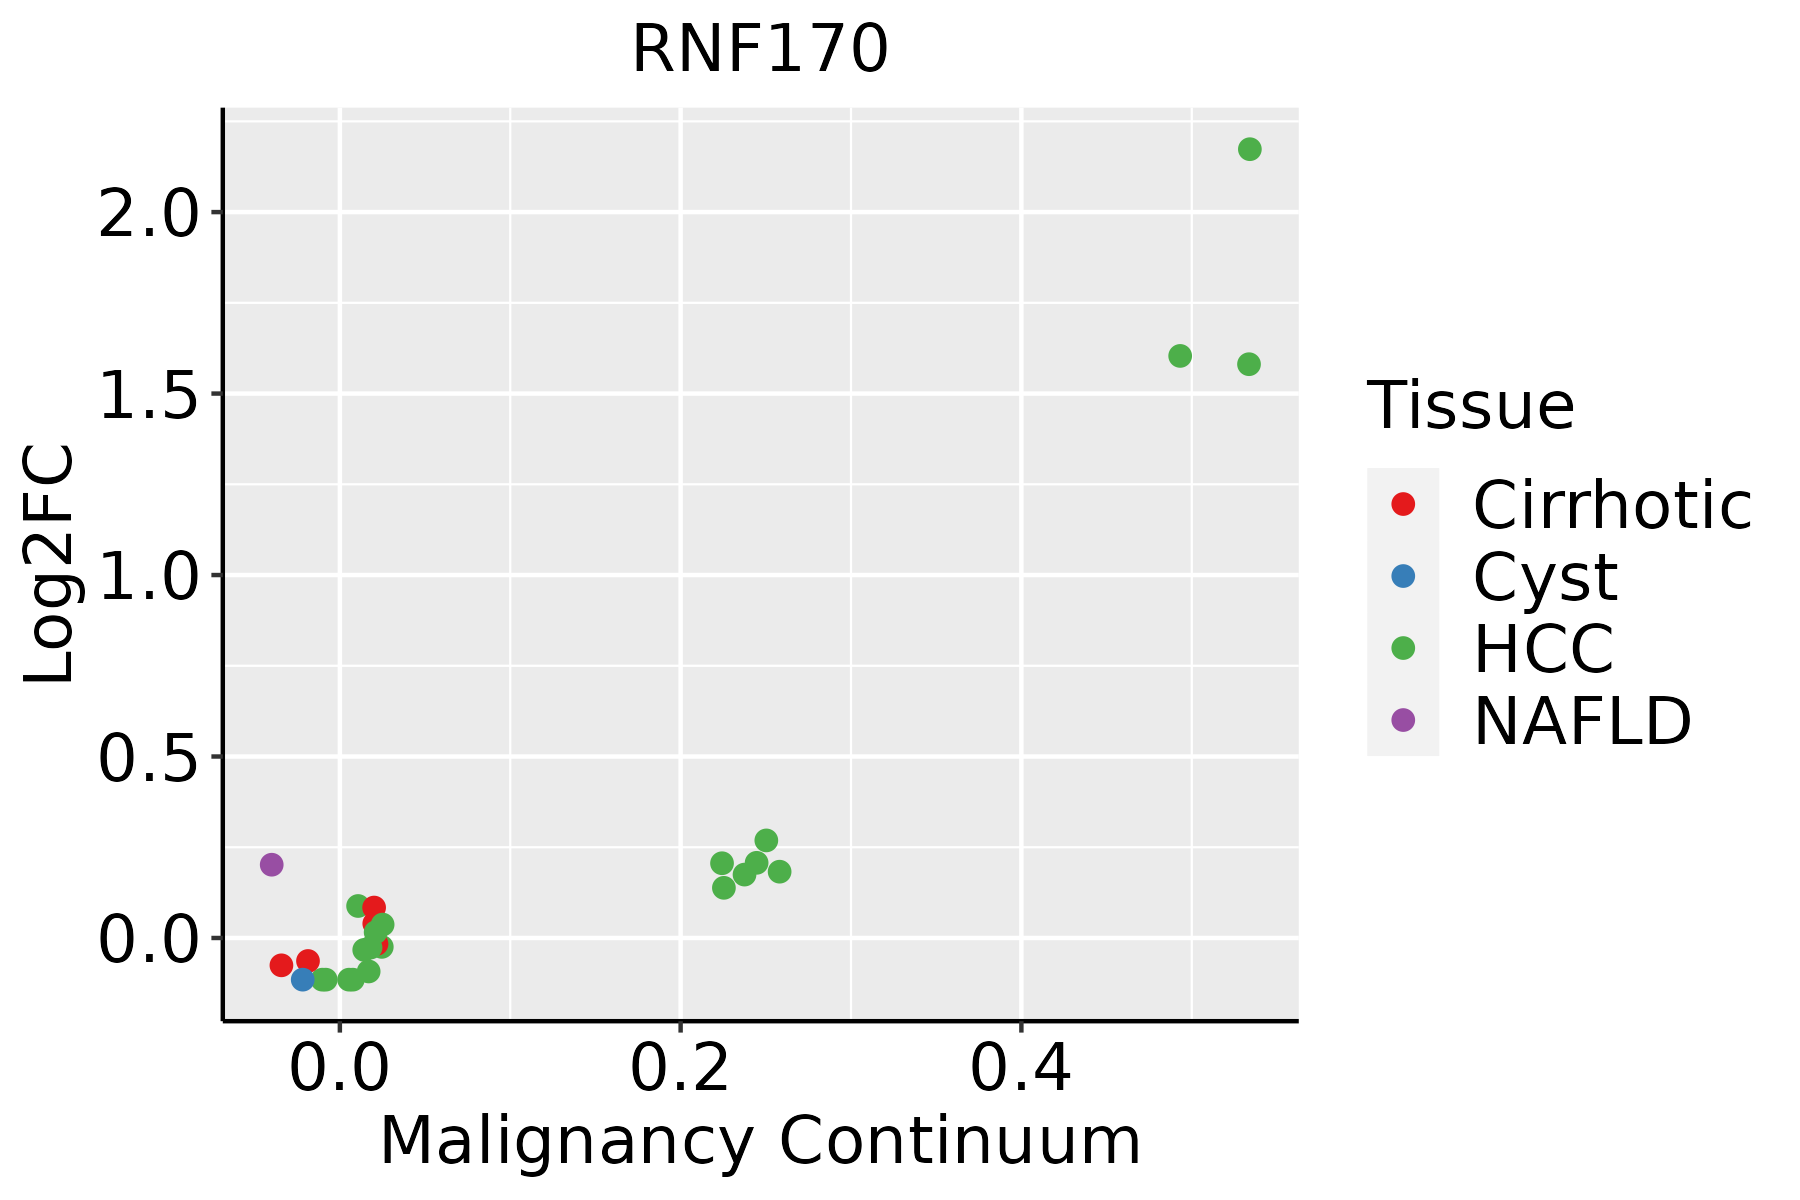 | HCC: Hepatocellular carcinoma |
| NAFLD: Non-alcoholic fatty liver disease | ||
| Oral Cavity | 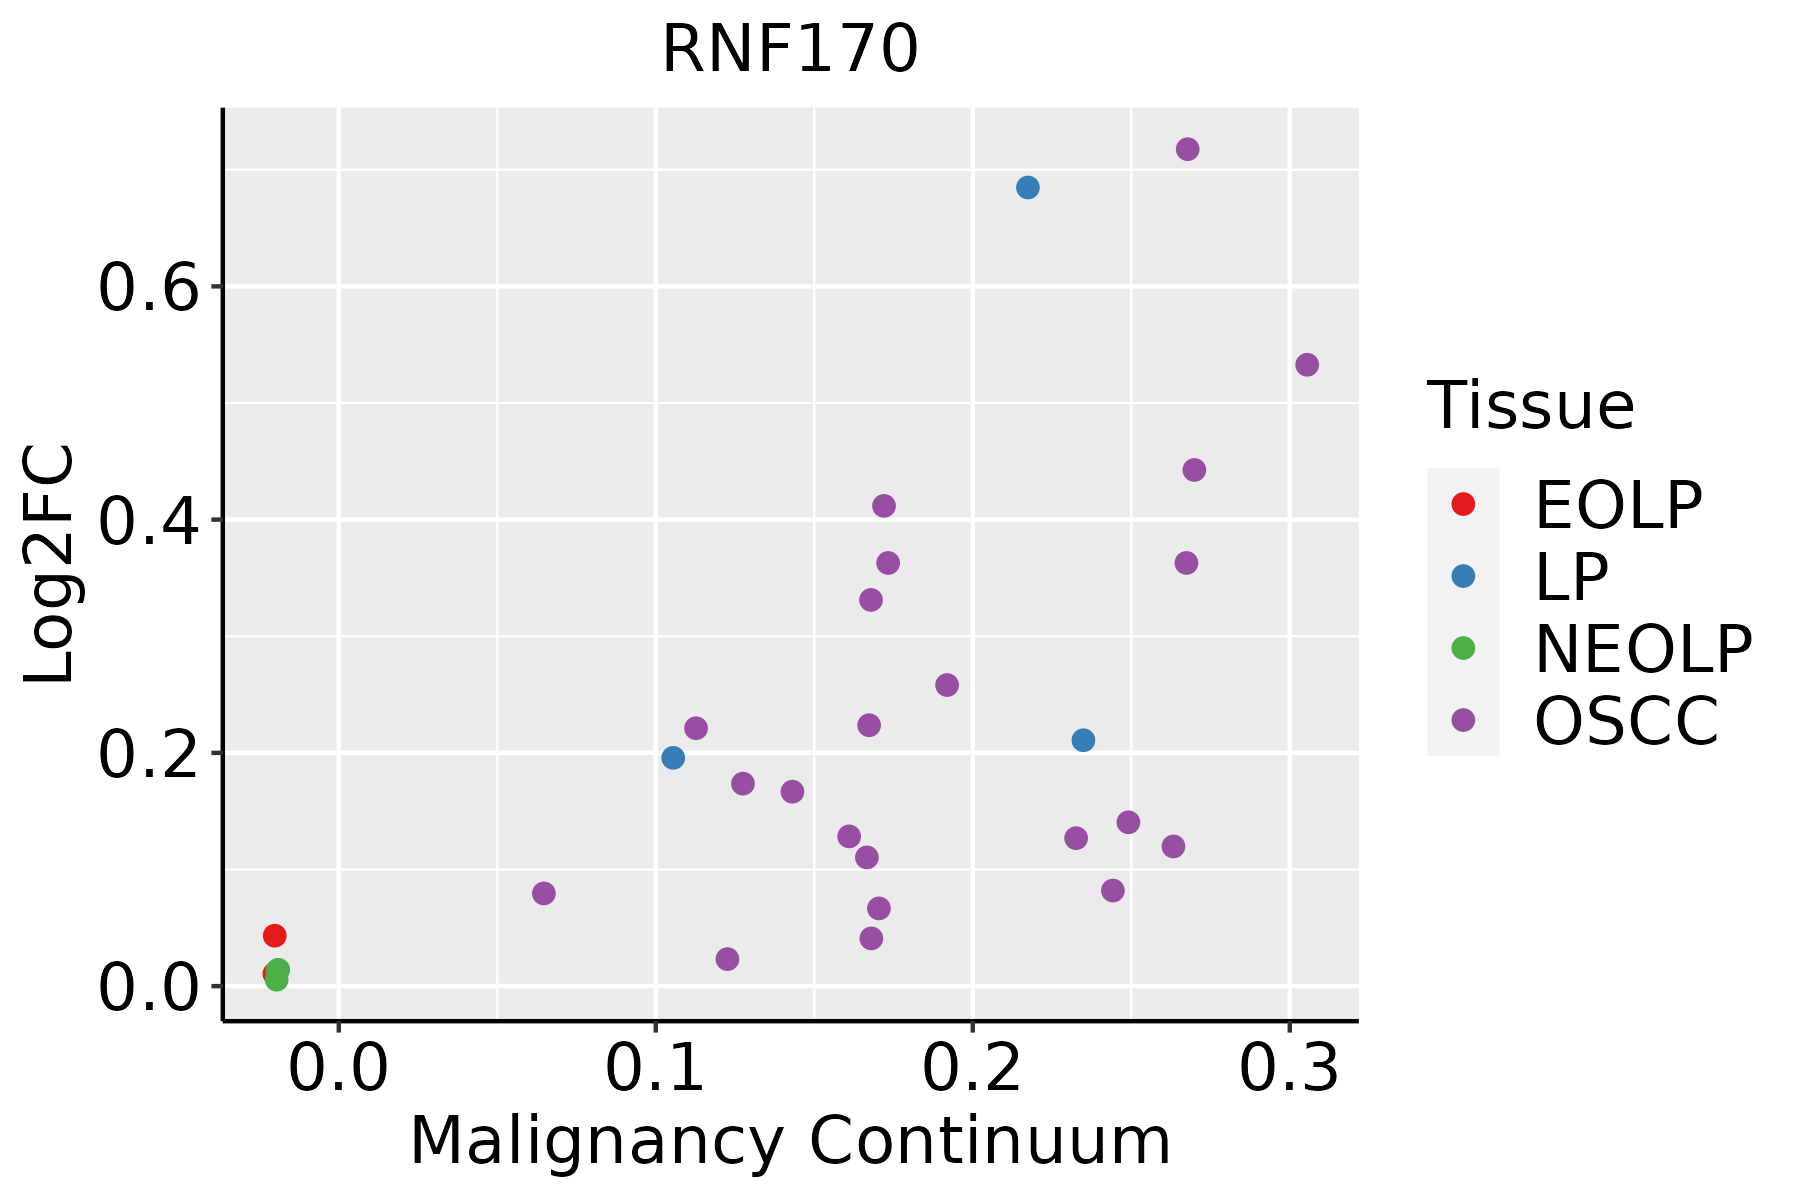 | EOLP: Erosive Oral lichen planus |
| LP: leukoplakia | ||
| NEOLP: Non-erosive oral lichen planus | ||
| OSCC: Oral squamous cell carcinoma | ||
| Thyroid | 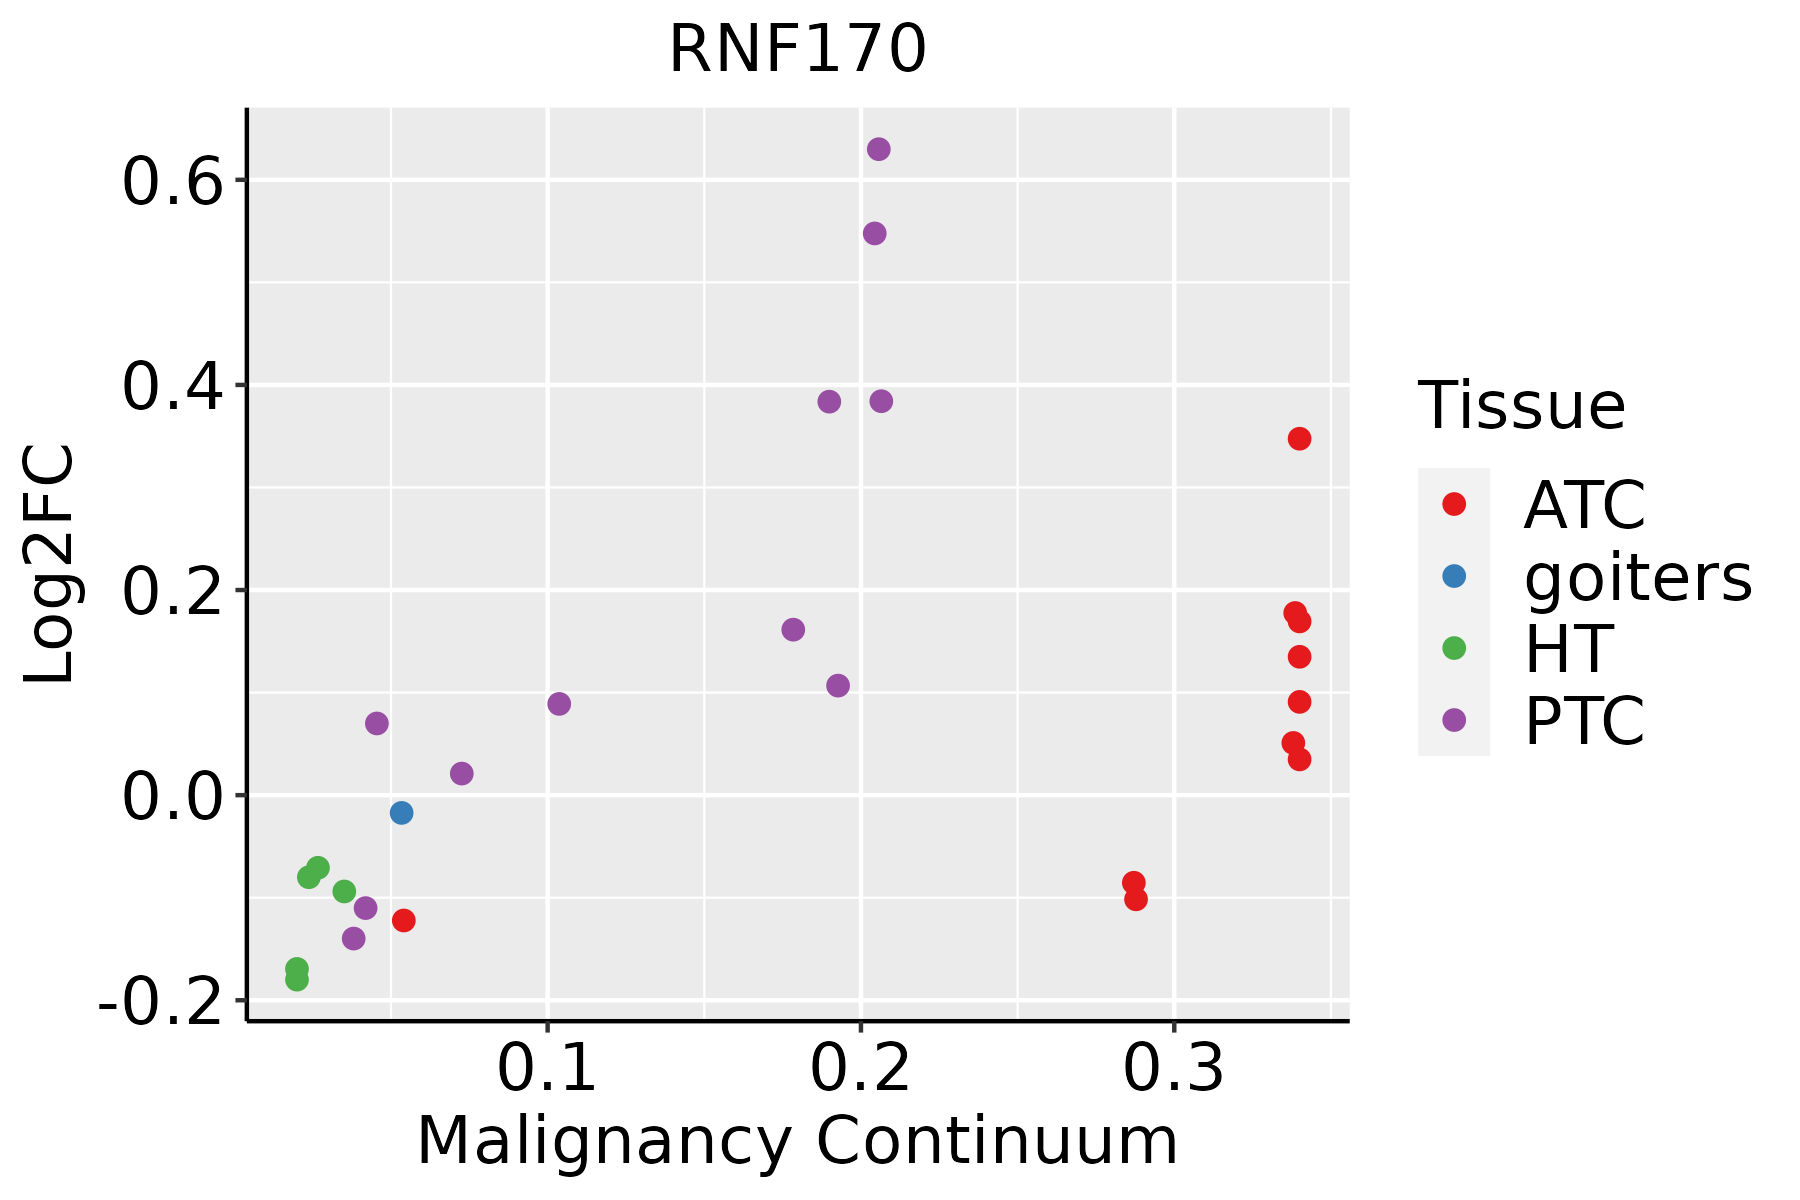 | ATC: Anaplastic thyroid cancer |
| HT: Hashimoto's thyroiditis | ||
| PTC: Papillary thyroid cancer |
| ∗log2FC in expression of this searched gene in stem-like cells from each diseased tissue sample relative to stem-like cells in normal samples in each tissue plotted against the malignancy continuum. Samples are colored based on if they are from different disease stage. |
Top |
Malignant transformation related pathway analysis |
| Find out the enriched GO biological processes and KEGG pathways involved in transition from healthy to precancer to cancer |
| Tissue | Disease Stage | Enriched GO biological Processes |
| Colorectum | AD |  |
| Colorectum | SER |  |
| Colorectum | MSS |  |
| Colorectum | MSI-H |  |
| Colorectum | FAP |  |
| ∗Top 15 enriched GO BP terms are showed in the bar plot of each disease state in each tissue. Each row represents a significant GO biological process which is colored according to the -log10(p.adjust). |
| Page: 1 2 3 4 5 6 7 8 9 |
| GO ID | Tissue | Disease Stage | Description | Gene Ratio | Bg Ratio | pvalue | p.adjust | Count |
| Page: 1 |
| Pathway ID | Tissue | Disease Stage | Description | Gene Ratio | Bg Ratio | pvalue | p.adjust | qvalue | Count |
| Page: 1 |
Top |
Cell-cell communication analysis |
| Identification of potential cell-cell interactions between two cell types and their ligand-receptor pairs for different disease states |
| Ligand | Receptor | LRpair | Pathway | Tissue | Disease Stage |
| Page: 1 |
Top |
Single-cell gene regulatory network inference analysis |
| Find out the significant the regulons (TFs) and the target genes of each regulon across cell types for different disease states |
| TF | Cell Type | Tissue | Disease Stage | Target Gene | RSS | Regulon Activity |
| ∗The dot plots of a searched regulon are shown for all cell subpopulations in each disease state of each tissue based on the regulon specific score inferred using pySCENIC and by calculating the average expression. |
| Page: 1 |
Top |
Somatic mutation of malignant transformation related genes |
| Annotation of somatic variants for genes involved in malignant transformation |
| Hugo Symbol | Variant Class | Variant Classification | dbSNP RS | HGVSc | HGVSp | HGVSp Short | SWISSPROT | BIOTYPE | SIFT | PolyPhen | Tumor Sample Barcode | Tissue | Histology | Sex | Age | Stage | Therapy Types | Drugs | Outcome |
| RNF170 | SNV | Missense_Mutation | novel | c.148N>G | p.Gln50Glu | p.Q50E | Q96K19 | protein_coding | tolerated(0.19) | benign(0.15) | TCGA-HN-A2OB-01 | Breast | breast invasive carcinoma | Female | <65 | I/II | Chemotherapy | fluorouracil | PD |
| RNF170 | SNV | Missense_Mutation | novel | c.64N>A | p.Val22Ile | p.V22I | Q96K19 | protein_coding | tolerated(1) | benign(0) | TCGA-VS-A957-01 | Cervix | cervical & endocervical cancer | Female | <65 | I/II | Chemotherapy | cisplatin | CR |
| RNF170 | SNV | Missense_Mutation | c.472G>T | p.Asp158Tyr | p.D158Y | Q96K19 | protein_coding | deleterious(0.01) | possibly_damaging(0.73) | TCGA-A6-2681-01 | Colorectum | colon adenocarcinoma | Female | >=65 | I/II | Unknown | Unknown | PD | |
| RNF170 | SNV | Missense_Mutation | novel | c.362T>G | p.Leu121Arg | p.L121R | Q96K19 | protein_coding | tolerated(0.14) | possibly_damaging(0.872) | TCGA-A5-A0G2-01 | Endometrium | uterine corpus endometrioid carcinoma | Female | <65 | III/IV | Unknown | Unknown | SD |
| RNF170 | SNV | Missense_Mutation | novel | c.4N>A | p.Ala2Thr | p.A2T | Q96K19 | protein_coding | deleterious_low_confidence(0.03) | benign(0.153) | TCGA-AJ-A3EK-01 | Endometrium | uterine corpus endometrioid carcinoma | Female | <65 | I/II | Chemotherapy | carboplatin | CR |
| RNF170 | SNV | Missense_Mutation | rs758564902 | c.596N>A | p.Arg199His | p.R199H | Q96K19 | protein_coding | deleterious(0) | probably_damaging(0.975) | TCGA-AP-A059-01 | Endometrium | uterine corpus endometrioid carcinoma | Female | >=65 | I/II | Unknown | Unknown | SD |
| RNF170 | SNV | Missense_Mutation | novel | c.626N>A | p.Ala209Asp | p.A209D | Q96K19 | protein_coding | deleterious(0) | probably_damaging(0.987) | TCGA-AX-A1CE-01 | Endometrium | uterine corpus endometrioid carcinoma | Female | <65 | I/II | Unspecific | Paclitaxel | SD |
| RNF170 | SNV | Missense_Mutation | novel | c.521T>C | p.Ile174Thr | p.I174T | Q96K19 | protein_coding | deleterious(0.03) | benign(0.135) | TCGA-B5-A1MR-01 | Endometrium | uterine corpus endometrioid carcinoma | Female | >=65 | III/IV | Unknown | Unknown | SD |
| RNF170 | SNV | Missense_Mutation | novel | c.313N>A | p.Leu105Ile | p.L105I | Q96K19 | protein_coding | tolerated(0.08) | benign(0.336) | TCGA-BK-A6W3-01 | Endometrium | uterine corpus endometrioid carcinoma | Female | <65 | I/II | Unknown | Unknown | SD |
| RNF170 | SNV | Missense_Mutation | novel | c.253N>G | p.Met85Val | p.M85V | Q96K19 | protein_coding | tolerated(0.38) | benign(0.022) | TCGA-EY-A1H0-01 | Endometrium | uterine corpus endometrioid carcinoma | Female | <65 | III/IV | Chemotherapy | taxol | SD |
| Page: 1 2 |
Top |
Related drugs of malignant transformation related genes |
| Identification of chemicals and drugs interact with genes involved in malignant transfromation |
| (DGIdb 4.0) |
| Entrez ID | Symbol | Category | Interaction Types | Drug Claim Name | Drug Name | PMIDs |
| Page: 1 |

Copyright 2023-Present -The University of Texas Health Science Center at Houston |