| Tissue | Expression Dynamics | Abbreviation |
| Cervix | 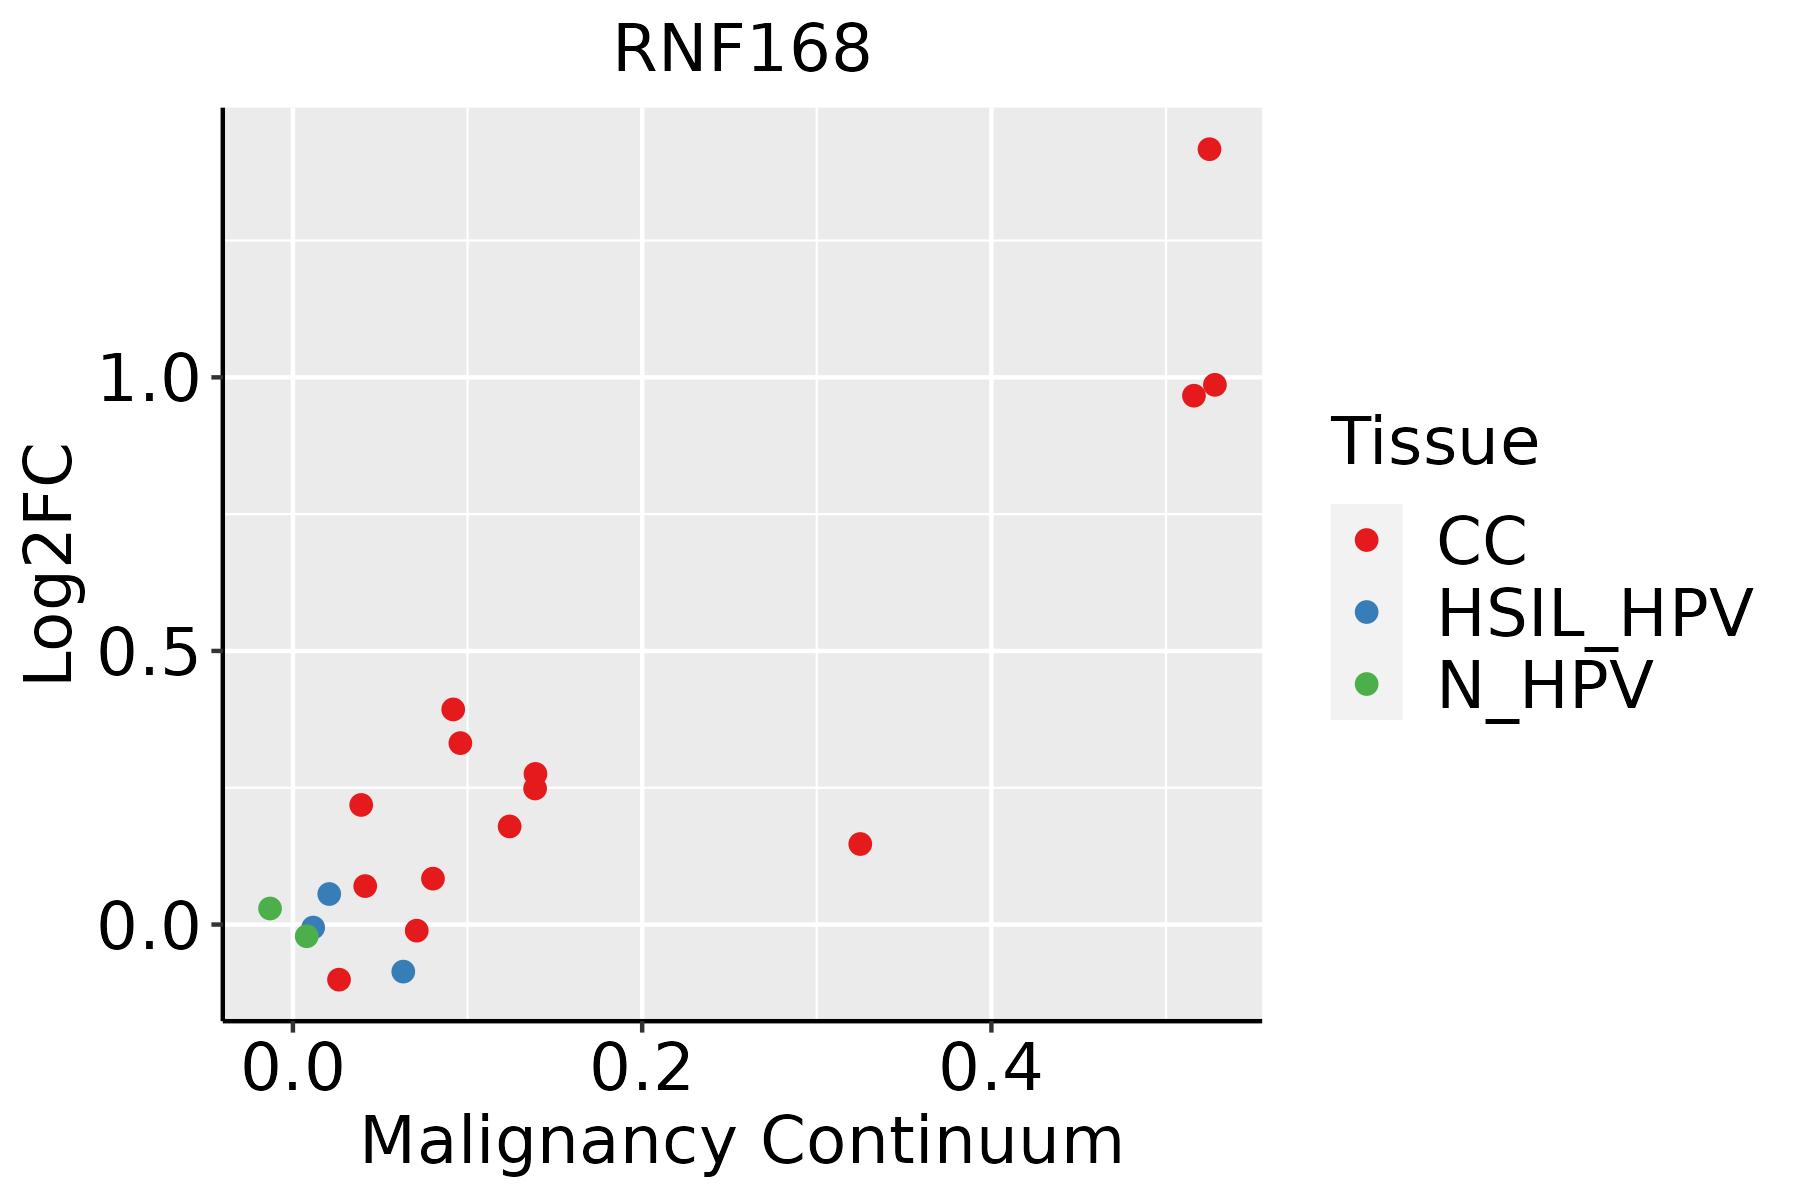 | CC: Cervix cancer |
| HSIL_HPV: HPV-infected high-grade squamous intraepithelial lesions |
| N_HPV: HPV-infected normal cervix |
| Esophagus | 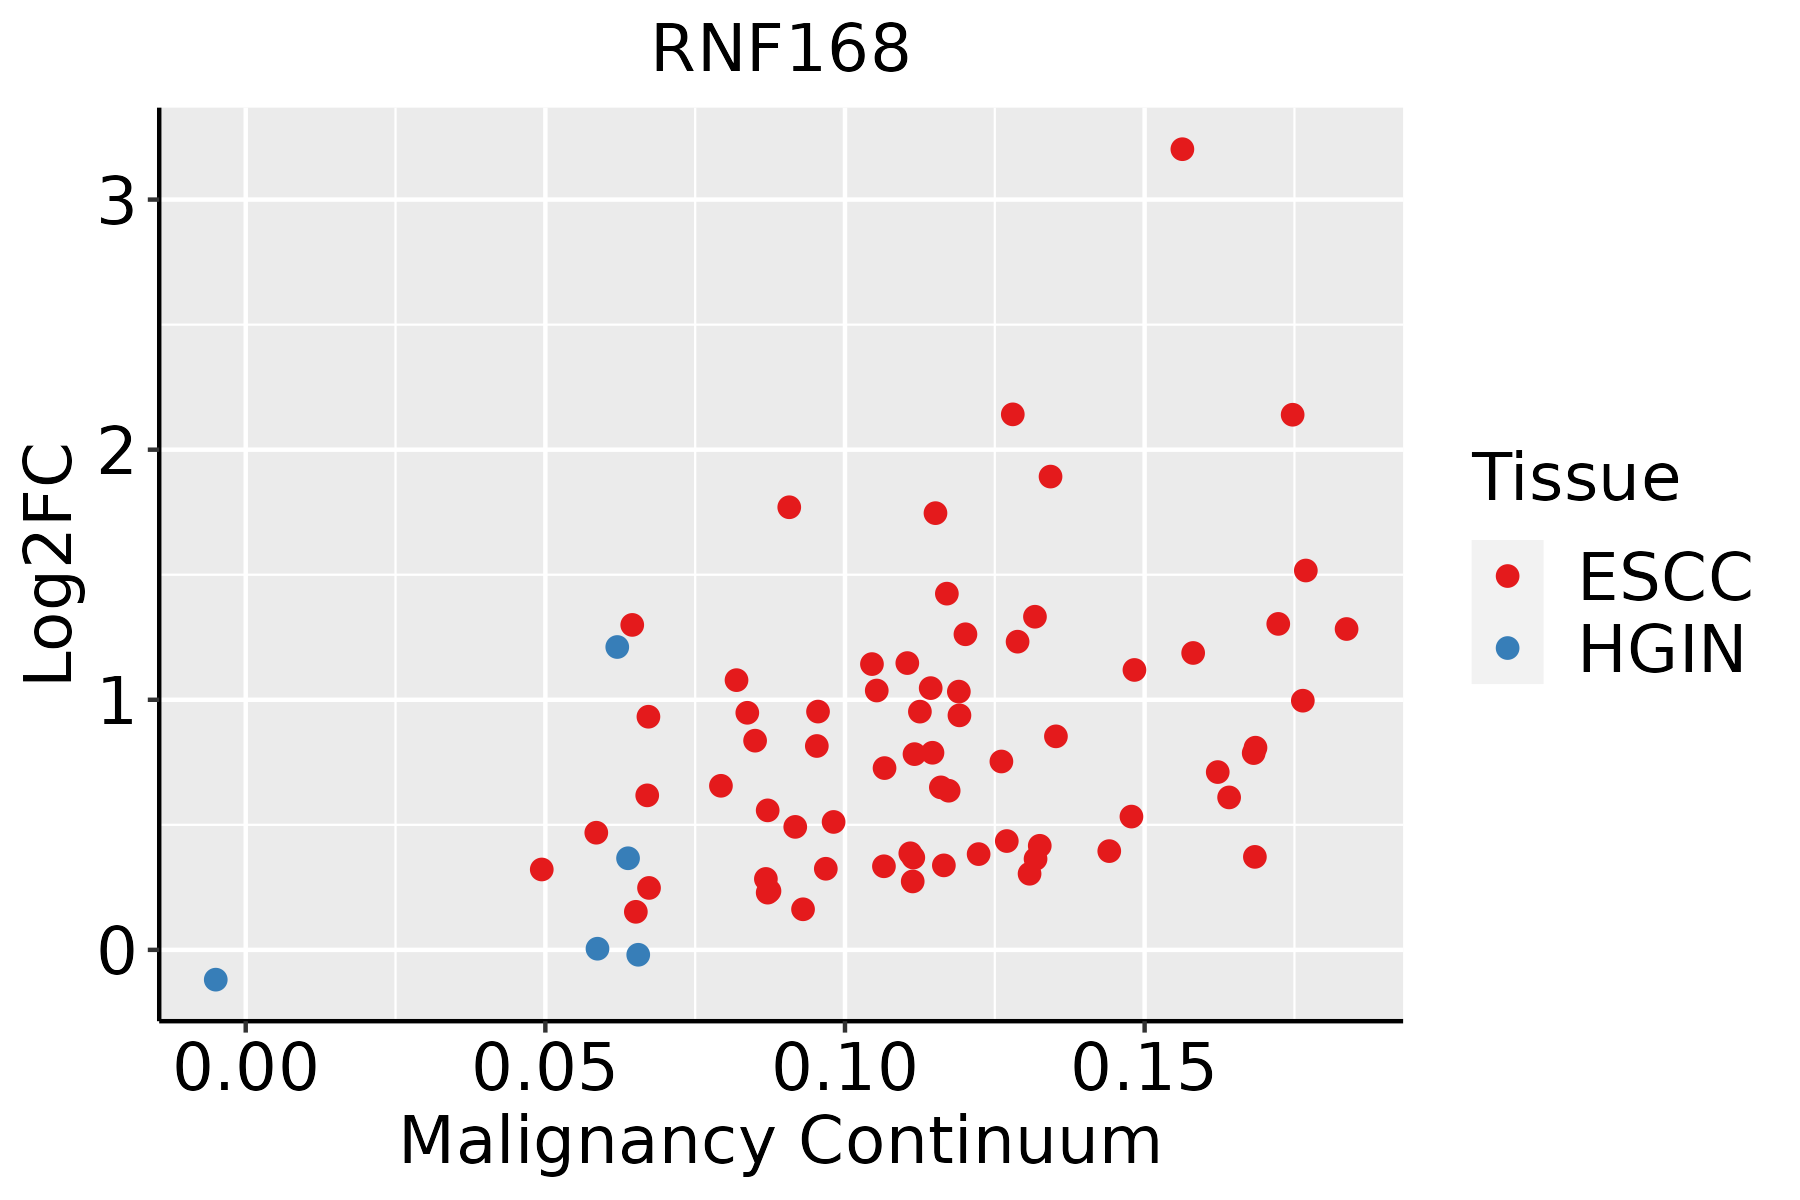 | ESCC: Esophageal squamous cell carcinoma |
| HGIN: High-grade intraepithelial neoplasias |
| LGIN: Low-grade intraepithelial neoplasias |
| Liver | 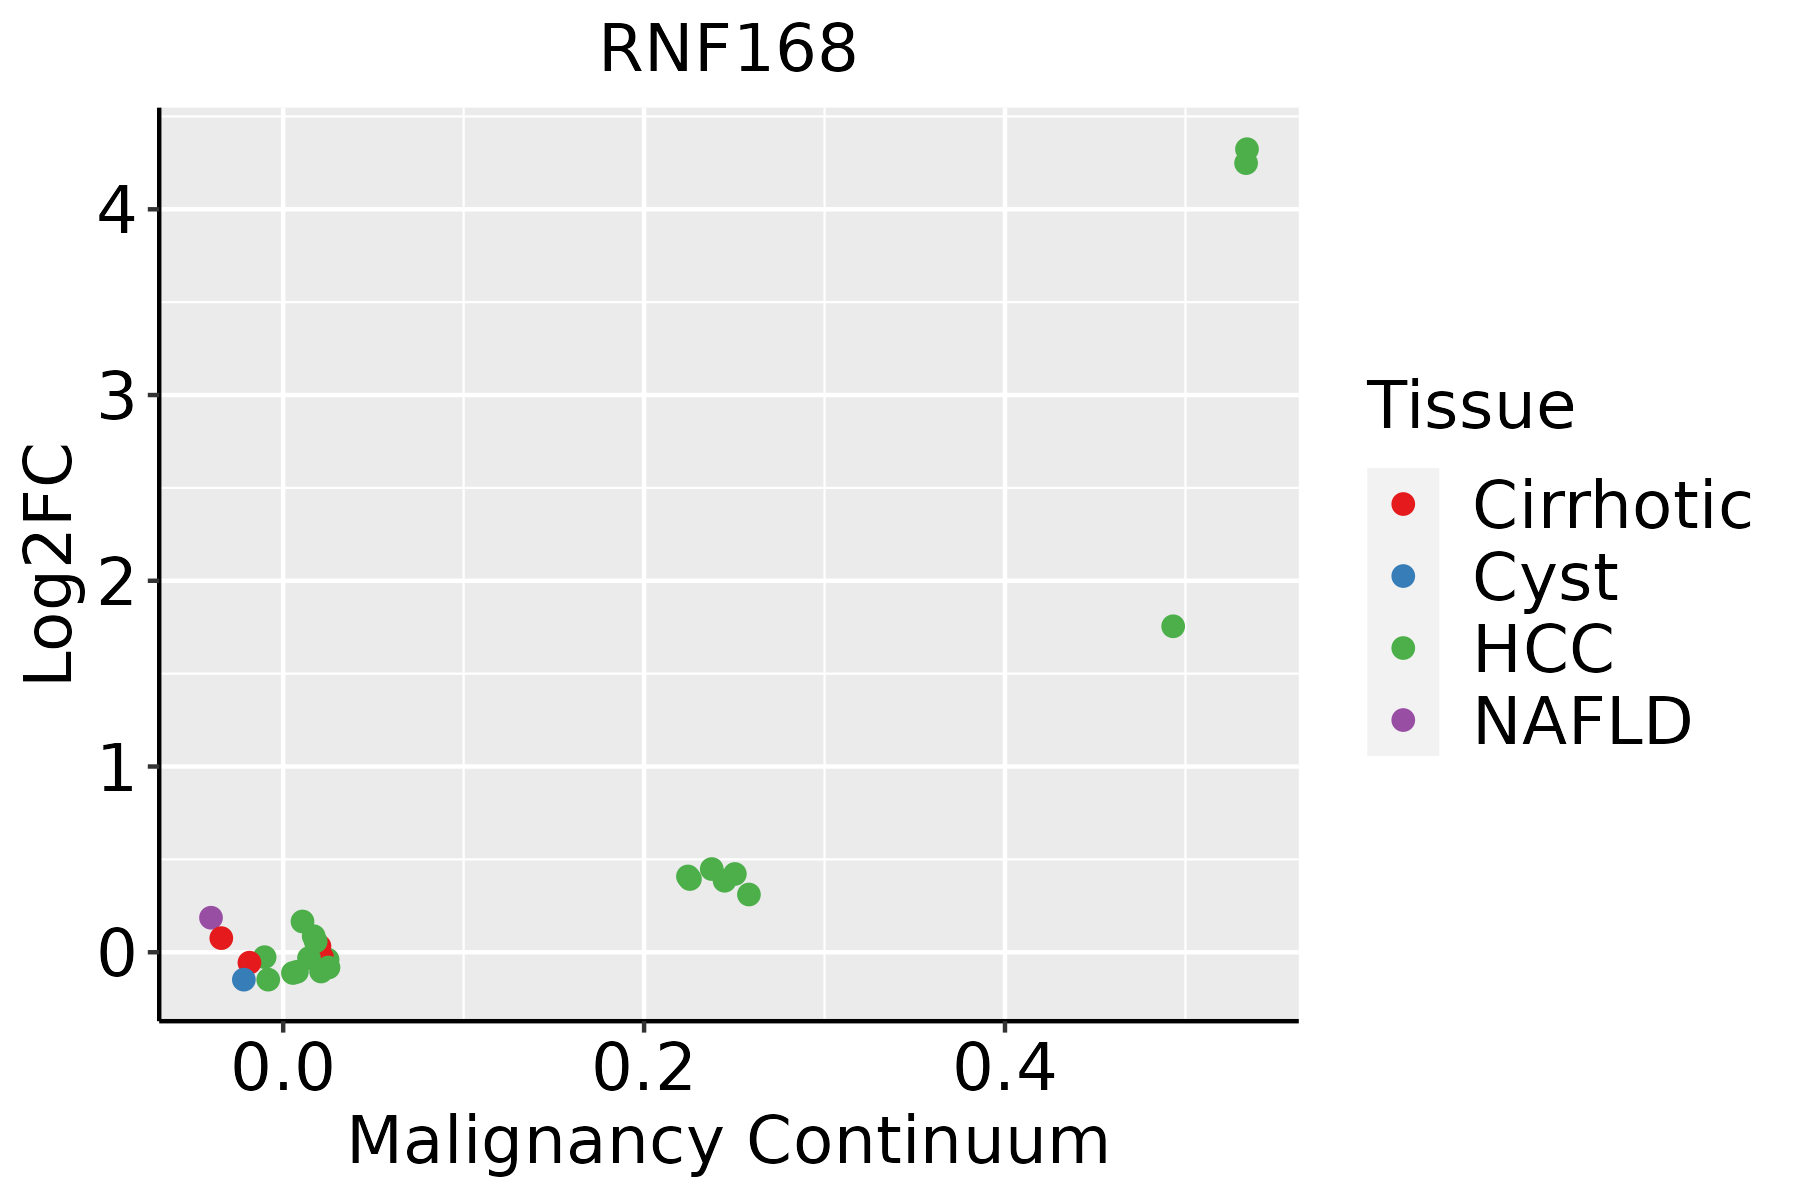 | HCC: Hepatocellular carcinoma |
| NAFLD: Non-alcoholic fatty liver disease |
| Oral Cavity |  | EOLP: Erosive Oral lichen planus |
| LP: leukoplakia |
| NEOLP: Non-erosive oral lichen planus |
| OSCC: Oral squamous cell carcinoma |
| Skin | 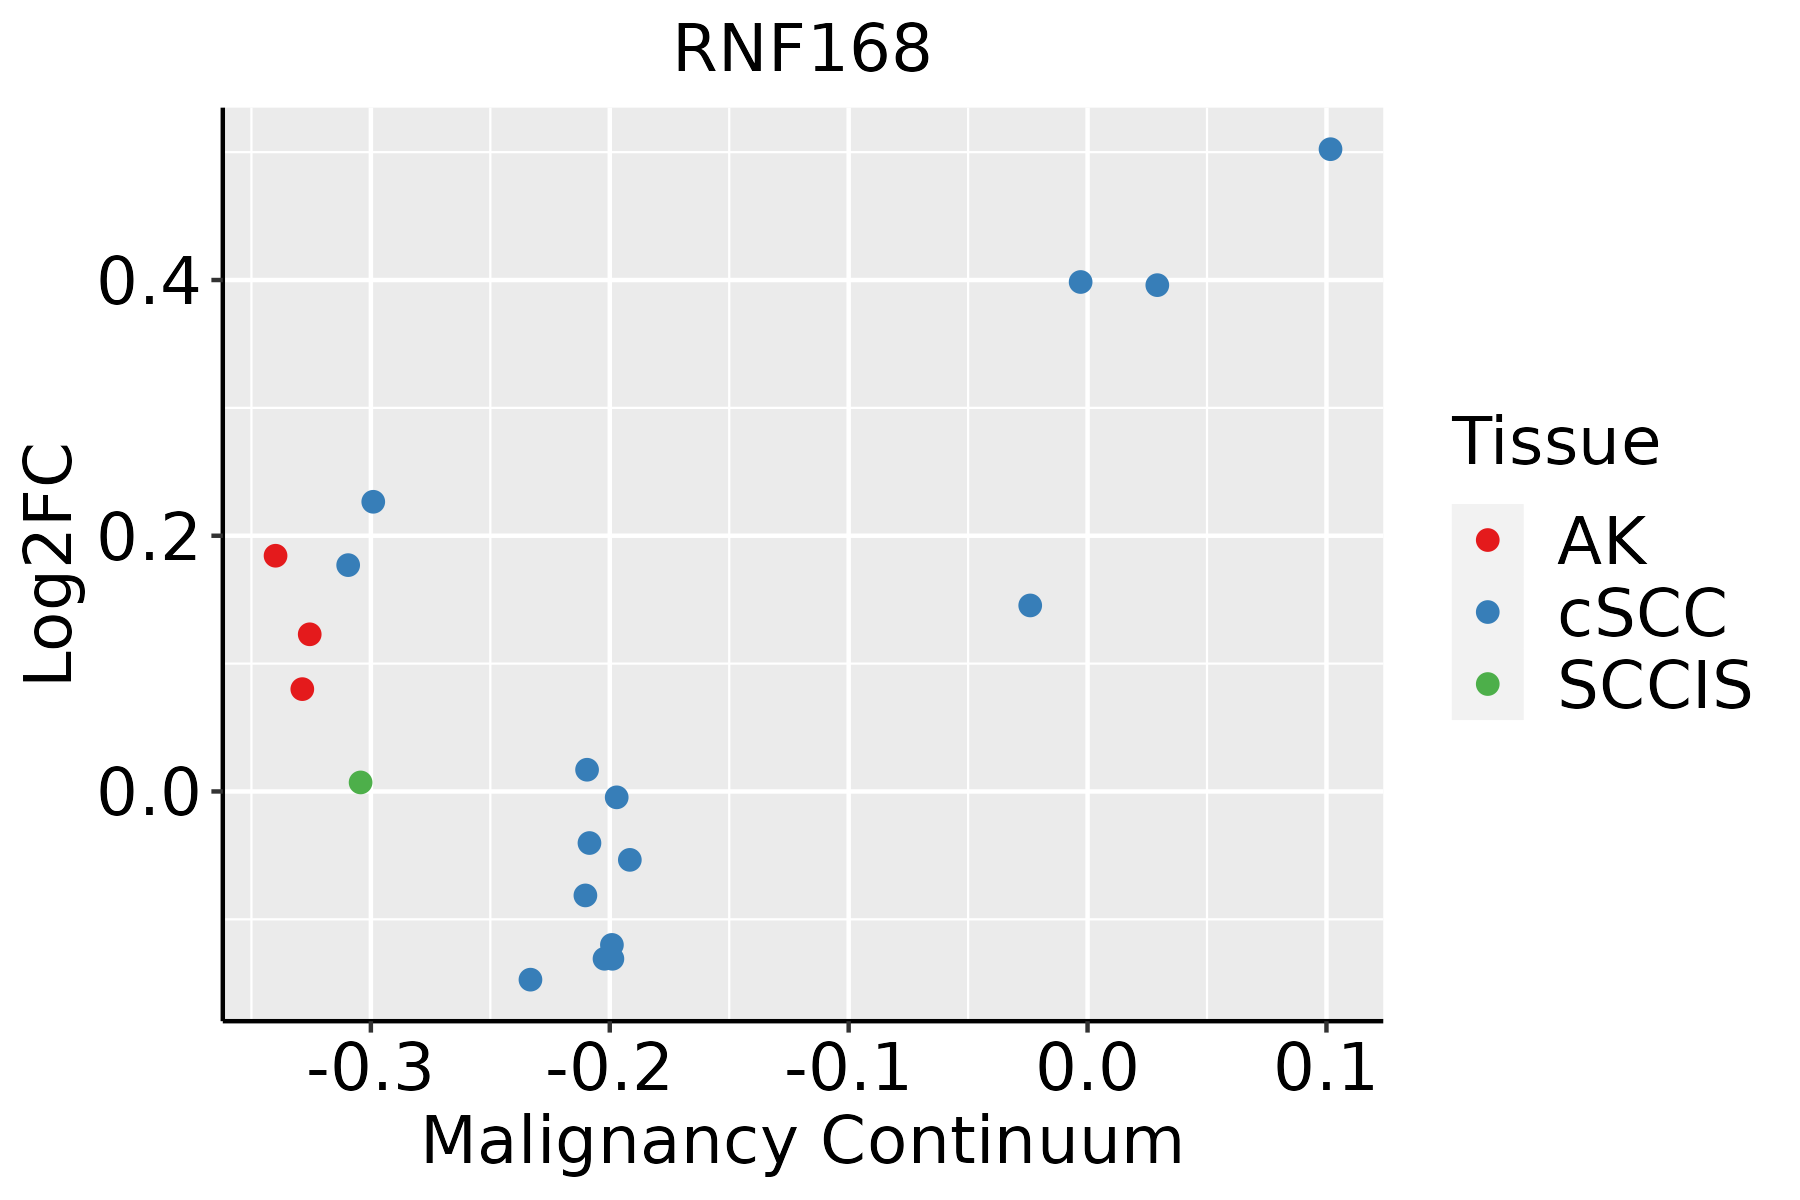 | AK: Actinic keratosis |
| cSCC: Cutaneous squamous cell carcinoma |
| SCCIS:squamous cell carcinoma in situ |
| Thyroid |  | ATC: Anaplastic thyroid cancer |
| HT: Hashimoto's thyroiditis |
| PTC: Papillary thyroid cancer |
| GO ID | Tissue | Disease Stage | Description | Gene Ratio | Bg Ratio | pvalue | p.adjust | Count |
| GO:00002097 | Cervix | CC | protein polyubiquitination | 58/2311 | 236/18723 | 1.57e-07 | 7.41e-06 | 58 |
| GO:00093149 | Cervix | CC | response to radiation | 86/2311 | 456/18723 | 3.50e-05 | 5.63e-04 | 86 |
| GO:00165705 | Cervix | CC | histone modification | 84/2311 | 463/18723 | 1.70e-04 | 2.01e-03 | 84 |
| GO:20010209 | Cervix | CC | regulation of response to DNA damage stimulus | 46/2311 | 219/18723 | 1.92e-04 | 2.23e-03 | 46 |
| GO:00102126 | Cervix | CC | response to ionizing radiation | 34/2311 | 148/18723 | 2.23e-04 | 2.53e-03 | 34 |
| GO:00510528 | Cervix | CC | regulation of DNA metabolic process | 65/2311 | 359/18723 | 9.25e-04 | 7.84e-03 | 65 |
| GO:00024603 | Cervix | CC | adaptive immune response based on somatic recombination of immune receptors built from immunoglobulin superfamily domains | 62/2311 | 356/18723 | 3.09e-03 | 2.03e-02 | 62 |
| GO:00063684 | Cervix | CC | transcription elongation from RNA polymerase II promoter | 17/2311 | 69/18723 | 3.65e-03 | 2.33e-02 | 17 |
| GO:0002263 | Cervix | CC | cell activation involved in immune response | 50/2311 | 279/18723 | 4.16e-03 | 2.57e-02 | 50 |
| GO:0002443 | Cervix | CC | leukocyte mediated immunity | 73/2311 | 440/18723 | 5.01e-03 | 2.98e-02 | 73 |
| GO:00063545 | Cervix | CC | DNA-templated transcription, elongation | 20/2311 | 91/18723 | 6.88e-03 | 3.74e-02 | 20 |
| GO:00705343 | Cervix | CC | protein K63-linked ubiquitination | 14/2311 | 56/18723 | 6.93e-03 | 3.74e-02 | 14 |
| GO:00023813 | Cervix | CC | immunoglobulin production involved in immunoglobulin-mediated immune response | 16/2311 | 70/18723 | 1.01e-02 | 4.91e-02 | 16 |
| GO:000020916 | Esophagus | HGIN | protein polyubiquitination | 58/2587 | 236/18723 | 6.29e-06 | 1.97e-04 | 58 |
| GO:00063687 | Esophagus | HGIN | transcription elongation from RNA polymerase II promoter | 24/2587 | 69/18723 | 8.93e-06 | 2.64e-04 | 24 |
| GO:005105214 | Esophagus | HGIN | regulation of DNA metabolic process | 79/2587 | 359/18723 | 1.38e-05 | 3.85e-04 | 79 |
| GO:200102019 | Esophagus | HGIN | regulation of response to DNA damage stimulus | 52/2587 | 219/18723 | 5.00e-05 | 1.19e-03 | 52 |
| GO:00063548 | Esophagus | HGIN | DNA-templated transcription, elongation | 27/2587 | 91/18723 | 6.62e-05 | 1.52e-03 | 27 |
| GO:005105416 | Esophagus | HGIN | positive regulation of DNA metabolic process | 47/2587 | 201/18723 | 1.65e-04 | 3.21e-03 | 47 |
| GO:00165708 | Esophagus | HGIN | histone modification | 92/2587 | 463/18723 | 1.70e-04 | 3.30e-03 | 92 |
| Hugo Symbol | Variant Class | Variant Classification | dbSNP RS | HGVSc | HGVSp | HGVSp Short | SWISSPROT | BIOTYPE | SIFT | PolyPhen | Tumor Sample Barcode | Tissue | Histology | Sex | Age | Stage | Therapy Types | Drugs | Outcome |
| RNF168 | SNV | Missense_Mutation | novel | c.947N>A | p.Thr316Lys | p.T316K | Q8IYW5 | protein_coding | tolerated(0.31) | benign(0.015) | TCGA-AO-A128-01 | Breast | breast invasive carcinoma | Female | <65 | I/II | Chemotherapy | doxorubicin | SD |
| RNF168 | SNV | Missense_Mutation | | c.527N>G | p.Glu176Gly | p.E176G | Q8IYW5 | protein_coding | deleterious(0) | probably_damaging(0.961) | TCGA-D8-A1XQ-01 | Breast | breast invasive carcinoma | Female | >=65 | I/II | Unknown | Unknown | SD |
| RNF168 | SNV | Missense_Mutation | | c.1220N>C | p.Arg407Thr | p.R407T | Q8IYW5 | protein_coding | deleterious(0) | possibly_damaging(0.84) | TCGA-D8-A27G-01 | Breast | breast invasive carcinoma | Female | >=65 | I/II | Unknown | Unknown | SD |
| RNF168 | SNV | Missense_Mutation | | c.1049N>C | p.Arg350Thr | p.R350T | Q8IYW5 | protein_coding | tolerated(0.14) | benign(0) | TCGA-D8-A27G-01 | Breast | breast invasive carcinoma | Female | >=65 | I/II | Unknown | Unknown | SD |
| RNF168 | SNV | Missense_Mutation | | c.812N>C | p.Ile271Thr | p.I271T | Q8IYW5 | protein_coding | tolerated(0.59) | benign(0.038) | TCGA-E9-A1RG-01 | Breast | breast invasive carcinoma | Female | <65 | III/IV | Hormone Therapy | tamoxiphen | SD |
| RNF168 | insertion | Frame_Shift_Ins | novel | c.113_114insAGGATCTCGCTCCGTCCTCCAGGCTGGA | p.Cys39GlyfsTer62 | p.C39Gfs*62 | Q8IYW5 | protein_coding | | | TCGA-A8-A07R-01 | Breast | breast invasive carcinoma | Female | >=65 | III/IV | Ancillary | zoledronic | SD |
| RNF168 | insertion | Nonsense_Mutation | novel | c.574_575insCCTCAGGATTTCCAGTTTTCTCAAAGTGAACCATTGGATT | p.Gly192AlafsTer10 | p.G192Afs*10 | Q8IYW5 | protein_coding | | | TCGA-AO-A0JB-01 | Breast | breast invasive carcinoma | Female | <65 | III/IV | Chemotherapy | cyclophosphamide | SD |
| RNF168 | SNV | Missense_Mutation | | c.1531N>C | p.Glu511Gln | p.E511Q | Q8IYW5 | protein_coding | tolerated(0.28) | benign(0) | TCGA-DS-A1OC-01 | Cervix | cervical & endocervical cancer | Female | <65 | I/II | Chemotherapy | gemcitabine | SD |
| RNF168 | SNV | Missense_Mutation | | c.1531G>C | p.Glu511Gln | p.E511Q | Q8IYW5 | protein_coding | tolerated(0.28) | benign(0) | TCGA-IR-A3LA-01 | Cervix | cervical & endocervical cancer | Female | <65 | I/II | Chemotherapy | cisplatin | CR |
| RNF168 | SNV | Missense_Mutation | rs766109423 | c.584N>T | p.Ser195Leu | p.S195L | Q8IYW5 | protein_coding | tolerated(1) | benign(0) | TCGA-JW-A5VL-01 | Cervix | cervical & endocervical cancer | Female | <65 | I/II | Unknown | Unknown | SD |


