
|
|||||
|
 | |
| |
| |
| |
| |
| |
|
Gene: RNF167 |
Gene summary for RNF167 |
| Gene information | Species | Human | Gene symbol | RNF167 | Gene ID | 26001 |
| Gene name | ring finger protein 167 | |
| Gene Alias | 5730408C10Rik | |
| Cytomap | 17p13.2 | |
| Gene Type | protein-coding | GO ID | GO:0000209 | UniProtAcc | Q9H6Y7 |
Top |
Malignant transformation analysis |
| Identification of the aberrant gene expression in precancerous and cancerous lesions by comparing the gene expression of stem-like cells in diseased tissues with normal stem cells |
| Entrez ID | Symbol | Replicates | Species | Organ | Tissue | Adj P-value | Log2FC | Malignancy |
| 26001 | RNF167 | HTA11_3410_2000001011 | Human | Colorectum | AD | 1.13e-19 | 4.44e-01 | 0.0155 |
| 26001 | RNF167 | HTA11_2487_2000001011 | Human | Colorectum | SER | 2.21e-18 | 5.89e-01 | -0.1808 |
| 26001 | RNF167 | HTA11_2951_2000001011 | Human | Colorectum | AD | 4.78e-07 | 5.46e-01 | 0.0216 |
| 26001 | RNF167 | HTA11_1938_2000001011 | Human | Colorectum | AD | 9.14e-23 | 7.99e-01 | -0.0811 |
| 26001 | RNF167 | HTA11_78_2000001011 | Human | Colorectum | AD | 5.18e-14 | 5.07e-01 | -0.1088 |
| 26001 | RNF167 | HTA11_347_2000001011 | Human | Colorectum | AD | 3.60e-34 | 7.13e-01 | -0.1954 |
| 26001 | RNF167 | HTA11_411_2000001011 | Human | Colorectum | SER | 1.14e-11 | 1.15e+00 | -0.2602 |
| 26001 | RNF167 | HTA11_2112_2000001011 | Human | Colorectum | SER | 3.06e-05 | 6.68e-01 | -0.2196 |
| 26001 | RNF167 | HTA11_3361_2000001011 | Human | Colorectum | AD | 2.19e-17 | 6.19e-01 | -0.1207 |
| 26001 | RNF167 | HTA11_83_2000001011 | Human | Colorectum | SER | 8.15e-14 | 5.82e-01 | -0.1526 |
| 26001 | RNF167 | HTA11_696_2000001011 | Human | Colorectum | AD | 9.71e-35 | 8.41e-01 | -0.1464 |
| 26001 | RNF167 | HTA11_866_2000001011 | Human | Colorectum | AD | 2.17e-15 | 4.84e-01 | -0.1001 |
| 26001 | RNF167 | HTA11_1391_2000001011 | Human | Colorectum | AD | 1.45e-30 | 1.07e+00 | -0.059 |
| 26001 | RNF167 | HTA11_2992_2000001011 | Human | Colorectum | SER | 6.77e-11 | 7.96e-01 | -0.1706 |
| 26001 | RNF167 | HTA11_5212_2000001011 | Human | Colorectum | AD | 5.25e-18 | 8.77e-01 | -0.2061 |
| 26001 | RNF167 | HTA11_5216_2000001011 | Human | Colorectum | SER | 2.26e-12 | 7.90e-01 | -0.1462 |
| 26001 | RNF167 | HTA11_546_2000001011 | Human | Colorectum | AD | 2.53e-10 | 6.31e-01 | -0.0842 |
| 26001 | RNF167 | HTA11_9341_2000001011 | Human | Colorectum | SER | 7.85e-05 | 6.90e-01 | -0.00410000000000005 |
| 26001 | RNF167 | HTA11_7862_2000001011 | Human | Colorectum | AD | 5.71e-09 | 5.83e-01 | -0.0179 |
| 26001 | RNF167 | HTA11_866_3004761011 | Human | Colorectum | AD | 7.32e-42 | 8.80e-01 | 0.096 |
| Page: 1 2 3 4 5 6 7 8 |
| Tissue | Expression Dynamics | Abbreviation |
| Colorectum (GSE201348) | 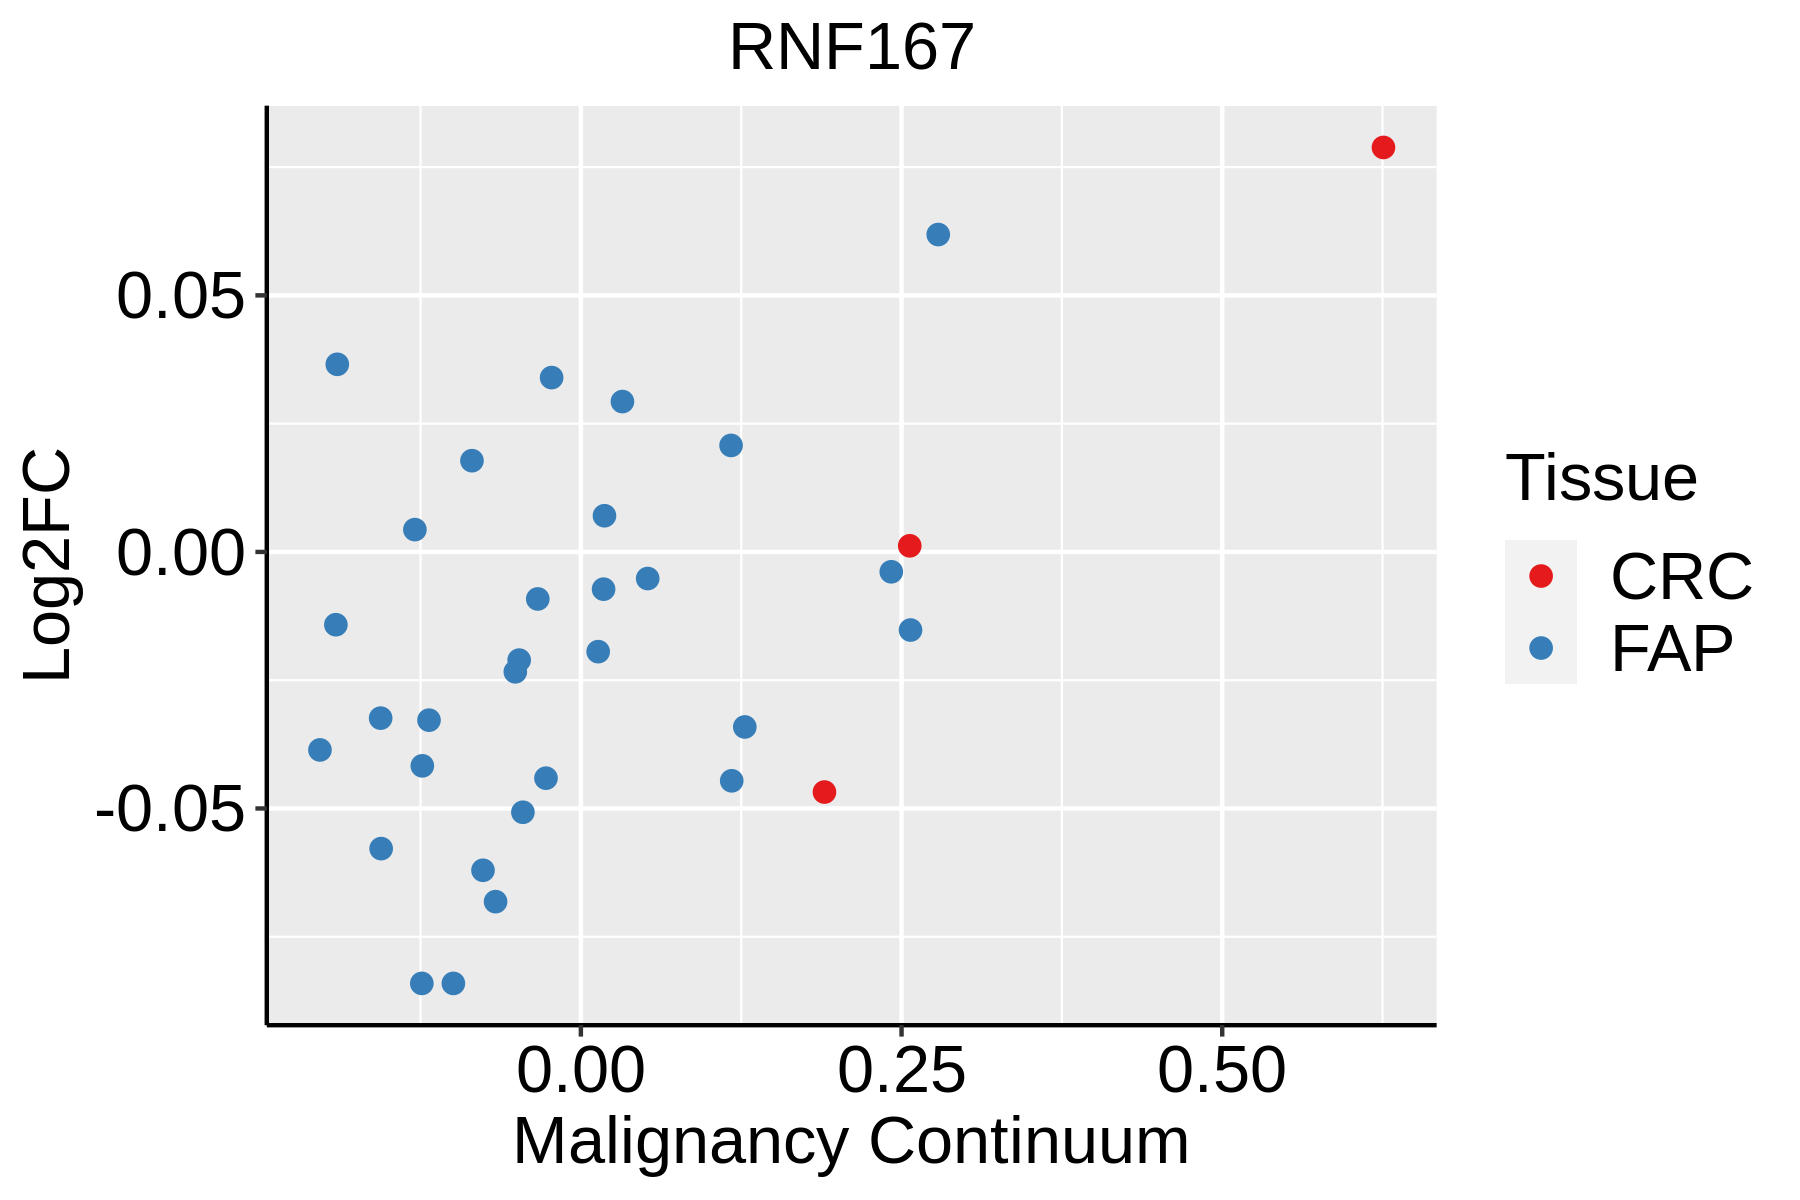 | FAP: Familial adenomatous polyposis |
| CRC: Colorectal cancer | ||
| Colorectum (HTA11) | 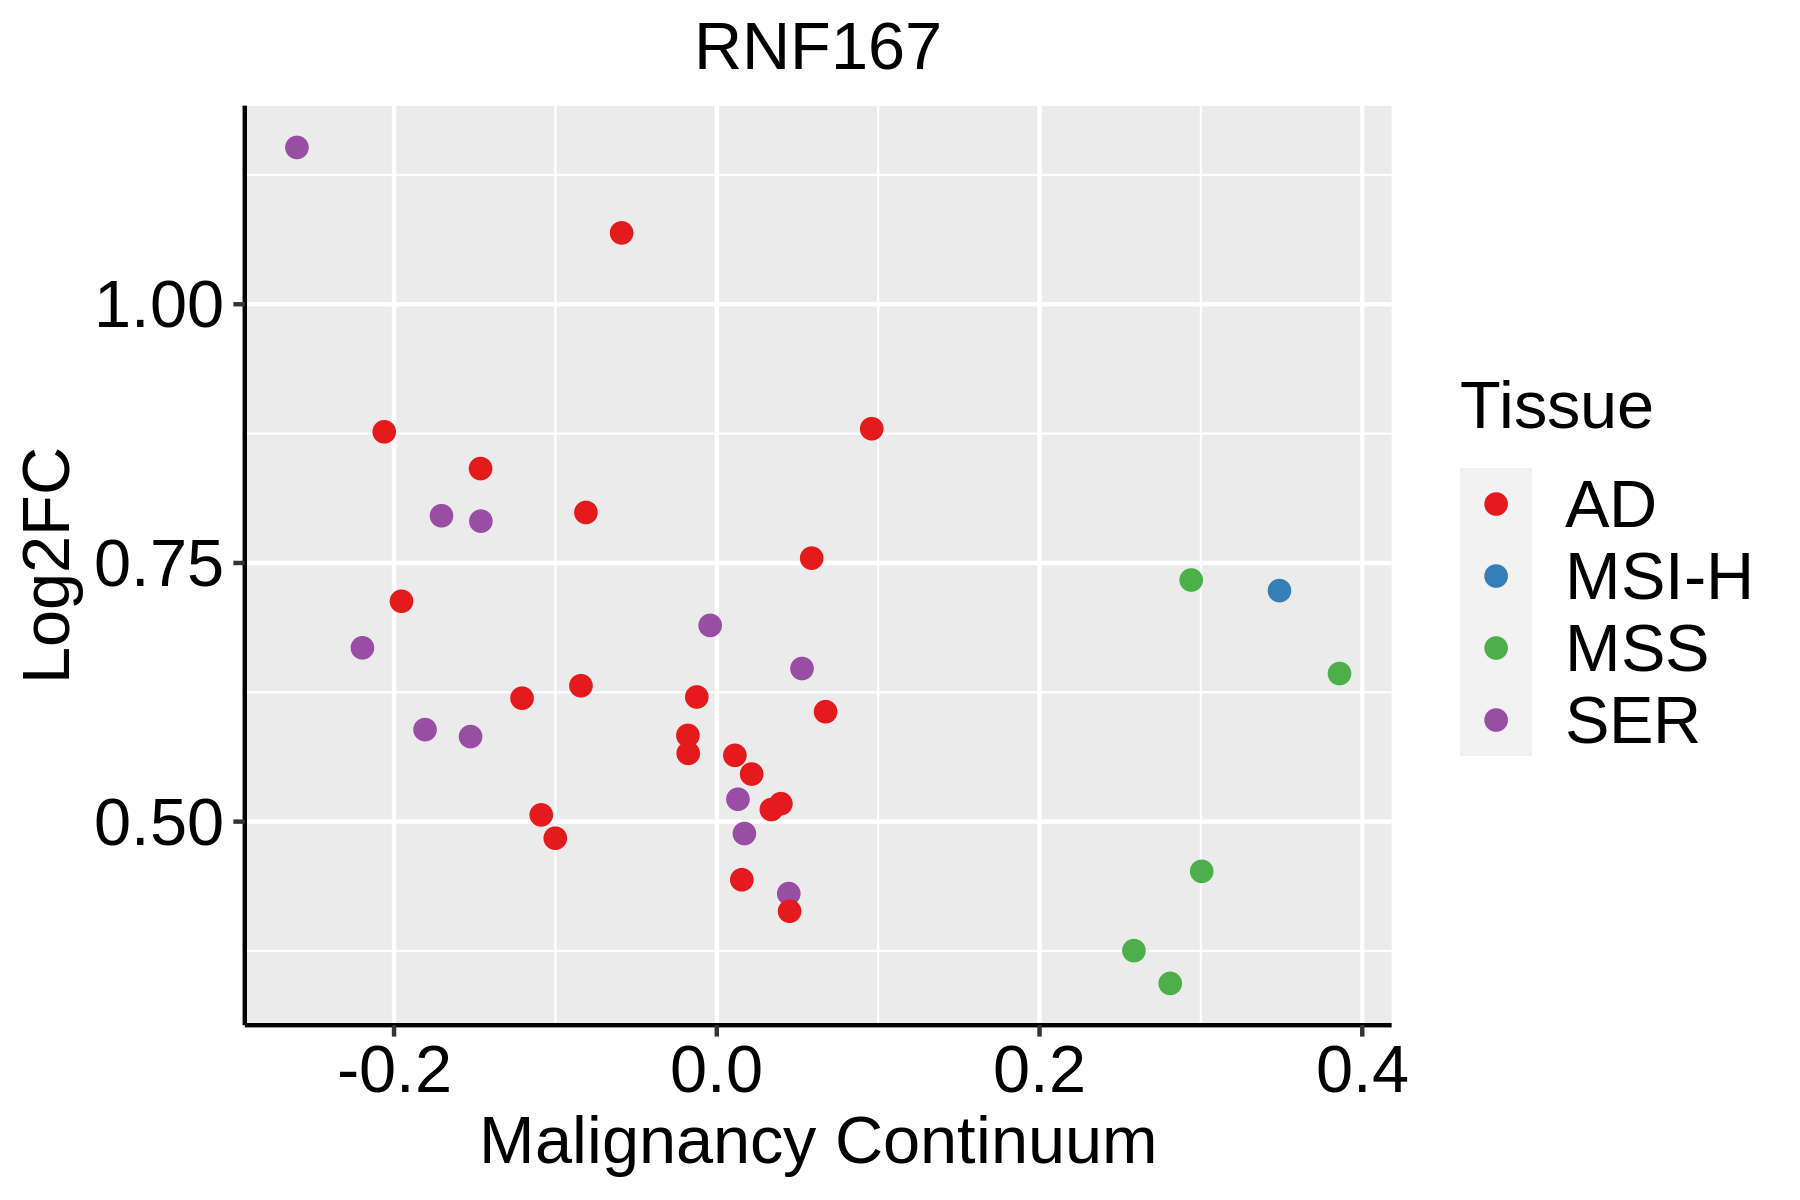 | AD: Adenomas |
| SER: Sessile serrated lesions | ||
| MSI-H: Microsatellite-high colorectal cancer | ||
| MSS: Microsatellite stable colorectal cancer | ||
| Esophagus | 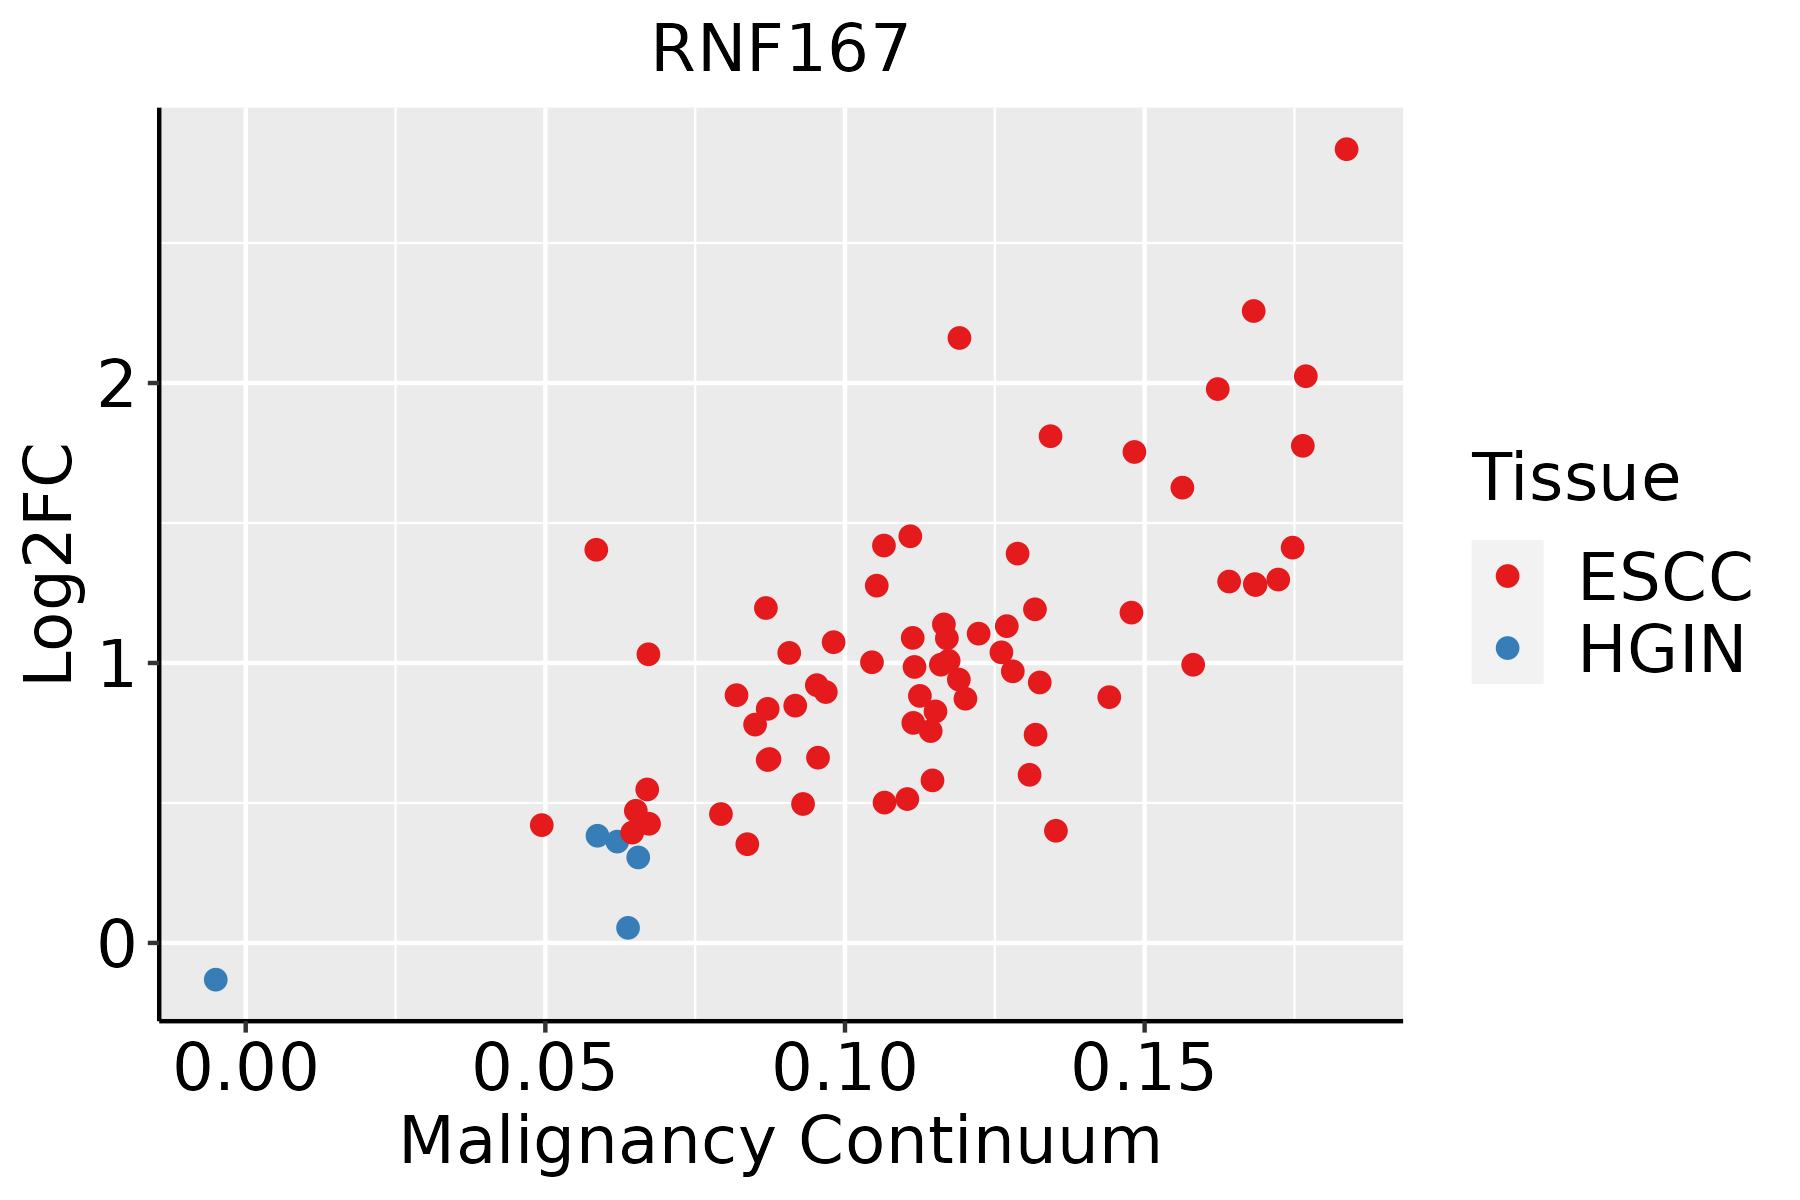 | ESCC: Esophageal squamous cell carcinoma |
| HGIN: High-grade intraepithelial neoplasias | ||
| LGIN: Low-grade intraepithelial neoplasias | ||
| Liver | 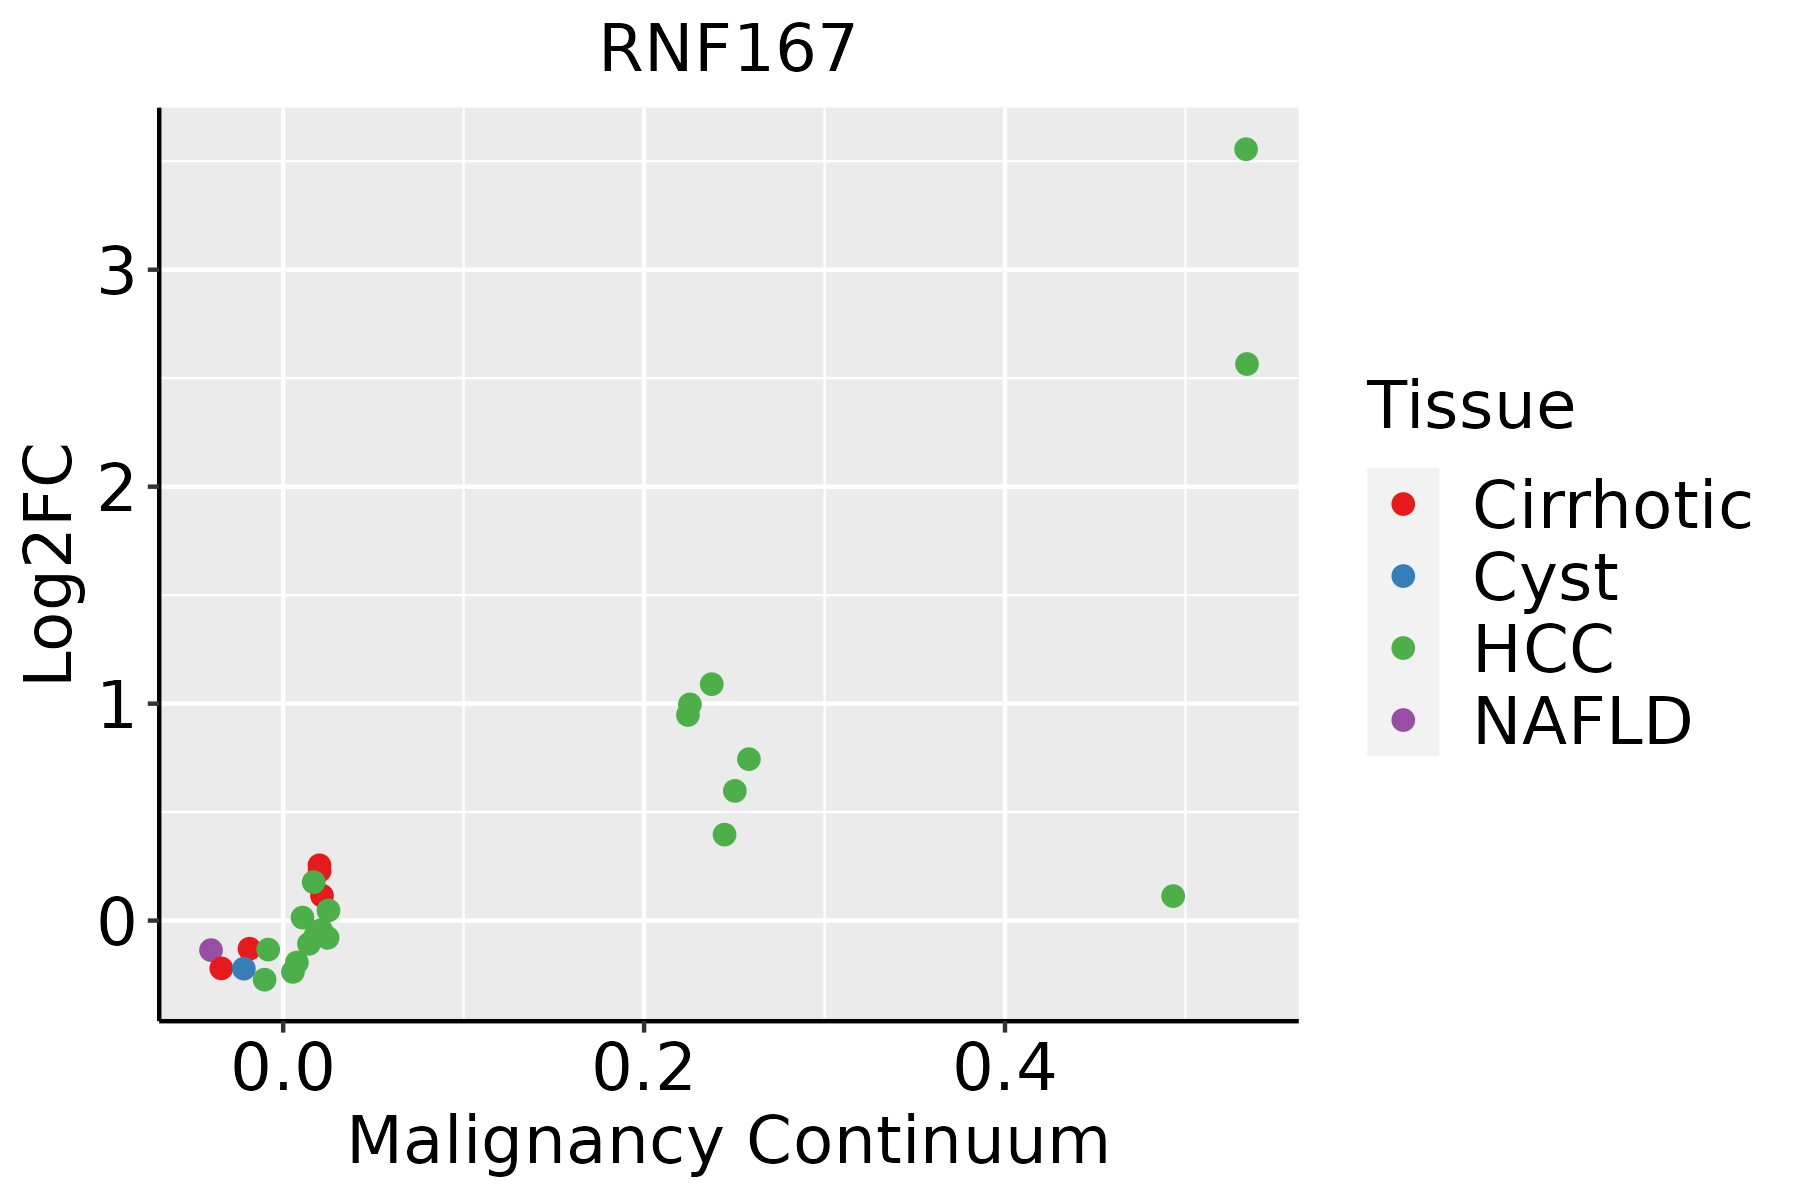 | HCC: Hepatocellular carcinoma |
| NAFLD: Non-alcoholic fatty liver disease | ||
| Oral Cavity |  | EOLP: Erosive Oral lichen planus |
| LP: leukoplakia | ||
| NEOLP: Non-erosive oral lichen planus | ||
| OSCC: Oral squamous cell carcinoma | ||
| Skin | 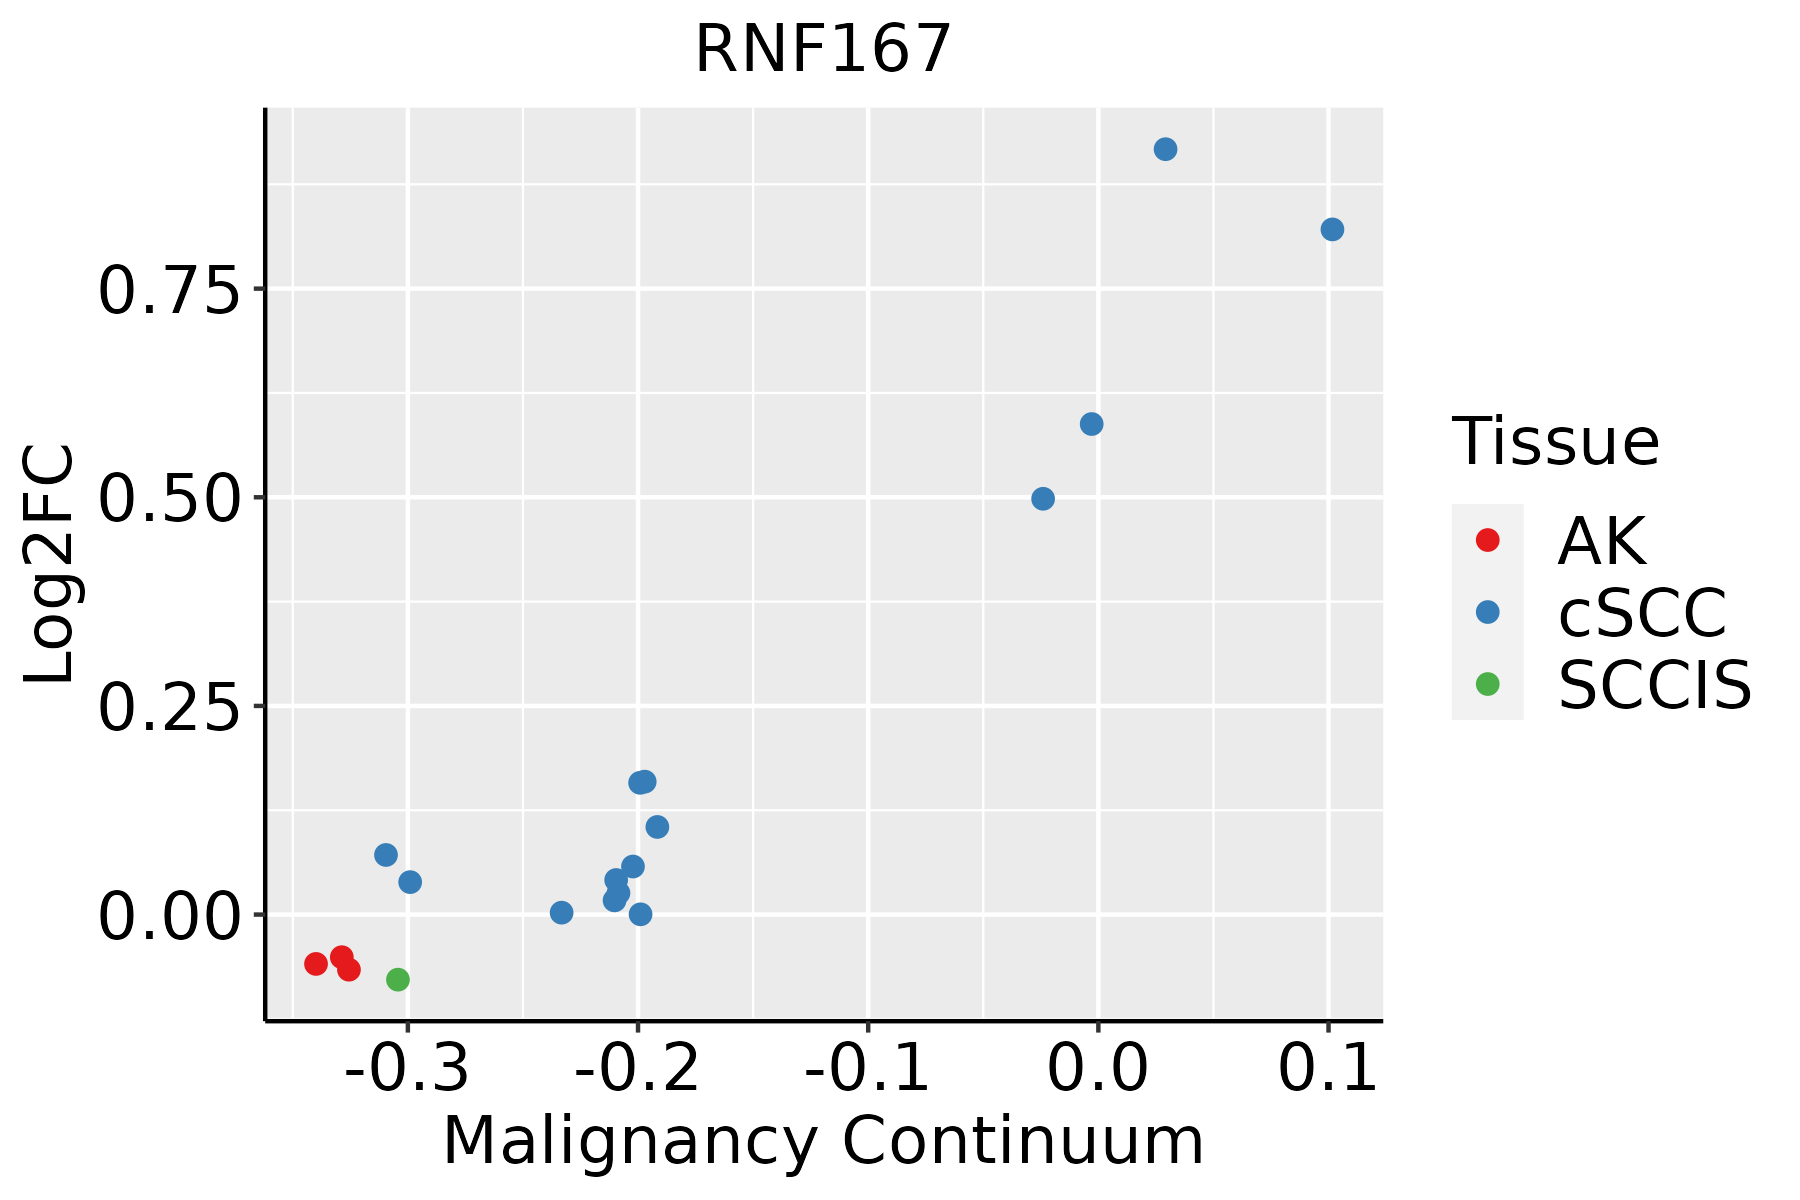 | AK: Actinic keratosis |
| cSCC: Cutaneous squamous cell carcinoma | ||
| SCCIS:squamous cell carcinoma in situ | ||
| Thyroid | 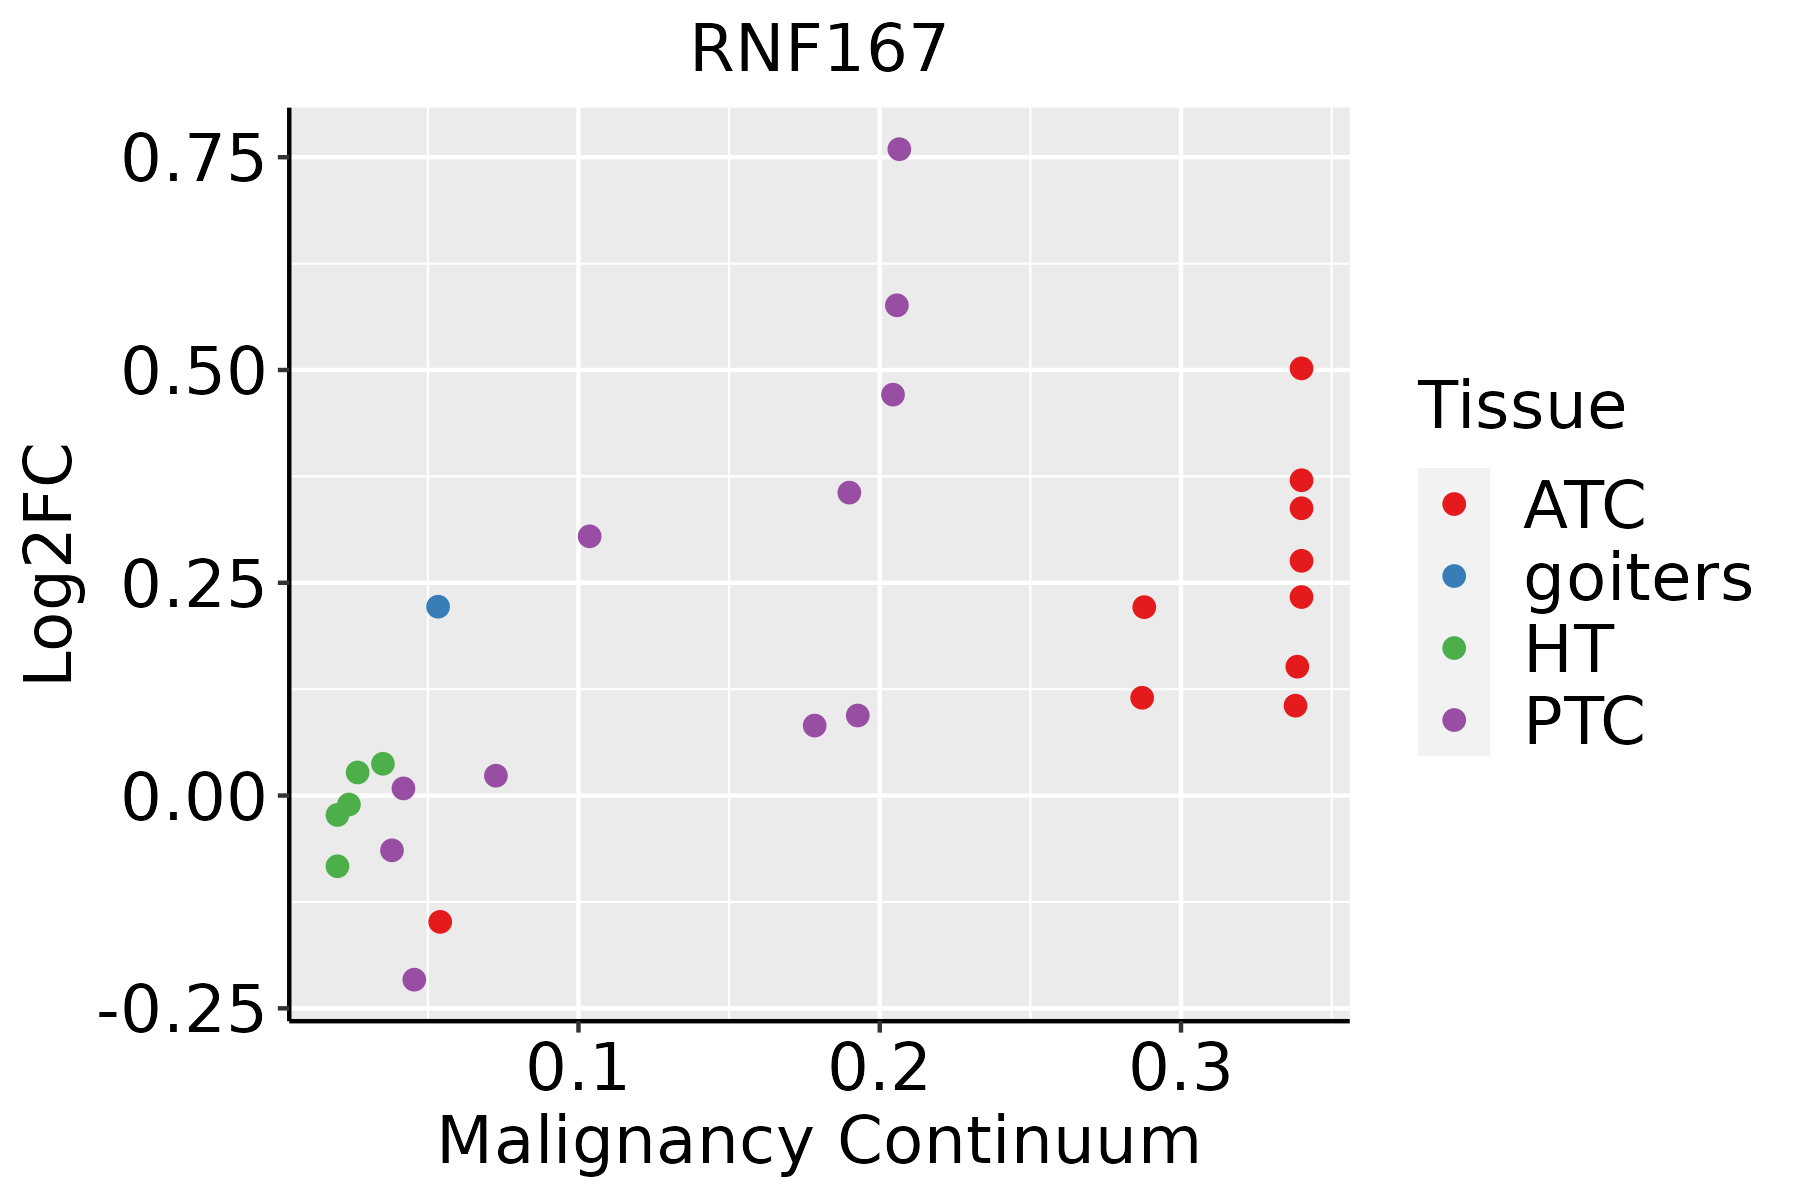 | ATC: Anaplastic thyroid cancer |
| HT: Hashimoto's thyroiditis | ||
| PTC: Papillary thyroid cancer |
| ∗log2FC in expression of this searched gene in stem-like cells from each diseased tissue sample relative to stem-like cells in normal samples in each tissue plotted against the malignancy continuum. Samples are colored based on if they are from different disease stage. |
Top |
Malignant transformation related pathway analysis |
| Find out the enriched GO biological processes and KEGG pathways involved in transition from healthy to precancer to cancer |
| Tissue | Disease Stage | Enriched GO biological Processes |
| Colorectum | AD |  |
| Colorectum | SER |  |
| Colorectum | MSS |  |
| Colorectum | MSI-H |  |
| Colorectum | FAP |  |
| ∗Top 15 enriched GO BP terms are showed in the bar plot of each disease state in each tissue. Each row represents a significant GO biological process which is colored according to the -log10(p.adjust). |
| Page: 1 2 3 4 5 6 7 8 9 |
| GO ID | Tissue | Disease Stage | Description | Gene Ratio | Bg Ratio | pvalue | p.adjust | Count |
| GO:0000209 | Colorectum | AD | protein polyubiquitination | 78/3918 | 236/18723 | 8.71e-06 | 2.06e-04 | 78 |
| GO:00002091 | Colorectum | SER | protein polyubiquitination | 58/2897 | 236/18723 | 1.69e-04 | 3.18e-03 | 58 |
| GO:00002092 | Colorectum | MSS | protein polyubiquitination | 72/3467 | 236/18723 | 5.19e-06 | 1.42e-04 | 72 |
| GO:000020916 | Esophagus | HGIN | protein polyubiquitination | 58/2587 | 236/18723 | 6.29e-06 | 1.97e-04 | 58 |
| GO:000020917 | Esophagus | ESCC | protein polyubiquitination | 170/8552 | 236/18723 | 1.40e-16 | 1.09e-14 | 170 |
| GO:00457865 | Esophagus | ESCC | negative regulation of cell cycle | 236/8552 | 385/18723 | 3.62e-10 | 9.93e-09 | 236 |
| GO:000020911 | Liver | Cirrhotic | protein polyubiquitination | 89/4634 | 236/18723 | 6.09e-06 | 9.80e-05 | 89 |
| GO:000020921 | Liver | HCC | protein polyubiquitination | 151/7958 | 236/18723 | 1.90e-11 | 7.59e-10 | 151 |
| GO:0045786 | Liver | HCC | negative regulation of cell cycle | 204/7958 | 385/18723 | 1.84e-05 | 1.99e-04 | 204 |
| GO:000020910 | Oral cavity | OSCC | protein polyubiquitination | 150/7305 | 236/18723 | 1.59e-14 | 9.27e-13 | 150 |
| GO:00457864 | Oral cavity | OSCC | negative regulation of cell cycle | 206/7305 | 385/18723 | 4.28e-09 | 9.55e-08 | 206 |
| GO:004578612 | Oral cavity | LP | negative regulation of cell cycle | 127/4623 | 385/18723 | 1.33e-04 | 1.53e-03 | 127 |
| GO:000020915 | Oral cavity | LP | protein polyubiquitination | 82/4623 | 236/18723 | 3.23e-04 | 3.26e-03 | 82 |
| GO:000020924 | Skin | cSCC | protein polyubiquitination | 103/4864 | 236/18723 | 2.57e-09 | 9.09e-08 | 103 |
| GO:004578613 | Skin | cSCC | negative regulation of cell cycle | 140/4864 | 385/18723 | 3.64e-06 | 5.50e-05 | 140 |
| GO:000020920 | Thyroid | PTC | protein polyubiquitination | 128/5968 | 236/18723 | 7.81e-13 | 3.65e-11 | 128 |
| GO:00457867 | Thyroid | PTC | negative regulation of cell cycle | 166/5968 | 385/18723 | 1.93e-06 | 2.64e-05 | 166 |
| GO:0000209110 | Thyroid | ATC | protein polyubiquitination | 134/6293 | 236/18723 | 1.86e-13 | 9.20e-12 | 134 |
| GO:004578614 | Thyroid | ATC | negative regulation of cell cycle | 181/6293 | 385/18723 | 2.64e-08 | 5.07e-07 | 181 |
| Page: 1 |
| Pathway ID | Tissue | Disease Stage | Description | Gene Ratio | Bg Ratio | pvalue | p.adjust | qvalue | Count |
| Page: 1 |
Top |
Cell-cell communication analysis |
| Identification of potential cell-cell interactions between two cell types and their ligand-receptor pairs for different disease states |
| Ligand | Receptor | LRpair | Pathway | Tissue | Disease Stage |
| Page: 1 |
Top |
Single-cell gene regulatory network inference analysis |
| Find out the significant the regulons (TFs) and the target genes of each regulon across cell types for different disease states |
| TF | Cell Type | Tissue | Disease Stage | Target Gene | RSS | Regulon Activity |
| ∗The dot plots of a searched regulon are shown for all cell subpopulations in each disease state of each tissue based on the regulon specific score inferred using pySCENIC and by calculating the average expression. |
| Page: 1 |
Top |
Somatic mutation of malignant transformation related genes |
| Annotation of somatic variants for genes involved in malignant transformation |
| Hugo Symbol | Variant Class | Variant Classification | dbSNP RS | HGVSc | HGVSp | HGVSp Short | SWISSPROT | BIOTYPE | SIFT | PolyPhen | Tumor Sample Barcode | Tissue | Histology | Sex | Age | Stage | Therapy Types | Drugs | Outcome |
| RNF167 | SNV | Missense_Mutation | novel | c.916N>C | p.Glu306Gln | p.E306Q | Q9H6Y7 | protein_coding | deleterious(0) | probably_damaging(0.998) | TCGA-BH-A0B6-01 | Breast | breast invasive carcinoma | Female | <65 | I/II | Unknown | Unknown | SD |
| RNF167 | SNV | Missense_Mutation | rs754895476 | c.263N>A | p.Arg88Gln | p.R88Q | Q9H6Y7 | protein_coding | deleterious(0) | probably_damaging(0.987) | TCGA-C5-A2LV-01 | Cervix | cervical & endocervical cancer | Female | <65 | I/II | Unknown | Unknown | SD |
| RNF167 | SNV | Missense_Mutation | novel | c.80G>A | p.Arg27Gln | p.R27Q | Q9H6Y7 | protein_coding | tolerated(0.27) | probably_damaging(0.953) | TCGA-VS-A9UC-01 | Cervix | cervical & endocervical cancer | Female | <65 | I/II | Chemotherapy | cisplatin | SD |
| RNF167 | SNV | Missense_Mutation | novel | c.203G>T | p.Ser68Ile | p.S68I | Q9H6Y7 | protein_coding | tolerated(0.14) | possibly_damaging(0.627) | TCGA-ZJ-AAX8-01 | Cervix | cervical & endocervical cancer | Female | <65 | III/IV | Unknown | Unknown | SD |
| RNF167 | SNV | Missense_Mutation | c.802N>C | p.Cys268Arg | p.C268R | Q9H6Y7 | protein_coding | deleterious(0) | probably_damaging(1) | TCGA-AA-3672-01 | Colorectum | colon adenocarcinoma | Female | >=65 | III/IV | Unknown | Unknown | SD | |
| RNF167 | SNV | Missense_Mutation | c.241T>C | p.Ser81Pro | p.S81P | Q9H6Y7 | protein_coding | tolerated(0.08) | probably_damaging(0.959) | TCGA-AA-3715-01 | Colorectum | colon adenocarcinoma | Male | >=65 | I/II | Unknown | Unknown | PD | |
| RNF167 | SNV | Missense_Mutation | novel | c.299N>G | p.Asn100Ser | p.N100S | Q9H6Y7 | protein_coding | deleterious(0.03) | benign(0.217) | TCGA-CA-6717-01 | Colorectum | colon adenocarcinoma | Male | <65 | I/II | Chemotherapy | oxaliplatin | CR |
| RNF167 | SNV | Missense_Mutation | rs760638375 | c.844N>A | p.Glu282Lys | p.E282K | Q9H6Y7 | protein_coding | tolerated(0.24) | benign(0.022) | TCGA-G4-6304-01 | Colorectum | colon adenocarcinoma | Female | >=65 | I/II | Chemotherapy | fluorouracil | PD |
| RNF167 | SNV | Missense_Mutation | rs775675214 | c.731G>A | p.Arg244Gln | p.R244Q | Q9H6Y7 | protein_coding | deleterious(0.03) | probably_damaging(0.999) | TCGA-G4-6320-01 | Colorectum | colon adenocarcinoma | Male | >=65 | III/IV | Chemotherapy | oxaliplatin | SD |
| RNF167 | SNV | Missense_Mutation | novel | c.487N>A | p.Val163Ile | p.V163I | Q9H6Y7 | protein_coding | tolerated(0.66) | benign(0.074) | TCGA-A5-A0G2-01 | Endometrium | uterine corpus endometrioid carcinoma | Female | <65 | III/IV | Unknown | Unknown | SD |
| Page: 1 2 3 |
Top |
Related drugs of malignant transformation related genes |
| Identification of chemicals and drugs interact with genes involved in malignant transfromation |
| (DGIdb 4.0) |
| Entrez ID | Symbol | Category | Interaction Types | Drug Claim Name | Drug Name | PMIDs |
| Page: 1 |

Copyright 2023-Present -The University of Texas Health Science Center at Houston |